
Abstract
Drug combinations are essential to modern medicine, but their discovery remains slow and inefficient as experimental complexity expands rapidly with each additional drug tested. Although modern liquid handling systems enable complex and highly customizable experimental designs, a lack of strategies integrating these technologies with combination-specific analytical methods has limited throughput. Here we introduce Combocat, an open-source and streamlined framework that combines acoustic liquid handling protocols with machine learning-based inference to achieve ultrahigh-throughput drug combination screening. Using Combocat, we generate a reference dataset of over 800 unique combinations in a dense 10 × 10 matrix format across multiple cell types, and use this to train a predictive model that accurately infers drug combination effects from sparse data, drastically reducing the number of experimental measurements required. As proof of concept, we screened 9,045 combinations in a neuroblastoma cell line—the largest number of combinations tested in a single cell line to date—achieved using minimal resources. By integrating advanced drug dispensing technologies with predictive computational modeling, Combocat provides a scalable solution to accelerate the discovery of novel drug combinations.
Introduction
The development of effective drug combinations is fundamental to modern therapeutic strategies1,2,3,4, particularly for cancers5,6 and infectious diseases2,7,8,9 where single-agent therapies often fail to achieve sustained efficacy. Combining drugs can have a synergistic effect on drug efficacy, overcoming resistance mechanisms and reducing the toxicity of treatment by requiring lower individual doses of each drug10,11. Synergy, in this context, is defined as a combination effect that exceeds expectations based on individual drug activities under established models like Bliss independence12 (Fig. 1a).
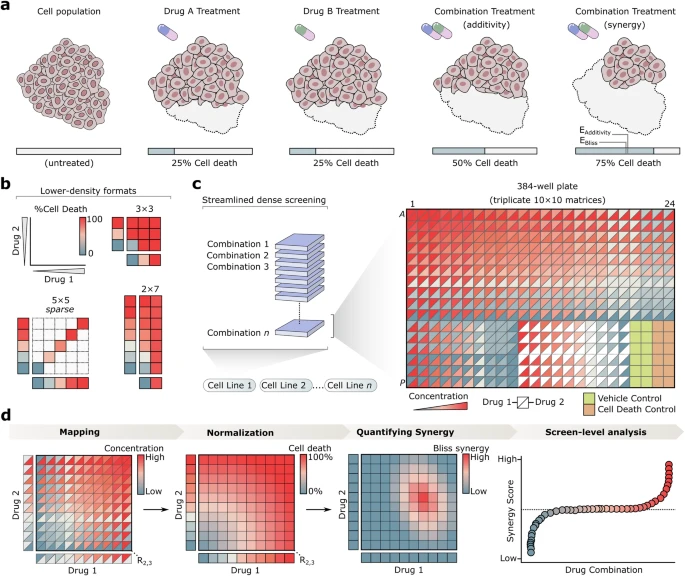
a Practical representation of drug synergy, where the combined effect of two drugs exceeds the expected effect (“E”) based on models like additivity or Bliss independence. b Examples of traditional high-throughput screens employing small (e.g., 3 × 3), sparse, or asymmetric (e.g., 2 × 7) matrix formats, which limit dose density. c Combocat’s streamlined approach for dense and reproducible drug combination screening. The 384-well plate format contains Drugs 1 and 2 (represented by upper and lower triangles, respectively), with concentrations shown ranging from low (blue) to high (red). Three replicate 10 × 10 combination matrices are generated for each drug pair, along with three replicates of each single-agent dose-response. Twelve replicates each of cell death (orange) and vehicle (yellow) controls are included for normalization. d Overview of the Combocat analytical pipeline. Raw data are mapped to corresponding combination matrices and subsequently normalized to percentage cell death using controls. Synergy is then quantified using the Bliss independence model. Results are summarized across the screen to identify top synergistic interactions.
Combination therapy is a promising frontier—but also a vast one whose comprehensive exploration has been limited by the sheer number of possible drug combinations10. With each additional agent tested, the number of total possible 2-drug combinations increases quadratically, making exhaustive experimental testing impractical. While large-scale single-agent screens have evaluated tens of thousands of compounds13,14,15, drug combination screens have remained constrained by technical and resource limitations, preventing them from achieving comparable scale. These constraints often force researchers to choose between the number of combinations tested and the number of concentrations measured per drug, or dose density. This tradeoff can prove problematic, as dense measurements across a broad range of concentrations are crucial for capturing the nuanced dose-response landscapes needed to reliably detect synergy patterns16. Consequently, some of the largest reported combination studies have adopted smaller17, sparser18, or asymmetric19,20 matrix formats (Fig. 1b). Advancements in robotic liquid handling technologies, such as acoustic dispensing, have revolutionized compound transfer, enabling more flexible and precise experimental designs. Acoustic liquid handlers can dispense nanoliter volumes from any well of a source plate to any well of a destination plate without physical contact, enhancing throughput and minimizing resource consumption. Despite the promise of these technological advances, their impact on drug combination screening has so far been limited by a lack of integrated experimental and analytical platforms that fully leverage their capabilities.
Here, we introduce Combocat, an open-source, end-to-end platform that integrates experimental and analytical workflows, underpinned by detailed protocols and documentation to enable reproducible, interpretable, and user-friendly drug combination screens. Combocat operates in two complementary modes, each facilitating fast and efficient combination screening. The “dense mode” measures all pairwise dose combinations in a dense 10 × 10 matrix format, tested in triplicate to ensure high fidelity and data quality. Using dense mode, we generated a comprehensive reference dataset of over 290,000 unique combination measurements (spanning 806 unique drug combinations) across diverse drugs and cell types. While this approach is ideal for high-quality data-rich screens, scaling dense mode to thousands of combinations is resource-intensive. To address this, we developed a machine learning-assisted “sparse mode”. Sparse mode reduces the number of direct experimental measurements by testing only the diagonal (10 dose pairs) of the 10 × 10 matrix and single-agent responses, then uses predictive modeling to obtain the remaining 90 values. Trained on the dense mode reference dataset, the predictive models in sparse mode enable ultrahigh-throughput screening with minimal resources. Notably, several other machine learning frameworks have been developed to predict synergy in different ways: TranSynergy21 leverages drug-target and gene-dependency features, SynToxProfiler22 computes integrated efficacy-toxicity-synergy surfaces, and comboFM23 uses tensor factorization to impute missing dose-response values. In contrast, Combocat’s sparse mode measures only the 10 diagonal dose pairs and recovers the complete 10 × 10 response landscape via an ensemble of 90 per-pair regression models. As proof of concept, we used sparse mode to screen 9045 drug combinations in the neuroblastoma cell line CHP-134, representing the largest number of unique combinations tested in a single cell line to date. By integrating advanced liquid handling technologies with machine learning into an open-source and user-friendly platform, Combocat offers a scalable, efficient solution for accelerating the discovery of drug combinations.
Results
Streamlined dense drug combination screening
To address longstanding challenges in drug combination screens—such as limited dose density, poor interpretability, and operational complexity–we developed Combocat to integrate experimental and analytical workflows into a user-friendly framework. The “dense mode” workflow facilitates comprehensive, dense measurements by systematically evaluating all pairwise dose combinations in a 10 × 10 matrix format (Fig. 1c). A customized acoustic liquid handling protocol prepares each 384-well plate with two drugs at ten concentrations each, including three replicate 10 × 10 combination matrices, single-agent dose-response curves, and internal controls (for example, twelve replicates each of cell death and vehicle controls). This design ensures robust normalization and reproducibility while reducing the time and effort typically associated with high-throughput combination screens.
Building on this experimental foundation, the analytical pipeline (Fig. 1d) maps raw data to their corresponding matrix positions, normalizes values to percentage cell death, and quantifies synergy using the Bliss independence model. Results are then filtered and ranked, enabling researchers to rapidly identify top-performing combinations and visualize complete synergy landscapes without extensive post-processing. By uniting dense measurements with a streamlined analytical workflow, Combocat’s dense mode provides a high-fidelity framework for characterizing drug interactions in a reproducible and operationally straightforward manner.
A reference dataset of dense drug combinations
Applying dense mode, we generated a reference dataset of 806 drug combinations comprising over 290,000 individual measurements in the 10 × 10 matrix format (Supplementary Data 1). This dataset was designed to evaluate a diverse range of drugs and cell types, ensuring generalizability across multiple experimental contexts. Assay quality was high, as indicated by Z′ values (mean = 0.747; Supplementary Fig. 1) and low standard deviations in both single-agent and combination measurements across the screen (Fig. 2a, b).

a Distribution of single-agent standard deviations. The standard deviation is measured across each dose of all single-agent drugs across their respective three replicates. b Distribution of combination standard deviations. For each drug combination, the standard deviation is measured across all 100 dose pairs and their respective three replicates. c Mean adjusted Bliss synergy (Blissadj.) for all tested drug combinations. Each point represents the mean Blissadj. value across the 100 dose pairs per combination. SMX_TMP is highlighted as the top-ranking combination. d Dose-response curves for SMX (top) and TMP (bottom). Four-parameter log-logistic curves were fit to the mean cell death values from the 10 doses. Individual replicate values are represented by smaller gray dots. Horizontal dashed lines correspond to 50% cell death. Vertical dashed lines correspond to IC50 concentrations. e Cell death combination matrix, represented as the mean of the three replicates. f Bliss synergy matrix calculated from (e). g Cell death for each single agent and their combination at doses corresponding to the maximum synergy. The red dashed line indicates the expected response value under the Bliss model. h–k Like (d–g), for the combination of AZD1390 and CX-5461.
During analysis, we identified occasional spurious single-agent measurements, a common challenge in high-throughput screens24. These anomalies, often resulting from incomplete drug transfer or other technical issues, can distort synergy calculations by introducing outliers into the dataset (Supplementary Fig. 2a–d). To address this, we implemented a rigorous quality control (QC) pipeline that flags and adjusts anomalous data points using predefined thresholds for variability, dose-response residuals, and monotonicity (Supplementary Fig. 2e–g; see “Methods” section for details). Flagged values can be excluded from subsequent synergy calculations, yielding an “adjusted Bliss synergy” (Blissadj.) that omits these measurements. This QC approach ensures accurate synergy quantification by minimizing the impact of outliers.
To evaluate the platform’s capacity to identify and replicate known synergistic interactions, we first examined the top-ranked combination in our dataset: sulfamethoxazole (SMX) and trimethoprim (TMP) in E. coli cells (Fig. 2c). This pair is a well-established example of synergistic drug behavior9, widely used to treat various bacterial infections25. Both SMX and TMP displayed sigmoidal dose-dependent relationships (Fig. 2d), and when combined, exhibited strong synergy (Fig. 2e–g), aligning with established expectations. We further evaluated an additional known example of synergy included in our screen—the combination of AZD1390 and CX-5461—which has been reported as synergistic in Neuroblastoma cells26. The single-agent responses and strong synergy patterns (Fig. 2h–k) closely aligned to reported findings26. Collectively, these examples highlight Combocat’s ability to faithfully reproduce known synergistic interactions and provide a framework for understanding complex combination landscapes.
Sparse mode screening workflow
While dense mode offers high-quality, data-rich combination measurements, scaling it to thousands of combinations can become resource-intensive. To address this, we developed a “sparse mode” workflow, which minimizes direct experimental measurements while still capturing synergy information between drug pairs. The sparse mode assay is miniaturized into a 1536-well format and separates the single agents and combinations into their own plates (Supplementary Fig. 3a, b). Single-agent plates measure each drug across 10 doses, while combination plates only measure drug pairs at a relative 1:1 ratio—corresponding to the diagonal of a 10 × 10 matrix. Single-agent response values are mapped onto dose-response curves and integrated with combination data to assemble the sparse matrix (Supplementary Fig. 3c, d), which effectively cuts the required number of measurements by 90%.
By dramatically decreasing the experimental resource consumption per combination, sparse mode increases throughput and efficiency. For example, the workflow supports up to 135 single agents, which yields 9045 combinations and would require just 73 plates when using six replicates of single-agent plates (Supplementary Fig. 3e, f). Consequently, sparse mode’s miniaturized design and efficient plate usage make ultra-large-scale combination screens available with minimal resources.
Machine learning augments sparse screening
To enhance the utility of our sparse screening workflow, we developed an ensemble machine learning model capable of predicting the non-measured response values within a sparse matrix, effectively filling in the gaps to reconstruct the completed matrix. We leveraged the dense mode combination data to train the model, which provided fully-measured 10 × 10 matrices alongside their corresponding single-agent responses. From this, we curated a training set comprising 552 matrices (198,720 measurements) and a test set of 184 matrices (66,240 measurements) (Fig. 3a). Each non-measured index within the sparse matrix is predicted by a dedicated regression model within the ensemble, allowing all 90 models to be finely tuned for their respective targets (Fig. 3b, see “Methods” section).

a Composition of training and test sets used to develop the ensemble model. The training set includes 552 fully-measured 10 × 10 combination matrices (light orange, 75% of total data), while the test set has 184 matrices (dark orange, 25% of total data). b Overview of the ensemble machine learning model architecture. Ninety individual models are each designed to predict the response of a single non-measured index of a sparse matrix. Fully-measured 10 × 10 matrices from the training set are downsampled to reflect the 30 measured values collected in sparse mode (treated as features) and the index a given model aims to predict (treated as the outcome variable). Each model undergoes hyperparameter tuning and is fit with the XGBoost regression model (see “Methods” section). c Model performance measured by R2 across the 10 respective folds for each of the 90 models. Box plot center line represents the median (0.947), bounds are 25th and 75th percentiles (0.934 and 0.959), and whiskers extend to the most extreme data points within 1.5× the interquartile range from the box edges. The minimum is 0.860, the maximum is 0.983. d Variable importance (VI) contributed by the 30 measured values toward the model predicting index [1,2] (represented by a yellow circle) across the test set. e Comparison of observed versus predicted cell death response values for the model predicting index [1,2] across the test set. f–i Like (d, e) showing the VI and predictive performance for models [5,6] and [9,10], respectively. j Violin plot summarizing the Euclidean distances between the target index of a model and its corresponding feature index with the maximum importance value, across all 90 models. The dashed line represents the median Euclidean distance (d = 2) across all samples, with model [4,6] highlighted as an example (red dot). k Example of the model predicting index [4,6], illustrating the Euclidean distance (d = 2) from its target index to the feature index with the maximum importance value. l Overall predictive performance of the model across all samples in the test set (n = 184). m Overview of the sparse mode workflow, integrating the experimental generation of sparse matrices with the machine learning-based imputation of non-measured response values.
Our model demonstrated a high predictive accuracy, with a median R2 of 0.945 across 10-fold cross-validation (Fig. 3c). Analyzing variable importance (VI) revealed that predictions were most strongly influenced by measured values closest to the target index. For instance, the model predicting the response at row 1, column 2 (Model[1,2]), primarily relied on data from its two nearest measured indices (Fig. 3d). Despite relying heavily on only two of the 30 measured values, this model achieved strong predictive performance (r = 0.98) between the observed and predicted values in the test set (Fig. 3e). Similar patterns were observed throughout the ensemble, with strong performance across models predicting values near the diagonal (Fig. 3f, g) and those in the lower-right quadrant of the matrix (Fig. 3h, i). A broader analysis of all models confirmed a proximity-based dependency, with most predictions relying on measured indices within a Euclidean distance of 1 or 2 from the target index (Fig. 3j, k). These findings underscore the importance of leveraging local features for predicting sparse matrix values and highlight the advantage of training dedicated models for each of the 90 non-measured indices, enabling highly targeted predictions (Supplementary Data 2).
To evaluate the ensemble’s overall performance, we compared observed and predicted cell death responses across all non-measured indices in the test set. This yielded a strong correlation (r = 0.98, Supplementary Data 3) (Fig. 3l), demonstrating the ensemble’s reliability in capturing key combination response effects. By predicting non-measured values, the ensemble model enriches the sparse screening workflow, providing detailed insights that enhance the interpretability of synergy results while preserving resource efficiency (Fig. 3m).
Applied screen of 9045 combinations
To demonstrate the scalability and practical utility of Combocat, we applied the sparse mode workflow to screen 9045 drug combinations in the neuroblastoma cell line CHP-134 (Supplementary Data 4), representing the largest dense combination screen reported in a single cell line. We used 135 small molecules, encompassing approved chemotherapeutics, investigational compounds, and neuroblastoma-selective agents nominated from our earlier CRISPR screens27. (Supplementary Data 5). Synergy was quantified for each pair by their mean Blissadj. (observed) score—the adjusted Bliss synergy averaged across the matrix diagonal (10 measured dose pairs) (Fig. 4a). Most combinations centered near zero (Fig. 4b), indicating a predominance of additive or non-synergistic interactions and aligning with prior findings that strong synergy is a rare phenomenon20,28,29.

a Heatmap of the mean adjusted Bliss synergy scores (Blissadj.) across experimentally observed 10 dose pairs for each of the 9045 tested combinations. b–e Histograms of the mean Blissadj. (observed), Moran’s I, QC flag count (observed), and mean % cell death, respectively, across the combination data. c–e highlight filters applied to exclude (gray) or include (green) combinations in the final hit list. f Filtered combinations (n = 594), ranked by their mean Blissadj. (observed) scores. The top 15 hits are labeled above. g–n Comparison of the top 2 hits from sparse mode (upper matrices) re-screened using dense mode (lower matrices). The cell death (g, h, k, l) and synergy (i, j, m, n) matrices are compared between the two modes.
To prioritize drug combinations for further exploration, we used three filtering criteria that captured spatially coherent synergy patterns (Moran’s I), data reliability (QC flag counts), and biological relevance (mean cell death response, Fig. 4c–e, see “Methods” section). After filtering, 594 top-scoring pairs remained, ranked by mean Blissadj. (observed) (Fig. 4f). To validate these sparse mode predictions, we re-screened a subset of 40 combinations in dense mode: the top 30 from sparse mode (expected to display the highest synergy) plus 10 randomly selected combinations that had been excluded. Measuring these combinations in a fully sampled 10 × 10 format enabled a direct comparison to sparse mode results.
Most top-ranked drug pairs retained strong synergy patterns, confirming that sparse mode can effectively prioritize synergistic combinations (Supplementary Fig. 4a). In contrast, the 10 random pairs exhibited weaker synergy in dense mode, matching their lower sparse mode scores. We additionally compared single-agent dose-response curves for the 47 unique drugs in the validation set and observed close alignment (rho = 0.858) of IC50 values and fitted dose-response curves (Supplementary Fig. 4b, c), reinforcing the consistency of single-agent measurements obtained in sparse mode.
Among the validated hits, the ATM inhibitor AZD1390 in combination with the PARP inhibitors Olaparib or Rucaparib stood out for their pronounced synergy (Fig. 4g, i, k, m). This aligns mechanistically with targeting complementary DNA damage repair pathways: PARP inhibition leads to accumulation of single-strand breaks, while ATM inhibition impairs the double-strand break repair response30. Re-testing these combinations in dense mode confirmed high agreement (Fig. 4h, j, l, n), meaning strong, reliable synergies could be identified from the starting set of over 9000 screened combinations. Collectively, these data establish Combocat’s sparse mode as an efficient and scalable means of uncovering synergy even in ultra-large-scale screens.
Discussion
Combocat presents a step toward more comprehensive, flexible, and scalable drug combination screening. By uniting acoustic liquid handling and machine learning-assisted inference, we have demonstrated the feasibility of screening thousands of combinations while retaining the resolution and interpretability crucial to discovering strong synergistic interactions. The principles underpinning Combocat are broadly applicable, with a design that supports compatibility with various assay readouts that align with specified volumes and plate formats—such as luminescence, absorbance (Supplementary Fig. 6), fluorescence, mass spectrometry, or high-content imaging. Furthermore, the open-source acoustic liquid handler protocols ensure adaptability to other drug dispensing platforms with comparable capabilities, establishing Combocat as a scalable foundation for diverse experimental applications.
The functionality and workflow of Combocat are designed to be straightforward, including its minimal and intuitive analytical pipeline (Supplementary Fig. 5a). This streamlined architecture, along with open-source and detailed documentation, ensures that researchers can easily implement and customize Combocat experiments according to their needs. Our goal is to pursue continual refinement and expansion of the platform. One of the most compelling aspects of Combocat lies in its potential for community-driven advancement. As more research groups generate dense combination data, these datasets can be anonymized and contributed back to the community for re-training and improving the ensemble machine learning model (Supplementary Fig. 5b). This communal effort could result in a dynamic resource capable of delivering progressively more accurate synergy estimates with minimal experimental overhead.
While Combocat enables high-throughput combination screening in various contexts, some limitations are important to acknowledge. First, the accuracy of sparse mode inference is inherently dependent on the quality and diversity of the training data. We tested three progressively stringent stratifications of our dense mode dataset (Supplementary Fig. 7a–c) and found essentially identical predictive performance (r≈0.97, Supplementary Fig. 7d–f), demonstrating no simple data leakage in predicting responses in Neuroblastoma. However, as new data are collaboratively added, preventing leakage through continuous hold-out testing will be essential to maintain the model’s robustness and generalizability. Second, although dense and sparse modes’ experimental measurements largely agree, they will differ in some circumstances. Sparse mode uses miniaturized volumes and a different plate format, which can occasionally introduce shifts in drug potency or dynamic range. This can be related to technical factors like compound dispersion in smaller volumes, plate layout effects, or variations in cell confluence in smaller wells. Finally, while Combocat supports Bliss and Loewe synergy metrics, each carries assumptions and limitations. For example, Bliss can misestimate synergy for drugs targeting similar pathways, and Loewe cannot calculate synergy in the absence of dose-equivalence (Supplementary Fig. 8a, b)—making it undefined in 61.5% of sparse mode dose combinations tested (Supplementary Fig. 8c). We compared the mean synergy scores in our combinations passing QC and filtering steps (n = 800) and observed a modest agreement between the Bliss and Loewe models (Spearman rho = −0.672, p < 2.2e-16, Supplementary Fig. 8d). Importantly, additional reference models exist such as Highest Single Agent (HSA)31, Zero Interaction Potency (ZIP)32(which models changes in potency of the dose-response curves), and others, which can be evaluated in future extensions of the platform.
We envision leveraging Combocat’s scalability to investigate more of the vast unexplored drug combination space, mapping out the synergy landscapes of thousands of drug combinations across many cell lines (Supplementary Fig. 5c). By integrating sparse mode workflows with continuously evolving machine learning models, rich synergy datasets can be generated, capable of capturing complex biological responses. Such comprehensive synergy maps will empower researchers to identify conserved interactions, reveal lineage-specific vulnerabilities, and guide the rational selection of combination therapies.
Methods
Ethics statement
This study complied with all relevant ethical regulations.
Cell culture
The CHP-134 cell line was purchased from Sigma (catalog #6122002) and maintained in RPMI 1640 medium (Corning, catalog #10-041-CM) supplemented with 10% FBS (Corning, catalog #35-015-CV) at 37 °C with 5% CO2. Mycoplasma was routinely tested using the MycoAlert mycoplasma detection kit (Lonza, catalog # LT07-118), and the cells were verified negative for contamination.
For experiments with bacterial cultures, the Escherichia coli BW25113 strain (Horizon Discovery Ltd.) was cultured at 37 °C in Mueller-Hinton (MH) agar or broth (BBL). Cultures in exponential phase (OD600 0.4–0.6) were diluted to OD600 of 0.0005 for plating in 384-well format.
Compounds
Compounds were sourced from commercial vendors (see Supplementary Data 5). Stocks were solubilized in DMSO and stored at −80 °C until 24 h before use, at which point they were thawed at room temperature and centrifuged at 1100 RPM for 5 min. Across all assays, compounds were screened at 10 concentrations using 3-fold serial dilutions, typically with an upper limit of 25 µM. Most compounds were screened below and above their physiologically-relevant doses, and in a way positioning their suspected IC50s as the midpoint to attempt achieving a complete dose-response effect.
The choice of 135 compounds used in sparse mode comes from drugs targeting the top neuroblastoma-selective sensitizers from earlier CRISPR-anchor screens27. Specifically, drugs were chosen using the following approach:
-
1.
Our previous CRISPR knockout-anchor screens investigated 18 cell lines using 7 neuroblastoma standard-of-care drugs and 1 investigational compound (Doxorubicin, Etoposide, Retinoic Acid, Topotecan, Vincristine, Cisplatin, Phosphoramide Mustard, and JQAD1). The CRISPR knockout library was designed to target 655 known druggable genes. These screens were designed to identify druggable gene knockouts that sensitize cancer cells to standard-of-care neuroblastoma drugs.
-
2.
To identify these high-potential drug-sensitizing gene knockouts from the resulting dataset, we applied a custom Bayesian hierarchical model (described in the “Methods” section of Lee and Wright et al.) to nominate genes with differential sensitization effects in the Neuroblastoma group, relative to the outgroup cell.
-
3.
We then compiled the list of drugs that targeted the resulting neuroblastoma-selective sensitizing gene knockouts. For genes targetable by >1 drug, the list was reduced manually, considering factors such as clinical approval, redundancy with other drugs, number of analogs, and compound availability.
-
4.
Finally, we manually added high-priority investigational compounds to the list after consultation with multiple pediatric oncologists at St. Jude, yielding the final number of 135 unique drugs. The list of drugs is available in Supplementary Data 5.
Drug template designs
Dense mode template
To enable comprehensive and reproducible measurement of pairwise dose combinations in a 10 × 10 matrix format, we designed a 384-well plate template that accommodates three replicate 10 × 10 combination matrices in a 384-well plate format, along with three replicates of the dose-response curves for each single-agent and twelve replicates of each positive and negative control (Fig. 1c). In each well, 200 nL of total compound was transferred via an Echo 655 acoustic liquid handler (Beckman Coulter): 100 nL of compound + 100 nL of DMSO for single-agent wells, or 100 nL of each compound for combination wells. This was followed by 40 μL of cells, added using a Multidrop combi (Thermo Fisher). Maintaining a 40 μL volume of cells minimized edge effects arising from evaporation. Each dense mode plate tested exactly one drug combination, making the total plate count for a dense mode experiment scale linearly with the number of drug pairs.
Sparse mode template
Sparse mode was designed to increase throughput and reduce resource usage by miniaturizing the assay into a 1536-well plate format (Supplementary Fig. 3a, b). Three key features enable ultra-large combination screens in sparse mode:
-
1.
Miniaturized volumes: Only 20 nL of compound is transferred (10 nL of each drug for combinations or 10 nL of drug + 10 nL of DMSO for single-agent wells), followed by 4 μL of cells. Edge wells are filled with culture medium to mitigate evaporation. Doses are interleaved to minimize well-to-well signal contamination.
-
2.
Measurement of the diagonal only: Each 10 × 10 matrix is represented by 10 dose pairs that combine each drug at a relative 1:1 ratio. For example, the 6th-highest tested dose of Drug 1 with the 6th-highest tested dose of Drug 2. This reduces the total measured dose pairs by 90%, compared to a fully-measured 10 × 10 matrix (Supplementary Fig. 3d).
-
3.
Separate single-agent and combination plates: Single-agent and combination plates are tested separately, with single-agents testing each drug’s 10-dose series, and combinations testing only the diagonal dose pairs. This allows single agents to be mapped onto combination matrices without being re-measured. For example, to screen the combinations A_B and A_C, dense mode would measure A twice, whereas sparse mode would measure A once. Within-plate controls facilitate normalization before integration into assembled matrices.
The total number of plates required for a sparse mode screen can be calculated as:
where c is the total number of cell lines, r is the total number of single-agent plate replicates, and n is the number of unique drugs. The 135 value comes directly from the number of unique drugs able to fit within the usable (non-edge) wells of the 1536-well plates.
Drug combination screens
For both dense and sparse modes, compounds were transferred into empty 384- or 1536-well plates (Corning) using the Echo 655 acoustic liquid handler with Combocat protocol files (available at combocat.stjude.org). After compound transfer, cells were dispensed at seeding densities of 1000 cells/well in 384-well plates or 200 cells/well in 1536-well plates. For E. coli cells (which were only screened in 384-well plates), an OD600 of 0.0005 was used. In 1536-well plates, cells were strained through a 70 µM cell strainer before being dispensed. The final DMSO concentration after cell addition was 0.5% in all wells.
Plates were incubated at 37 °C for 72 h. Cell viability was assessed after the 3-day treatment using CellTiter-Glo (or BacTiter-Glo for bacterial cells) by adding either 25 µL (to 384-well plates) or 2 µL (to 1536-well plates) of prepared reagent and reading luminescence on an EnVision plate reader (PerkinElmer). For the absorbance-based readout of cell viability, 8 µL of MTS reagent (Abcam) at 0.5× concentration was added to the cells at the endpoint time. The MTS reagent was incubated with cells for 3 h, and plates were read at 490 nanometers on a Cytation 5 plate reader (BioTek).
The quality of all screened assay plates was assessed using the Z′ metric33, which measures quality as a function of signal window and data variation, given by:
where σNeg/Pos and μNeg/Pos represent the standard deviation and means of the controls, respectively. A Z′ value of ≥0.5 is generally regarded as an excellent separation of controls.
Development of an ensemble machine learning model
The Combocat ensemble machine learning model was developed as a collection of 90 individual models, each built to predict one of the 90 non-measured indices of a sparse matrix. To construct these models, an input dataset was first assembled containing all fully-measured data collected via dense mode, totaling over 800 combination matrices and their single-agent response values (Supplementary Data 1). The input dataset was first filtered to remove any matrices with a mean cell death value < 10%. Next, this dataset was split into 75% for training and 25% for the test set, respectively. This resulted in a training set of 552 matrices (198,720 measurements) and a test set of 184 matrices (66,240 measurements). Note that while the combination matrix itself has dimensions of 10 × 10, including the single-agent data effectively extends this into an 11 × 11 grid, where the 1st column and 11th row represent the single-agent responses (Supplementary Fig. 9a). This format was used for associating a model with its respective index. Each model was trained on 30 features: response values from 10 single-agent indices each from Drug 1 and Drug 2, and 10 indices corresponding to the matrix diagonal, which represent each drug’s concentration combined at a relative 1:1 ratio (Supplementary Fig. 9b). These 30 features correspond to the 30 indices measured experimentally in the sparse mode workflow (Supplementary Fig. 3d) and were used across the input data to generate the models predicting the 90 total indices of a sparse matrix (Supplementary Fig. 9c).
The training of each model involved fitting the tree-based regression model XGBoost34. Hyperparameter tuning was enabled to optimize model performance, which was accomplished using a space-filling grid design to efficiently test 40 combinations of the hyperparameters (detailed in Supplementary Data 6). A 10-fold cross-validation was used to select the optimal set of hyperparameters based on the lowest R2 value. Once identified, each model was trained using its respective optimal hyperparameters on the entire training set. The performance of each model was evaluated across all folds, gauged by R2 and RMSE. For each model, the variable importance was measured across each of the 30 features (30 measured response values from sparse matrices) to evaluate their predictive impact (Supplementary Data 7). Next, the trained models were validated on their test sets to ensure their predictive capability by comparing the observed vs. predicted cell death response values. The comparison of observed vs. predicted response values across the 90 models collectively was used to summarize the predictive performance of the ensemble model. Finally, the ensemble model was serialized in a format that allows for rapid deployment for future sparse matrix predictions. All model generation was performed using the tidymodels framework (tidymodels.org).
Quality control for handling spurious measurements
To ensure data integrity and mitigate the impact of spurious measurements, we implemented a rigorous quality control (QC) procedure focusing on three key metrics: single-agent standard deviation, residuals from single-agent dose-response curves, and monotonicity of the cell death response.
For each single-agent drug, we first calculated the standard deviation of the percentage cell death (% cell death) values across all replicates at each dose level, resulting in ten standard deviation values per agent corresponding to the ten doses tested. Any dose with a percentage cell death standard deviation exceeding a predefined threshold (Tdefault) of 29 was flagged for disqualification. All combination data points involving that particular dose were also flagged for disqualification (Supplementary Fig. 2e). Next, we fitted a four-parameter log-logistic model to the dose-response data for each single-agent drug. For each dose, we calculated the residual – the difference between the observed percentage cell death and the value predicted by the fitted curve. Doses with residuals whose absolute value exceeded the Tdefault threshold of 15% were disqualified (Supplementary Fig. 2f). Finally, we assessed the monotonicity of the cell death response, under the assumption that percentage cell death should increase monotonically with increasing drug concentration. We evaluated the differences in cell death between the consecutive doses. If the cell death response decreased from one dose to the next by more than the Tdefault threshold of 16% (i.e., a decrease greater than 16%), the corresponding dose was disqualified (Supplementary Fig. 2g). For sparse mode data, we additionally evaluated the monotonicity of the observed combination responses along the diagonal of the 10 × 10 matrix – the ten observed combination values corresponding to increasing dose pairs combined at relative 1:1 ratios. If any of these combination responses decreased by more than 16% compared to the previous dose pair, that specific combination value was disqualified (Supplementary Fig. 2h). After assessing a combination matrix using all three QC metrics, the flagged values were tracked and could be excluded from summary statistics if desired. For example, a combination matrix could be summarized by its mean Bliss synergy score (which averages over all 100 Bliss synergy values of the 10 × 10 matrix), or by its “adjusted” Bliss synergy score (which only averages over the non-disqualified Bliss synergy values).
Applied screen of 9045 combinations
A pairwise combination screen of 135 drugs was performed in the CHP-134 cells. Each single-agent plate was replicated six times. Drug combinations were prioritized for further exploration by first applying a series of filtering criteria:
-
1.
Moran’s I, a measure of spatial autocorrelation35, was used to assess the distribution of synergy across each 10 × 10 combination matrix. Moran’s I quantifies the degree to which similar scores cluster together in space and was applied to all synergy matrices (Supplementary fig. 10). A high Moran’s I indicates that similar synergy scores are similarly clustered, forming cohesive patterns, whereas low values suggest a random distribution with no discernible pattern. We reasoned that synergy matrices exhibited such localized motifs likely reflect coherent biological effects, while sporadic patterns are more likely to signify noise or spurious results. All matrices with a Moran’s I value of <0.6 were filtered out to retain only those with strong patterns of spatial autocorrelation.
-
2.
All combination matrices were subjected to a filter based on the quality of the measured values. The ten measured values, corresponding to the diagonal of the 10 × 10 matrix, were subjected to our QC pipeline. If more than six of these ten measured values were flagged by the QC pipeline as unreliable, the matrices were excluded.
-
3.
The mean percentage cell death was also used as a filter for the screening data. For all 100 dose pairs per combination, the mean was calculated, and only matrices with ≥20% cell death were retained for further analysis. This ensured that the high-ranking synergy was also meaningful in terms of inducing cell death.
Once the screening data were filtered, combinations were ranked by their mean Blissadj. (observed) values. This metric is simply the mean of the 10 measured values per combination after they were subjected to QC (Fig. 4a).
Reporting summary
Further information on research design is available in the Nature Portfolio Reporting Summary linked to this article.
Data availability
All data generated and analyzed in this study, including the dense mode reference dataset, model performance metrics, and sparse screening results, are available in the Supplementary Data. The deployable machine learning model file, protocols for the Echo acoustic liquid handler, along with comprehensive documentation for how to run Combocat screens, are freely available at https://www.combocat.stjude.org.
Code availability
The source code for all computational workflows, including the machine learning ensemble model and the Combocat R package, is open-source and freely available on GitHub at github.com/wcwr/combocat. The code is open-source under the Apache 2.0 license.
References
Chabner, B. A. & Roberts, T. G. Chemotherapy and the war on cancer. Nat. Rev. Cancer 5, 65–72 (2005).
Oversteegen, L., Shah, M. & Rovini, H. HIV combination products. Nat. Rev. Drug Discov. 6, 951–952 (2007).
Cook, M. A. & Wright, G. D. The past, present, and future of antibiotics. Sci. Transl. Med. 14, eabo7793 (2022).
Al-Lazikani, B., Banerji, U. & Workman, P. Combinatorial drug therapy for cancer in the post-genomic era. Nat. Biotechnol. 30, 679–692 (2012).
Lopez, J. S. & Banerji, U. Combine and conquer: challenges for targeted therapy combinations in early phase trials. Nat. Rev. Clin. Oncol. 14, 57–66 (2017).
Devita, V. T., Young, R. C. & Canellos, G. P. Combination versus single agent chemotherapy: a review of the basis for selection of drug treatment of cancer. Cancer 35, 98–110 (1975).
Crunkhorn, S. Combination therapy combats MRSA. Nat. Rev. Drug Discov. 15, 308–309 (2016).
Lucas, G. M., Chaisson, R. E. & Moore, R. D. Highly active antiretroviral therapy in a large urban clinic: risk factors for virologic failure and adverse drug reactions. Ann. Intern. Med. 131, 81 (1999).
Cacace, E. et al. Systematic analysis of drug combinations against Gram-positive bacteria. Nat. Microbiol. 8, 2196–2212 (2023).
Dancey, J. E. & Chen, H. X. Strategies for optimizing combinations of molecularly targeted anticancer agents. Nat. Rev. Drug Discov. 5, 649–659 (2006).
Wheler, J., Lee, J. J. & Kurzrock, R. Unique molecular landscapes in cancer: implications for individualized, curated drug combinations. Cancer Res. 74, 7181–7184 (2014).
Bliss, C. I. The toxicity of poisons applied jointly. Ann. Appl. Biol. 26, 585–615 (1939).
Delves, M. J. et al. A high throughput screen for next-generation leads targeting malaria parasite transmission. Nat. Commun. 9, 3805 (2018).
Jin, Z. et al. Structure of Mpro from SARS-CoV-2 and discovery of its inhibitors. Nature 582, 289–293 (2020).
Clare, R. H. et al. Industrial scale high-throughput screening delivers multiple fast acting macrofilaricides. Nat. Commun. 10, 11 (2019).
Rønneberg, L., Kirk, P. D. W. & Zucknick, M. Dose–response prediction for in-vitro drug combination datasets: a probabilistic approach. BMC Bioinform. 24, 161 (2023).
Holbeck, S. L. et al. The National Cancer Institute ALMANAC: a comprehensive screening resource for the detection of anticancer drug pairs with enhanced therapeutic activity. Cancer Res. 77, 3564–3576 (2017).
Ianevski, A. et al. Prediction of drug combination effects with a minimal set of experiments. Nat. Mach. Intell. 1, 568–577 (2019).
Jaaks, P. et al. Effective drug combinations in breast, colon and pancreatic cancer cells. Nature 603, 166 (2022).
Vis, D. J. et al. A pan-cancer screen identifies drug combination benefit in cancer cell lines at the individual and population level. Cell Rep. Med. 5, 101687 (2024).
Liu, Q. & Xie, L. TranSynergy: mechanism-driven interpretable deep neural network for the synergistic prediction and pathway deconvolution of drug combinations. PLoS Comput. Biol. 17, e1008653 (2021).
Ianevski, A., Timonen, S., Kononov, A., Aittokallio, T. & Giri, A. K. SynToxProfiler: an interactive analysis of drug combination synergy, toxicity and efficacy. PLoS Comput. Biol. 16, e1007604 (2020).
Julkunen, H. et al. Leveraging multi-way interactions for systematic prediction of pre-clinical drug combination effects. Nat. Commun. 11, 6136 (2020).
Dragiev, P., Nadon, R. & Makarenkov, V. Systematic error detection in experimental high-throughput screening. BMC Bioinform. 12, 25 (2011).
Cockerill, F. R. & Edson, R. S. Trimethoprim-sulfamethoxazole. Mayo Clin. Proc. 66, 1260–1269 (1991).
Pan, M. et al. The chemotherapeutic CX-5461 primarily targets TOP2B and exhibits selective activity in high-risk neuroblastoma. Nat. Commun. 12, 6468 (2021).
Lee, H.-M. et al. A CRISPR-drug perturbational map for identifying compounds to combine with commonly used chemotherapeutics. Nat. Commun. 14, 7332 (2023).
Jaaks, P. et al. Effective drug combinations in breast, colon and pancreatic cancer cells. Nature 603, 166–173 (2022).
Nair, N. U. et al. A landscape of response to drug combinations in non-small cell lung cancer. Nat. Commun. 14, 3830 (2023).
Lloyd, R. L. et al. Combined PARP and ATR inhibition potentiates genome instability and cell death in ATM-deficient cancer cells. Oncogene 39, 4869–4883 (2020).
Berenbaum, M. C. What is synergy?. Pharmacol. Rev. 41, 93–141 (1989).
Yadav, B., Wennerberg, K., Aittokallio, T. & Tang, J. Searching for drug synergy in complex dose-response landscapes using an interaction potency model. Comput. Struct. Biotechnol. J. 13, 504–513 (2015).
Zhang, J.-H., Chung, T. D. Y. & Oldenburg, K. R. A simple statistical parameter for use in evaluation and validation of high throughput screening assays. SLAS Discov. 4, 67–73 (1999).
Chen, T. & Guestrin, C. XGBoost: a scalable tree boosting system. Preprint at https://doi.org/10.48550/ARXIV.1603.02754 (2016).
Moran, P. A. P. Notes on continuous stochastic phenomena. Biometrika 37, 17 (1950).
Acknowledgements
P.G. is supported by an NIGMS R35 award [R35GM138293], an R01 grant from NCI [R01CA260060]; K99/R00 [R00HG009679] from NHGRI; P.G. also receives support from ALSAC. The St. Jude Center for Advanced Genome Engineering receives support from NCI [P30CA021765]. We thank the high-throughput biosciences (HTB) core facility within the Department of Chemical Biology and Therapeutics at St. Jude Children’s Research Hospital for providing support with high-throughput screening.
Author information
Authors and Affiliations
Contributions
W.C.W. and P.G. conceived the study. W.C.W., M.P., G.A.P., J.L., and D.C. designed the experiments. W.C.W., M.P., G.A.P., J.L., D.C., A.S., and M.T. performed the experiments. W.C.W. performed the analysis. W.C.W. and P.G. wrote the manuscript. M.P., G.A.P., J.L., D.C., A.S., M.T., J.H., R.H.C., X.L., D.B., Y.Z., R.E.L., and T.C. provided additional insights, reviewed and edited the manuscript, and supervised various parts of the study.
Corresponding authors
Ethics declarations
Competing interests
The authors declare no competing interests.
Peer review
Peer review information
Nature Communications thanks Francesco Raimondi, who co-reviewed with Martina Varisco; Sven Nelander, and the other anonymous reviewer for their contribution to the peer review of this work. A peer review file is available.
Additional information
Publisher’s note Springer Nature remains neutral with regard to jurisdictional claims in published maps and institutional affiliations.
Supplementary information
Rights and permissions
Open Access This article is licensed under a Creative Commons Attribution-NonCommercial-NoDerivatives 4.0 International License, which permits any non-commercial use, sharing, distribution and reproduction in any medium or format, as long as you give appropriate credit to the original author(s) and the source, provide a link to the Creative Commons licence, and indicate if you modified the licensed material. You do not have permission under this licence to share adapted material derived from this article or parts of it. The images or other third party material in this article are included in the article’s Creative Commons licence, unless indicated otherwise in a credit line to the material. If material is not included in the article’s Creative Commons licence and your intended use is not permitted by statutory regulation or exceeds the permitted use, you will need to obtain permission directly from the copyright holder. To view a copy of this licence, visit http://creativecommons.org/licenses/by-nc-nd/4.0/.
About this article

Cite this article
Wright, W.C., Pan, M., Phelps, G.A. et al. An open-source screening platform accelerates discovery of drug combinations. Nat Commun 16, 11005 (2025). https://doi.org/10.1038/s41467-025-66223-8
Received:
Accepted:
Published:
Version of record:
DOI: https://doi.org/10.1038/s41467-025-66223-8
