
Abstract
Humoral immune-related adverse events, including hypogammaglobulinemia and B cell depletion, pose long-term infection risks after chimeric antigen receptor T cell therapy (CARTx) for hematologic malignancies. This prospective study evaluates the kinetics of pathogen-specific humoral immunity prior to and up to a year after CARTx targeting CD19 and CD20 (B cells) or BCMA (plasma cells) in 100 and 28 individuals, respectively. Antibodies are tested for 12 vaccine-preventable pathogens and using comprehensive high-throughput antibody profiling. A subset of 72 participants are evaluated for post-CARTx vaccine responses. Here, we show pathogen-specific humoral immunity does not significantly change after CD19-, CD20-, or BCMA-targeted CAR-T cell therapy (CARTx). However, seroprotective antibodies are absent for up to one-third of routine vaccine-preventable pathogens in CD19- and CD20-CARTx recipients and for nearly half of vaccine-preventable pathogens in BCMA-CARTx recipients by one-year post-CARTx. Pre-vaccination B cell count is the main predictor of vaccine response.
Introduction
The development of chimeric antigen receptor T cell therapy (CARTx) for B cell and plasma cell malignancies is a major milestone in cancer immunotherapy with high rates of complete remission1,2. Five products targeting CD19 are approved to treat children and/or adults with refractory or relapsed acute lymphoblastic leukemia (ALL), non-Hodgkin lymphoma (NHL), and chronic lymphocytic leukemia (CLL)3,4, and two products targeting B cell maturation antigen (BCMA) are approved for adults with multiple myeloma (MM)5,6. These products are also being studied as potentially transformational therapies for autoimmune diseases7,8. Thus, the uses for CARTx are rapidly increasing.
Although cytokine release syndrome (CRS) and immune effector cell-associated neurotoxicity syndrome (ICANS) are the earliest and most serious immune-related adverse events (irAEs) after CARTx, severe manifestations affect a minority of patients, are typically transient, and can usually be effectively managed9. In contrast, on-target, off-tumor depletion of non-malignant B lineage cells affects the majority of B lineage targeted CARTx recipients and is a principal irAE of CARTx10,11. These humoral irAEs, along with immune effector cell-associated hematotoxicity (ICAHT), can persist for years and result in increased risk for infections; indeed, infections are the most common cause of non-relapse mortality after CARTx9,10,11,12,13,14,15,16.
The long-term effects of CARTx on pre-existing pathogen-specific immunity are poorly understood. CD19 expression is found on early and mature B cell lineages but declines as B cells differentiate into plasma cells17. Plasma cells can live for decades18 and are the primary long-lived source of antibodies to previously encountered pathogens17,19,20,21,22,23. Small studies have suggested that pre-existing pathogen-specific IgG may persist despite depletion of CD19+ B cells after CD19-CARTx or treatment with rituximab (anti-CD20) due to preservation of fully differentiated CD19− plasma cells24,25,26,27,28. In contrast, BCMA is expressed by long-lived plasma cells29,30, and depletion of non-malignant BCMA+ plasma cells after BCMA-CARTx may result in loss of pre-existing pathogen-specific IgG but preserve the naïve and memory B cell compartments necessary for vaccine response31. Additionally, pathogen-specific B or T cells may recover after CAR-T cell therapy, which may also impact antibody titers26,32,33. To date, the published literature on the effects of CARTx on pre-existing pathogen-specific immunity is limited and inconclusive, particularly for BCMA-CARTx.
In light of these uncertainties, patients often receive prophylactic immunoglobulin replacement therapy (IGRT) to address hypogammaglobulinemia, although this blood product is expensive, has frequent side effects, can reduce vaccine efficacy, and is of unclear benefit in this population34,35,36. Alternatively, vaccination after CARTx may be a durable and cost-effective tool to mitigate irAEs, as approximately one third of infections may be from vaccine-preventable infections37. Vaccine responses after CD19-CARTx are biologically plausible given observations that patients can respond to vaccines ≥6 months after rituximab, even in the absence of measurable peripheral blood B cells38,39,40. Similar observations have been made for CARTx recipients receiving SARS-CoV-2 and influenza vaccines26,33,41. Additionally, CD19-CARTx recipients can recover polyclonal CD19+ B cells without relapse, typically ≥6 months after therapy42, although persistent B cell aplasia is common1. While responses to SARS-CoV-2 vaccination have been well studied after CARTx43,44,45, data on response to other routine vaccines in CARTx recipients are very limited41,46,47. Improved understanding of the need and strategies for vaccinating CARTx recipients is critical, given pre-existing and emergent gaps in humoral immunity related to their treatment.
We hypothesized that CD19 or CD20-CARTx targeting B cells (hereafter referred to as CD19/20-CARTx) would not impact pre-existing pathogen-specific antibody levels, but these individuals would have poor vaccine responses. Conversely, we hypothesized that BCMA-CARTx targeting plasma cells would result in loss of pathogen-specific antibody levels but have less impact on vaccine responses. Here, we report the results of a prospective observational study evaluating the impact of CD19/20 and BCMA-targeted CARTx on multiple metrics of humoral and pathogen-specific immunity, as well as the ability of routine vaccines to improve pathogen-specific immunity in CARTx recipients.
Results
Participant characteristics
We prospectively enrolled 279 individuals who were planning to receive CARTx for a B cell or plasma cell malignancy from 2019 to 2023 at Fred Hutchinson Cancer Center (Fred Hutch) and Seattle Children’s Hospital (SCH). We collected blood pre-CARTx (pre-lymphodepleting chemotherapy) and at approximately 6 months and/or 1 year in 128 participants who remained in remission without additional anti-tumor therapy and who had not received IGRT in the preceding 8 weeks (Fig. 1; Supplementary Table 1). One hundred participants received CD19/CD20-CARTx and 28 received BCMA-CARTx. Demographic and clinical characteristics are detailed in Table 1. The median age was 62 years (range, 18–83 years). The BCMA cohort was more heavily pre-treated with a median of 8 (range, 1–14) prior cancer therapies compared to a median of 4 (range, 1–9) in the CD19/20 cohort. Forty-four participants (34%) received a hematopoietic cell transplant (HCT) before CARTx, with a higher proportion in the BCMA-CARTx cohort (75%) compared to the CD19/20-CARTx cohort (23%). CARTx indications in the CD19/20 cohort included B cell NHL, ALL, and CLL; the BCMA cohort was treated for MM.
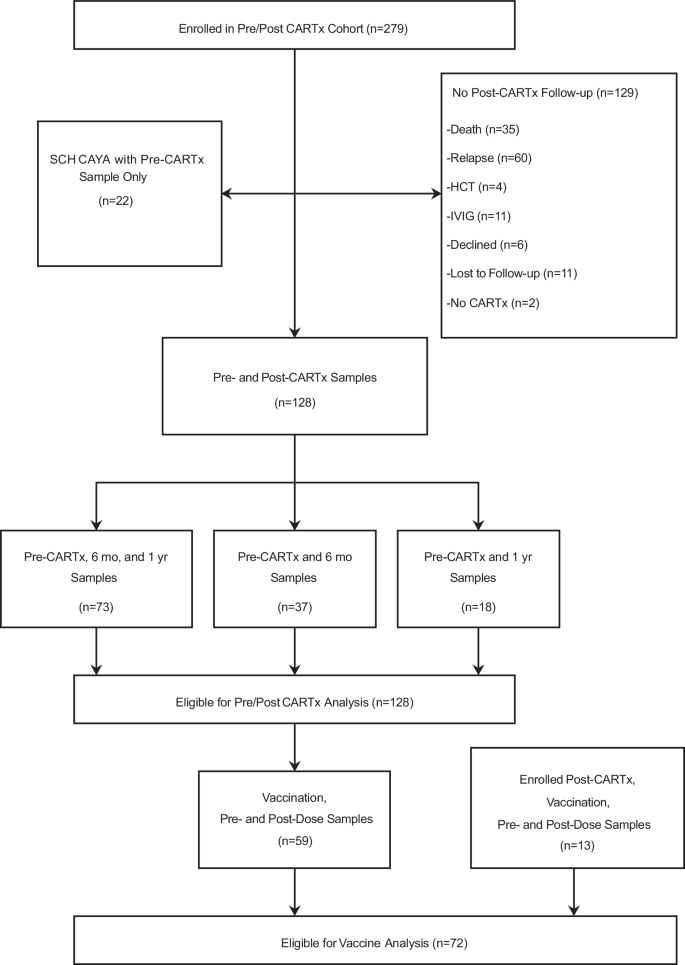
CARTx CAR-T cell therapy, SCH Seattle Children’s Hospital, HCT hematopoietic cell transplant, IVIG intravenous immunoglobulin G, CAYA children, adolescents, and young adults, mo months, yr year. Source data are provided as a Source data file.
To evaluate pre-CARTx pathogen-specific antibody titers in children, adolescents, and young adults (CAYA) treated with B-cell-targeted CARTx for ALL who were underrepresented in the longitudinal cohort due to frequent use of IGRT and additional anti-tumor therapies, we included baseline samples from 22 participants treated at SCH who did not have subsequent samples meeting inclusion criteria (Supplementary Table 2). Thirteen individuals in this subgroup received CD19-CARTx, two received CD22-CARTx, and six received CD19/22 dual-targeting therapy.
CAR-T cell persistence
We measured CAR-T cell persistence at approximately 6 months (n = 30, CD19/20; n = 9, BCMA) and 1 year (n = 23, CD19/20; n = 8, BCMA) in a subset of participants for whom a PCR assay targeting their CAR-T cell product was available. For both CD19- and BCMA-CARTx recipients with ongoing cancer remission, most participants had detectable CAR-T cells through 1 year (Supplementary Fig. 1a, b). Thus, our results are interpreted in the context of ongoing CAR-T cell-mediated B cell and plasma cell depletion as further demonstrated below.
Kinetics of immunoglobulins, B cell subsets, and T cell subsets before and after CARTx
We evaluated changes in total IgA, IgM, and IgG subsets, as well as T and B cell subsets, stratified by receipt of CD19/CD20 or BCMA-CARTx (Fig. 2a–i). Baseline immunoglobulin levels were below the lower limit of normal for most participants in both groups. Baseline IgA and IgM (Fig. 2a, b) titers were significantly lower in participants receiving BCMA- compared to CD19/20-CARTx, whereas IgG levels were similar (Fig. 2c). IgA levels significantly decreased at 6 months after CARTx in both groups, with modest recovery by 1 year that was no longer significantly different between CARTx targets but remained below pre-CARTx levels (Supplementary Fig. 2a–c). IgM levels modestly increased after BCMA-CARTx compared to a small but significant reduction after CD19/20-CARTx that remained persistently lower at 1 year compared to baseline. IgG levels remained similar when comparing between groups at each time point, but IgG levels significantly decreased after CD19/20-CARTx.

Distribution of a IgA, b IgM, c IgG, d–g B cell and h, i T cell subsets, with counts expressed as log10(value + 1), by time points relative to CARTx and by participant groups defined by CARTx target received (BCMA data are in orange, CD19/20 data are in blue). Dashed horizontal reference lines represent the upper and lower limits of normal for IgA, IgM, and IgG, 20 cells/µL for CD19+ B cell count, and 200 cells/µL for CD4+ T cell count. Naïve B cells were defined as CD27–IgD+. Boxes represent interquartile range, horizontal lines within boxes represent the median, and whiskers extend to minimum and maximum values. Numbers above the x-axis show the number of participants in each group. Brackets above boxplots show statistical significance for group comparisons at each time point from generalized estimating equation models with independent variables for group, time point, and their interaction; tests of coefficients from these models were two-sided with no adjustments for other variables or for multiple comparisons. *** indicates p < 0.001, ** indicates 0.001 ≤ p < 0.01, * indicates 0.01 ≤ p < 0.05, and NS indicates not significant with p ≥ 0.05. Precise p values for comparisons between BCMA- and CD19/20-CARTx groups at pre-CARTx, 6 mo post-CARTx, and 1 yr post-CARTx were 0.05, <0.001, 0.06 for IgA; <0.001, 0.26, 0.58 for IgM; 0.10, 0.87, 0.61 for IgG; 0.46, <0.001, <0.001 for CD19+ B cell count; 0.02, <0.001, <0.001 for naïve CD19+ B cell count. Model estimates for these and additional comparisons are shown in Supplementary Fig. 2a–c and Supplementary Fig. 3a, b. Among 26 BCMA-CARTx participants with available data, j the percentage of CD138+ plasma cells in bone marrow is shown, with each line representing a participant, measured via immunohistochemistry staining. CARTx CAR-T cell therapy, mo months, yr year. Source data are provided as a Source data file.
CD19+ B cell counts had distinct kinetics in BCMA- and CD19/20-CARTx recipients (Fig. 2d–g; Supplementary Fig. 3a, b; Supplementary Table 3). Both groups had similarly low CD19+ B cell counts prior to CARTx. In BCMA-CARTx recipients, there was a significant increase in CD19+ B cell counts over time post-CARTx, with the majority of recipients achieving a B cell count ≥20 cells/µL by 6 months (70%) and 1 year (82%). In contrast, CD19/20-CARTx recipients had a significant decrease in CD19+ B cell count after CARTx, with a minority having a CD19+ B cell count ≥20 cells/µL at 6 months (17%) but recovery to pre-CARTx levels at 1 year (39%). Naïve B cells (CD19+CD27–IgD+) had a similar pattern. Memory B cells (unswitched, CD19+CD27–IgMhiIgDlo and class switched, CD19+CD27+IgD–) were low pre-CARTx in both groups, with further decline after CD19/20-CARTx, but some recovery after BCMA-CARTx. Bone marrow CD138+ plasma cells in BCMA-CARTx recipients showed sharp declines after treatment (Fig. 2j). Overall, these patterns are congruent with the expected effects of CARTx by target and are consistent with the findings of CAR-T cell persistence. Finally, CD4+ and CD8+ T cell counts were similar and stable by CARTx target and time point (Fig. 2h, i).
Kinetics of pathogen-specific antibody titers before and after CARTx
We tested serum for IgG to 12 vaccine-preventable pathogens at each time point. First, we compared baseline antibody titers among 100 adults and 22 CAYA prior to CD19, CD20, CD22, or CD19/22-targeted CARTx. We observed that the youngest individuals (0–8 years old) had lower antibody titers and frequency of seroprotection for many pathogens compared to older individuals, although with some differences, such as higher antibodies for hepatitis viruses compared to adults (Supplementary Fig. 4a–l; Supplementary Fig. 5a–l). Compared to population-based seroprevalence studies26,48,49,50,51, BCMA-CARTx recipients had a lower prevalence of pre-CARTx seroprotection, while CD19/20-CARTx recipients had a similar prevalence of seroprotection for most pathogens (Supplementary Fig. 6).
Next, we evaluated changes in pathogen-specific antibody titers over time in the CARTx cohort with a pre-CARTx sample (n = 128; median days before CARTx, 7 days; interquartile range [IQR], 5–12) and at least one post-CARTx sample at approximately 6 months (n = 110; median days after CARTx, 193 days; IQR, 175–217) and/or 1 year (n = 91; median, 376 days; IQR, 354–407) after CARTx (Fig. 3a–l; Supplementary Table 4). At baseline, BCMA-CARTx recipients had significantly lower pathogen-specific antibody titers for most pathogens compared to CD19/20-CARTx. BCMA-CARTx recipients showed a general pattern of increases in antibody titers by 1-year post-CARTx for several pathogens, which was contrary to our original hypothesis. After CD19/20-CARTx, pathogen-specific IgG levels were stable over time, consistent with our hypothesis. However, pathogen-specific antibody titers at 1 year remained lower for most pathogens in the BCMA-CARTx cohort compared to the CD19/20-CARTx cohort. Similar patterns were observed when comparing the proportion of participants with antibody titers considered to be seroprotective (Supplementary Fig. 7a–l; Supplementary Table 5). Seroprotection to pathogens corresponding to live-attenuated vaccines was particularly low in BCMA-CARTx recipients (Supplementary Fig. 8a, b).

These plots (a–l) show pathogen-specific IgG titers, expressed as log10(value + 1), by time points relative to CARTx (Pre-CARTx, 6 months post-CARTx, and 1 year post-CARTx) and by CARTx target (BCMA data are in orange, CD19/20 data are shown in blue). Boxes represent interquartile range, horizontal lines within boxes represent the median, and whiskers extend to minimum and maximum values. The dashed reference line (a–k) represents the threshold for seroprotection; for S. pneumoniae (l), the reference lines correspond to boundaries between low, modest, intermediate, moderate, and high levels. Brackets above boxplots show statistical significance for within and between group comparisons from generalized estimating equation models of mean log10 titers for each pathogen with independent variables for group, time point, and their interaction; tests of coefficients from these models were two-sided with no adjustments for other variables or for multiple comparisons (see Supplementary Table 4 for exact P values). *** indicates p < 0.001, ** indicates 0.001 ≤ p < 0.01, * indicates 0.01 ≤ p < 0.05, and NS indicates not significant with p ≥ 0.05. Vaccines affecting at least one relevant pathogen were administered between sample collection time points in 59 (46%) participants. See Supplementary Fig. 11a–l that shows Fig. 3 data when any samples with a prior vaccination during this study time period have been excluded. CARTx CAR-T cell therapy, 6 mo 6 months post-CARTx, 1 yr 1 year post-CARTx. Source data are provided as a Source data file.
To better appreciate the pattern of gains, losses, or stability in seroprotective antibody titers, we generated divergent stacked bar charts (Supplementary Fig. 9a–d; Supplementary Fig. 10a–d). These visually depict that there was more change in seroprotection status after BCMA-CARTx compared to CD19/20-CARTx. To further summarize these data, we analyzed net gains or losses in the total number of pathogens with seroprotection per participant from pre- to post-CARTx (Fig. 4a, b). Compared to CD19/20-CARTx recipients, BCMA-CARTx recipients were more likely to both gain and lose seroprotective levels of pathogen-specific antibodies compared to pre-CARTx levels, both at 6 months and 1 year, but had a higher net gain of protective immunity by 1 year post-CARTx.

Number of pathogens with seroprotective antibodies per participant pre-CARTx compared to a 6 months post-CARTx and b 1 year post-CARTx for 12 pathogens. The size of each bubble is proportional to the number of participants at each x–y coordinate. Orange bubbles represent BCMA-CARTx recipients and blue bubbles represent CD19/20-CARTx recipients; dark orange bubbles indicate coordinates with both BCMA- and CD19/20-CARTx recipients. The solid diagonal line represents no change in the number of pathogens with seroprotective antibodies from pre-CARTx to post-CARTx time points. The upper left-hand portion of the graph corresponds to gains in the number of pathogens with seroprotective antibodies, and the lower right-hand portion corresponds to losses in the number of pathogens with seroprotective antibodies. Panel A includes 21 BCMA and 89 CD19/20-CARTx recipients; panel B includes 19 BCMA and 72 CD19/20-CARTx recipients. c Distribution of observed percentage of pathogens with seroprotective antibodies at each study time point stratified by CARTx target. Boxes represent interquartile range, horizontal lines within boxes represent the median, and whiskers extend to minimum and maximum values. Numbers above the x-axis show the number of participants in each group. d Adjusted model estimates (filled boxes) with 95% confidence intervals (CI, capped horizontal lines) for the proportion of pathogens with seroprotective antibodies compared over time within and across CARTx target cohorts from logistic generalized estimating equation models (n = 127). Tests of coefficients for differences in these models were two-sided with no adjustments for multiple comparisons. Differences that do not cross the vertical reference line of x = 0 represent statistically significant differences. Comparisons are adjusted for race, time-dependent total IgG, time-dependent total IgA, time-dependent CD19+ B cell count, time-dependent receipt of IVIG in 8–16 weeks before the sample, and time-dependent number of pathogens with vaccination prior to the sample. Vaccines affecting at least one relevant pathogen were administered between sample collection time points in 59 (46%) participants. CARTx CAR-T cell therapy, mo months, yr year. Source data are provided as a Source data file.
Variables associated with seroprotective pathogen-specific antibody titers before and after CARTx
We created a summary measure of pathogen-specific immunity by computing the percentage of pathogens with seroprotective antibodies per participant and time point (Fig. 4c). Across time points, the median percentages for this metric ranged from 67 to 75% for CD19/20-CARTx recipients and 42–50% for BCMA-CARTx recipients. We computed GEE models comparing the composite outcome between and within groups over time, adjusted for baseline and time-dependent clinical and immunologic variables (Fig. 4d; Supplementary Tables 6 and 7). This demonstrated that the proportion of pathogens with seroprotective antibody titers was stable over time after CD19/20-CARTx and modestly increased after BCMA-CARTx (although the increase did not reach statistical significance). BCMA-CARTx recipients had a lower proportion of pathogens with seroprotective antibody titers at all time points compared to CD19/20-CARTx recipients, consistent with the individual-level antibody results. The model-predicted differences translate to approximately two to three fewer pathogens with seroprotection for the BCMA group compared to the CD19/20 group at each time point.
We identified other variables associated with a higher proportion of seroprotective antibody titers from the adjusted models, including higher total IgG, higher total IgA, white race, and receipt of IGRT within 8–16 weeks before sampling (Supplementary Table 7). CD19+ B cell counts and receipt of relevant vaccines during the study period were not associated with the proportion of seroprotective antibody titers. Antibody kinetics restricted to data points without a preceding relevant vaccine administration are depicted in Supplementary Fig. 11a–l.
Comprehensive serological profiling using VirScan to further explore the broader impact of CARTx on antigen-specific humoral immunity
In addition to individual assays to test antibody titers for vaccine-preventable pathogens, we tested the same samples using VirScan to comprehensively analyze antigen-specific antibody profiles. The VirScan assay contains peptides derived from most known human viruses (244 viral species; 1,361 strains), 62 bacterial species (72 strains), 22 parasite and yeast species, and 86 allergens. The median number of “epitope hits” per participant across all time points was 132 (IQR, 72-200) across a median of 55 (IQR, 33-76) species. Among the CD19/20 cohort of adults and CD19, CD22, and CD19/22 CAYA cohort at baseline pre-CARTx, two to three times more epitope hits were observed in adults compared to children <18 years old (Fig. 5a). Consistent with results for vaccine preventable pathogen-specific IgG, BCMA-CARTx recipients demonstrated significantly fewer epitope hits compared to CD19/20 recipients at each measured time point (Fig. 5b). Both groups had relatively stable epitope hits over time despite CARTx, and these findings were confirmed in an adjusted GEE model (Supplementary Tables 8 and 9). A history of prior HCT or prior CARTx was significantly associated with fewer epitope hits.

a Boxplot showing the total number of unique antigen-specific antibody epitope hits detected by VirScan at the pre-CARTx time point stratified by age group (years) in CD19/20/22 CARTx recipients (n = 122; 100 adults and 22 pediatric participants). The y-axis represents the sum of epitope hits across all antigens. Boxplots display the interquartile range (IQR), median (horizontal line), and range (whiskers), with outliers shown as individual points. Red dots indicate the mean number of epitope hits within each age group. b Violin plots depicting the distribution of total epitope hits per individual at pre-CARTx, 6 months post-CARTx, and 1 year post-CARTx in BCMA (orange, n = 28) and CD19/20 (blue, n = 100) CARTx recipients. Each distribution includes the full density of observed values, with the red dot marking the group means. Epitope hits represent the cumulative number of distinct reactive peptides identified across all antigens profiled by VirScan. c Violin plots showing Shannon Evenness, a metric of diversity that quantifies the uniformity of epitope reactivity across all detected pathogen and autoantibody species. Plots represent the distribution of evenness scores at pre-CARTx, 6-month, and 1-year post-CARTx timepoints in BCMA (orange, n = 28) and CD19/20 (blue, n = 100) CARTx recipients. Red dots denote group means. d Violin plots of Simpson’s Index, a diversity measure reflecting both the richness and relative abundance of reactive epitopes among antigens profiled by VirScan. Plots represent the distribution of index scores at pre-CARTx, 6-month, and 1-year post-CARTx timepoints in BCMA (orange, n = 28) and CD19/20 (blue, n = 100) CARTx recipients. Red dots denote group means. CARTx CAR-T cell therapy, mo months, yr year. Source data are provided as a Source data file.
We also assessed measures of diversity, including richness (number of different targets represented) and evenness (relative abundance of epitopes from each target). We first estimated Shannon’s Evenness index, a measure of the evenness of epitopes of different targets distributed within a sample. This metric was stable over time in both cohorts but significantly higher in BCMA-CARTx recipients, reflecting depletion of epitopes across targets after BCMA-CARTx (Fig. 5c). In contrast, Simpson’s Index, a combined measure of evenness and richness, was similar between BCMA- and CD19/20-CARTx recipients and stable over time (Fig. 5d). Together, this indicates more richness in the CD19-CARTx cohort due to a higher number of targets with epitope counts >1.
Humoral immune response to routine vaccines after CARTx
We next evaluated the immunogenicity of vaccines administered per standard of care52 in 72 participants, comprised of a subset of 59 participants from the pre/post-CARTx cohort and an additional 13 participants prospectively enrolled after CARTx (Fig. 1; Supplementary Table 10). Sixty participants received CD19/CD20-CARTx and 12 received BCMA-CARTx. Demographic and clinical characteristics were similar to the overall cohort (Supplementary Table 11). The median number of evaluable unique vaccines administered per participant was five (IQR, 5–6; CD19/20 median, 6; IQR, 5–6 vs. BCMA median, 5; IQR, 3–5), targeting a median of six pathogens (IQR, 5–8) with a median of two doses per vaccine (IQR, 1–3; CD19/20 median, 2; IQR, 1–3 vs. BCMA median, 1; IQR, 1–3). Time to first vaccination was a median of 8.6 months (IQR, 7.1–13.6; CD19/20 median, 8.7; IQR, 7.1–13.6 vs. BCMA median, 8.2; IQR, 6.8–12.3) post-CARTx (Supplementary Fig. 12a, b). Details pertaining to the number of participants receiving each dose per pathogen, timing relative to CARTx, and type of pneumococcal vaccines are in Supplementary Tables 12 and 13.
We evaluated pre-vaccine immunoglobulins, B cell subsets, and T cell subsets, stratified by receipt of CD19/CD20 or BCMA-CARTx (Supplementary Fig. 13a–e). Prior to vaccination, IgA was generally lower, and CD19+ B cell counts were generally higher, in BCMA- compared to CD19/20-CARTx recipients, although these differences were not statistically significant. IgM, IgG, and CD4+ T cell counts were similar between CARTx groups.
Pathogen-specific antibody titers prior to and after each relevant vaccine dose are shown in Fig. 6a–l with significance testing shown in Supplementary Table 14. Overall, the majority of testable pathogens showed no significant change in titers after a single vaccine dose, but significant increases were observed after ≥2 doses for 33% of tested pathogens in the CD19/20 cohort and 75% of tested pathogens in the BCMA cohort. These data are similarly displayed based on the proportion with seroprotective titers in Supplementary Fig. 14a–l. Pre-vaccine seroprotective pathogen-specific antibody titers were present for 201 of 357 (56%) total antibody tests in the CD19/20 cohort and 27 of 54 (50%) tests in the BCMA cohort.

a–l Boxplots showing antibody titers measured pre-vaccination and at sequential time points following up to six vaccine doses in participants who received BCMA- (orange) or CD19/20-CARTx (blue). Titers are plotted on a log10(value + 1) scale. The number of participants contributing data at each time point is displayed above the x-axis. The dashed reference line represents the threshold for seroprotection; for S. pneumoniae, the reference lines correspond to boundaries between low, modest, intermediate, moderate, and high levels. Boxes represent the interquartile range (IQR), horizontal lines within boxes show the median, and whiskers extend to the minimum and maximum values. See Supplementary Table 14 for statistical significance for within-group comparisons. m–q Cumulative incidence curves representing the proportion of participants with a seroresponse, defined as a ≥2-fold increase in antibody titer from pre-vaccination levels, among those without seroprotective antibody levels pre-vaccination, over the course of sequential vaccine doses. Curves are stratified by CAR-T target: CD19/20 (blue) and BCMA (orange). The x-axis represents the number of vaccine doses received. The y-axis indicates the cumulative proportion of participants with a seroresponse at or after each dose. Numbers shown below the x-axis reflect the number of participants at risk (i.e., those without a prior seroresponse who continued to receive additional vaccine doses) at each time point by group. Statistical comparison of cumulative incidence curves between CAR-T groups was performed using two-sided Gray’s test; p values are displayed in each panel. Source data are provided as a Source data file.
To estimate and compare seroresponse rates following each vaccine dose, as well as to better understand the clinical utility of vaccination and factors associated with a response, we evaluated vaccine response in participants with pre-vaccine antibody titers below the threshold for seroprotection. Due to relatively high levels of seroprotection for some pathogens, only a subset of participants and pathogens were eligible for this analysis. Demographics and clinical characteristics for those included in the seroresponse analysis were largely similar to those for participants in the vaccine cohort that were excluded from this analysis (Supplementary Table 15). In this subgroup of 58 participants (48 CD19/20, 10 BCMA) with a median of 3 (IQR 2–4) evaluable pathogens per participant, we estimated the cumulative incidence of seroresponse, defined as a ≥2-fold increase in antibody titers after vaccination. Thirty-seven participants (30 CD19/20, 7 BCMA) had a seroresponse for at least one pathogen. The overall cumulative incidence of a seroresponse was approximately 50% or higher for H. influenzae, C. diphtheriae, hepatitis B virus, and S. pneumoniae after ≥2 vaccine doses (Fig. 6m–q; Supplementary Table 16). BCMA-CARTx recipients had earlier and greater overall seroresponse rates compared to CD19/20-CARTx recipients (Fig. 6m–q), although the relatively low number of participants precludes definitive conclusions.
We used Cox regression models to further evaluate correlates of vaccine responsiveness. In adjusted models, receipt of BCMA-CARTx (adjusted hazard ratio [aHR], 2.53; 95% CI, 1.05–6.08; p = 0.04) and higher CD19+ B cell count (aHR per log10 increase, 2.16; 95% CI, 1.44–3.23; p < 0.001) were significantly associated with increased seroresponse, when averaged across pathogens (Table 2). CD19+ B cell count ≥20 cells/µL (indicative of B cell recovery) was a pre-specified threshold for analysis and similarly associated with a greater rate of seroresponse (aHR, 3.72; 95% CI, 1.72–8.01; p < 0.001; Table 2). To further explore the impact of CD19+ B cell count on individual vaccine responses, we created cumulative incidence curves of seroresponse stratified by CD19+ B cell count, which showed a general pattern of greater seroresponse in participants with ≥20 cells/µL (indicative of B cell recovery) across evaluable pathogens (Supplementary Fig. 15a–e; Supplementary Fig. 16a–c). Notably, vaccine responses were also observed in participants with low (<20 cells/μL) or no CD19+ B cell counts (Supplementary Tables 17 and 18). For example, seroresponses after 2 doses of vaccination in individuals with CD19+ B cell counts <20 cells/μL ranged from 17 to 50%, depending on the pathogen (Supplementary Table 18).
S. pneumoniae functional and serotype-specific responses to vaccination
To evaluate whether vaccine seroresponse based on total S. pneumoniae IgG titers correlates with functional humoral immunity and serotype-specific responses, we assessed pneumococcal opsonophagocytic activity and serotype-specific IgG levels among twelve participants who met the seroresponse criterion and had paired pre-vaccine and post-dose 2 serum samples available for testing. Responses were tested for the 13 serotypes included in the PCV13 vaccine. Among this subgroup, a ≥4-fold increase in functional opsonophagocytic activity was detectable for at least one serotype for 10 of the 12 participants and to a median of 8 serotypes (IQR, 5–9) in these 10 participants (Supplementary Fig. 17a). Serotype-specific IgG testing demonstrated a ≥4-fold increase in IgG for at least one serotype in 9 of 12 participants and to a median of 5 serotypes (IQR, 4–9) in these 9 participants (Supplementary Fig. 17b). A moderate correlation was observed between fold change in opsonization and IgG (ρ = 0.65 aggregated across all serotypes, and ranging from ρ = 0.36 to 0.87 for individual serotypes).
Discussion
This study highlights distinct patterns of pathogen-specific humoral immunity and vaccine responses among recipients of CD19/20- and BCMA-CARTx. Our results demonstrate that CD19/20-CARTx recipients have stable pathogen-specific humoral immunity after treatment but may lack seroprotective antibodies for up to one-third of vaccine-preventable pathogens. BCMA-CARTx recipients also demonstrated stable pathogen-specific immunity but lacked seroprotective antibodies for nearly half of tested vaccine-preventable pathogens by 1 year after treatment, representing a significantly larger deficit in pathogen-specific humoral immunity compared to CD19/20-CARTx recipients. A relatively low proportion of CD19/20-CARTx recipients achieved seroresponse to vaccination and typically required ≥2 doses to stimulate an immune response. In contrast, the rate of seroresponse in BCMA-CARTx recipients was twice as high. A higher pre-vaccine peripheral blood CD19+ B cell count was the primary variable associated with vaccine responsiveness, supporting the use of B cell recovery as a useful metric for guiding vaccine initiation after CARTx for B cell lineage malignancies.
We hypothesized that CD19/20-CARTx recipients would maintain high levels of pathogen-specific immunity and have persistence of antibody diversity due to preservation of plasma cells, the key source of antibodies to previously encountered immunogens. This was confirmed by our findings and is consistent with other studies of immune reconstitution after CD19/20-CARTx therapy26,53,54. By comparison, BCMA is expressed predominantly on long-lived plasma cells and a subset of memory B cells, including plasmablasts, that are critical for the maintenance of humoral immunity17. Thus, we initially hypothesized that BCMA-CARTx recipients would have a loss of pathogen-specific IgG and antibody diversity. We observed that these participants already had substantial pathogen-specific immune deficits prior to CARTx, likely due to their underlying plasma cell malignancy and prior anti-tumor therapies (median of 8 prior lines of therapy, and 75% had a prior HCT). After BCMA-CARTx, we observed a modest but non-significant recovery of pathogen-specific immunity, which may have been in part due to use of IGRT in the 8–16 weeks prior to sampling and re-vaccination, based on the attenuated change estimates and lack of statistical significance after adjusting for these variables. However, the small sample size restricts definitive conclusions. These overall findings for vaccine-preventable pathogens with targeted antibody testing were confirmed for pathogen-specific immunity more broadly using the VirScan serologic profiling assay and are consistent with findings from other smaller studies55,56,57,58.
As part of this study, we also enrolled a unique pediatric cohort of 22 CAYA CARTx recipients. There are limited data about pathogen-specific immunity in younger individuals prior to and after CARTx. In comparisons of pre-CARTx antibody levels in this younger cohort to adult CD19/20-CARTx recipients, we observed lower levels of antibody titers for many pathogens, with some anticipated differences based on exposures and vaccine schedules. Notably, broad antibody diversity measured by VirScan increased with age and was consistent with findings from a prior study in healthy individuals59. Due to subsequent HCT or IGRT use after CARTx in younger individuals, we had too few post-CARTx measurements to determine whether they similarly maintain pathogen-specific humoral immunity as observed in adults.
In addition to documenting clear deficits in pathogen-specific immunity in CARTx recipients, this study also interrogated response to vaccination in a subgroup of 72 participants receiving a variety of routine vaccines after CARTx. There remains a limited understanding of vaccine immunogenicity in this population aside from studies of SARS-CoV-2 vaccination41,43,44,45,47. Our results demonstrated that BCMA-CARTx recipients achieved a seroresponse after vaccination at over twice the rate as CD19/20-CARTx recipients, which we hypothesize was due to a preserved naïve B cell compartment. These results are fairly consistent with, and substantially extend, the initial observations from SARS-CoV-2, influenza, and other vaccine studies41,43,44,45,47. Importantly, we used an opsonophagocytic assay for S. pneumoniae to demonstrate that increases in binding antibody responses correlated with functional antibody responses, similar to data from a recent pneumococcal vaccine trial in HCT recipients60.
In adjusted models, higher pre-vaccination peripheral blood CD19+ B cell count was the key immunologic predictor of vaccine response; individuals with B cell counts <20 cells/μL had a relatively low cumulative incidence of seroresponse of approximately 20–50% after ≥2 vaccine doses across different pathogens. A recent retrospective study found similar associations between higher B cell count, as well as IgA, and vaccine response46. Based on our findings, a CD19+ B cell count ≥20 cells/μL may be a useful clinical heuristic for guiding initiation of vaccination after CARTx, although lower values do not preclude a humoral response, and patients may still generate T cell responses, even with undetectable B cell counts32,44,61,62.
Together, our data demonstrate that CD19/20- and BCMA-CARTx recipients have stable but ongoing humoral pathogen-specific immunity deficits through 1 year after CARTx, with greater deficits in BCMA-CARTx recipients. Vaccination is a valuable tool to mitigate some of these deficits. For influenza and SARS-CoV-2, which need to be given on a recurring basis, prior data have supported starting as early as 3 months post-CARTx, irrespective of B cell recovery44. This is based in part on observations that individuals with B cell depletion, including CARTx recipients, can generate robust T cell responses that are likely associated with reduced severity of viral infections if infected32,44,61,62.
Strengths of this study include its prospective design with longitudinal sampling starting pre-CARTx, relatively large sample size, and control for IGRT administration and relapse. This enabled evaluation of the influence of CARTx on pre-existing immunity, as well as comparisons across CARTx targets and other variables in adjusted models. The inclusion of a CAYA cohort allowed for unique baseline comparisons across age groups to inform the pathogen-specific immune status of young individuals prior to CARTx, which has not been previously well described, although a healthy age-matched cohort would be necessary to make further conclusions. The use of VirScan for comprehensive antibody repertoire profiling complements the pathogen-specific findings. Finally, there are few published data pertaining to vaccination responses, and strategies to inform when to vaccinate CARTx recipients, aside from SARS-CoV-2. To the authors’ knowledge, this is the largest study of vaccine humoral immunogenicity to routine vaccines and the variables associated with a vaccine response after CARTx.
Limitations include small sample size in some subgroup analyses and variability in vaccination timing, as vaccines were administered in the setting of routine clinical care. Vaccination histories prior to CARTx were also not available. In addition, models used for comparisons of humoral immunity pre- and post-CARTx assumed any missing data occurred at random. Because we excluded those with IGRT in the previous 8 weeks or with relapse, it is possible that humoral immunity was lower in the excluded participants. Analyses of response to vaccination may be subject to selection bias based on who was offered vaccination in the clinical setting, although a standard guideline was available throughout the study duration, and characteristics were similar among patients who were and were not vaccinated. We were unable to obtain longitudinal samples from most of the pediatric participants due to meeting exclusion criteria prior to the 6-month post-CARTx time point. Thus, these findings may not be generalizable to CAYA CARTx recipients. Vaccine-induced cellular immunity was not assessed in this study, but it is an important aspect of immunity for many infections.
In summary, we demonstrate that individuals receiving BCMA-CARTx had greater immune deficits than CD19/20-CARTx recipients before and up to 1 year after CARTx. CARTx had minimal impact on pre-existing pathogen-specific antibody titers following both CD19/20- and BCMA-CARTx, but immunologic deficits were frequent in both groups through 1 year post-treatment. These data highlight the need for supportive care to reduce infection risk, as underscored by observations that infections are the most common cause of non-relapse mortality after CARTx15,16. Re-vaccination can be successfully utilized to boost antibody titers, particularly among patients with higher B cell counts.
Methods
Study approval
All participants provided written informed consent prior to inclusion in the study in accordance with the Declaration of Helsinki. The investigation was approved by the Fred Hutch Institutional Review Board.
Study design and participants
Pediatric and adult participants were enrolled as part of a prospective observational study of individuals with an underlying B cell lineage malignancy with planned treatment with chimeric antigen receptor T cell therapy (CARTx). Individuals were recruited from the Fred Hutchinson Cancer Center (Fred Hutch) or Seattle Children’s Hospital (SCH). All individuals who received commercial or investigational CARTx for a B cell or plasma cell malignancy were approached for enrollment. Informed consent was obtained from all participants. Investigational study protocols for participants enrolled in this study included the following at SCH (NCT02028455, NCT03244306, NCT03330691, NCT03338972, and NCT03684889) and Fred Hutch (NCT01865617, NCT02706392, NCT03103971, NCT02706405, NCT02631044, NCT03277729, NCT03105336, NCT02614066, NCT03331198, NCT03575351, NCT03502577, NCT03338972, NCT02028455). Demographic and treatment details for participants were extracted from medical records and electronic databases. Sex and gender were not considered in the study design. Sex was determined based on self-report of participants as indicated in the electronic medical record. Gender was not collected as part of enrollment. Participants were compensated for each blood sample received.
Eligible individuals for pre/post-CARTx analyses included those in sustained remission from their underlying malignancy after CARTx, without new anti-tumor directed therapy or hematopoietic cell transplant (HCT) for their underlying malignancy prompting CARTx. Receipt of pre-planned maintenance therapy was not exclusionary. Follow-up samples were obtained at approximately 6 months and 1-year post-CARTx. For inclusion in pre/post-CARTx analysis, a pre- and at least one post-CARTx sample ≥3 months from CARTx was required. A subset of pediatric participants with only pre-CARTx samples were included in descriptive results comparing baseline pre-CARTx data only.
We evaluated vaccine responses among participants eligible for the above analyses who received at least one vaccine and who had a preceding and ≥1 post-vaccine sample obtained for testing. This analysis also included additional participants prospectively enrolled after CARTx. Vaccinations after CARTx were administered according to the Fred Hutch Standard Practice Guideline52 at the discretion of health care providers. Briefly, killed or inactivated vaccinations were recommended in patients who were ≥6 months post-CARTx and off IVIG for ≥2 months, irrespective of immune reconstitution. Live vaccines were recommended in patients who were ≥12 months post-CARTx, off immunosuppression for ≥12 months, had not received IVIG for ≥8 months, and had a CD4+ T cell count >200 cells/mm3.
Samples obtained within 8 weeks (<2 half-lives for circulating IgG) of immunoglobulin replacement therapy (IGRT) were excluded from all analyses to reduce contribution of supplemental IgG to the interpretation of pathogen-specific titer results26,63.
Samples and testing
Samples from all time points were blinded to clinical details and batch tested per participant to minimize batch effects. Serum was isolated from whole blood collected in red-top vacutainer tubes and stored at −80 °C. Peripheral blood mononuclear cells (PBMCs) from whole blood were collected in acid citrate dextrose vacutainers. PBMCs were isolated by Ficoll-Histopaque gradient separation followed by centrifugation to obtain a mononuclear cell layer. PBMCs were washed, aliquoted in freezing medium of 90% fetal bovine serum and 10% DMSO before storage in liquid nitrogen.
Testing for serum total immunoglobulins and pathogen-specific IgG titers
Total IgG, total IgM, and total IgA in serum were tested via turbidometry at the University of Washington Department of Laboratory Medicine. In participants with multiple myeloma (MM), we estimated total IgG, IgM, and IgA by subtracting the monoclonal component. Pathogen-specific total IgG or serotype-specific-IgG was measured for hepatitis A, hepatitis B, poliovirus type 1 and 3, varicella zoster virus, measles, mumps, rubella, Haemophilus influenzae type B, Clostridium tetani, Corynebacterium diphtheriae, and Streptococcus pneumoniae using gold standard tests in Clinical Laboratory Improvement Amendments (CLIA)-certified reference laboratories as detailed in Supplementary Table 19. Immunoglobulin and pathogen-specific IgG values that were below the lower detection limit were assigned values of the lower detection limit divided by 2; values above the upper detection limit were assigned values of the upper detection limit.
Evaluation of functional antibodies against S. pneumoniae using a multiplex opsonophagocytosis assay (MOPA)
Functional anti-pneumococcal antibodies were assessed using a standardized multiplex opsonophagocytosis assay (MOPA) performed by Sunfire Biotechnologies. Participants were included if they had paired pre-vaccine and post-dose 2 serum samples and demonstrated a ≥2-fold increase (i.e., seroresponse) in total S. pneumoniae IgG antibodies (Mayo Clinic Laboratories); pre-vaccine seroprotection was not an exclusion criterion. The assay quantified opsonization indices (OIs) against the 13 PCV13 serotypes 1, 3, 4, 5, 6A, 6B, 7F, 9V, 14, 18C, 19A, 19F, and 23F using antibiotic-resistant target strains and differentiated HL-60 phagocytes, following validated MOPA protocols developed by Nahm and colleagues64,65. Heat-inactivated sera were serially diluted and incubated with pneumococci, complement, and HL-60 cells; surviving bacteria were enumerated after incubation, and OIs were calculated as the reciprocal dilution achieving 50% killing.
Evaluation of B cell subsets, T cell subsets, and plasma cells
B and T cell subsets were immunophenotyped from whole blood PBMC samples. All monoclonal antibodies used for flow-cytometric immunophenotyping were commercially available, research-grade reagents with established specificity and prior validation by the manufacturers. Antibodies were selected based on standard use in immune-cell profiling panels and clones with well-characterized performance. Samples were thawed and incubated in FACS buffer (DPBS + 2% fetal bovine serum) with antibody cocktails. Cells were labeled with antibodies including combinations of anti-CD4 Alexa Fluor 488 (clone OKT4, BioLegend), anti-IgM PerCP-Cy5.5 (clone G20-127, BD), anti-CD8 APC-H7 (clone SK1, BD), anti-CD19 BV421 (clone HIB19, BD), anti-CD45 BV510 (clone HI30, BD), anti-CD3 BV605 (clone UCHT1, BioLegend), anti-CD14 BV711 (clone M0P-9, BD), anti-CD16 BV711 (clone 3G8, BD), anti-IgD BUV737 (clone IA6-2, BD), anti-CD27 PE-Cy7 (clone LG.7F9, Thermo Fisher Scientific) and fixable viability dye (FVD). B cells were defined as CD19+CD3-expressing cells in the lymphocyte population (Supplementary Fig. 18). The following B cell populations were delineated: CD27−IgD+ (naive B cells), CD27+IgD–IgM− (switched memory B cells), and CD27+IgD−IgM+ (unswitched memory B cells). Additionally, T cells were defined as CD19−CD3+ expressing cells in the lymphocyte population. CD4+ and CD8+ T cells were further delineated. Plasma cells in bone marrow were evaluated clinically by the University of Washington Immunohistochemistry Lab, with CD138 expression measured via staining with anti-CD138 (clone BA38) on a Bond III autostainer. Absolute B and T cell counts were calculated by multiplying proportions from flow cytometry by absolute lymphocyte counts from complete blood cell count results. Analyses were performed using FlowJo Software (version 10.10).
IgG profiling using a systematic epitope scanning method (VirScan)
We performed VirScan59 utilizing the expanded VirScan bacteriophage display library (Vir3)66 containing 115,753 200-mer oligonucleotides, encoding 56-residue peptide tiles with 28-residue overlaps, that together span the reference protein sequences of most known human viruses (244 viral species; 1,361 strains). Additionally, the Vir3 library contains peptides for 62 bacterial species (72 strains), 86 allergens, 22 parasite and yeast species, and a small assortment of other organisms with sequences sourced from the Immune Epitope Database (IEDB)66.
We mixed phage library with a volume of serum containing 2 µg of total IgG per sample. In participants with IgG MM, we estimated 2 µg total non-multiple myeloma IgG by subtracting the monoclonal component, estimated from the gamma region of serum protein electrophoresis. All samples were tested in two technical replicates. Serum antibodies were allowed to bind to phage overnight at 4 °C on a rotator with continuous mixing. Antibody-phage complexes were immunoprecipitated using Dynabead Protein A and Protein G Magnetic Beads (ThermoFischer Scientific) and lysed to release the corresponding DNA insert sequences from the bound phage. Phage DNA inserts were amplified to attach appropriate adapter sequences and individual index sequences. Indexed amplimers were then quantified with fluorometry using the Qubit dsDNA High Sensitivity Assay Kit (ThermoFischer Scientific). Samples were then pooled in equal proportions, gel-purified, and sequenced on an Illumina NextSeq P2 (Illumina) Next Generation Sequencing (NGS) using a custom read primer. Raw NGS outputs were analyzed through phippery67. Sequence reads were aligned, and oligonucleotides were deconvoluted into antigen epitope “hits” (presence of antibody against an epitope) using a Z-score enrichment approach to detect and measure the relative enrichment of each epitope against a background of beads-only samples without added serum66. An epitope hit was assigned when the z-score was calculated to be above a threshold of >7.0 standard units in both replicates. Multiple epitope hits sharing a seven amino acid overlap were considered to have the same antibody specificity and collapsed into a singular hit. The highest z-score of the collapsed hits was retained, and all lower scores were filtered out.
Evaluation of CAR-T cell persistence
CAR-T cell persistence was quantified via quantitative PCR assays on cryopreserved PBMC samples from 6 months to 1 year post-CARTx time points. Samples chosen for analysis were those for which a commercial or investigational qPCR assay was available. Tests were developed and conducted by the Fred Hutch Immune Monitoring Core. DNA was extracted from PBMCs and used to amplify the following gene sequences, as relevant: Flap-EF1, Hum CD19, and 28BB. Continuous fluorescent measurement of the PCR products was performed during each cycle of amplification. Samples were run in parallel with a no-template control, a known copy number plasmid positive control, and participants’ samples. All controls and samples were set up on a 96-well plate and run in triplicates. Following qPCR, the mean cycle threshold (CT) values obtained from the triplicate samples were used to calculate the copy number of targeted genes from the participants’ samples based on the previously established standard curves. Samples with an absolute copy number of greater than 10 target sequences/μg input DNA were defined as positive.
Statistical analyses and reproducibility
We pre-specified a targeted sample size of 130 CARTx recipients (50 adult and 50 pediatric CD19/CD20-CARTx recipients, and 30 adult BCMA-CARTx recipients). Based on this sample size, we computed the precision of seroprotection estimates within each group and the minimum detectable differences in seroprotection between groups, for the 6-month time point post-CARTx, for a given pathogen. Wilson 95% confidence intervals (CI) were within ±14% for the CD19/CD20 cohorts and within ±18% for the BCMA cohort. Assuming a range of 70–90% for the percentage of adult CD19/20-CARTx recipients with seroprotection at 6 months, our study design had 80% power for detection of clinically relevant differences in the prevalence of seroprotection when comparing either the pediatric CD19/20-CARTx cohort (minimum detectable relative risks [RR], 1.5–2.9) or the BCMA-CARTx cohort (minimum detectable RR, 1.6–2.2) to the adult CD19/20-CARTx cohort; these calculations were based on Fisher’s exact test, with a 2-sided type I error rate of 0.025 for each comparison to maintain an overall type I error rate of 0.05 using a Bonferroni correction. For example, if we assumed 80% of adult CD19-CARTx recipients have seroprotective IgG to measles 6-months post-CARTx, we would be powered to detect a 44% or lower prevalence of seroprotective IgG to measles after adult BCMA-CARTx (minimum RR of 1.8).
Laboratory values other than those reported as percentages were expressed as log10(value + 1) to accommodate values <1 and right-skewed distributions. For analyses of kinetics of pathogen-specific immunity and VirScan metrics before and after CD19/20 and BCMA-targeted CARTx, we used the following generalized estimating equations (GEE) framework. Our primary exposure variables were CARTx target (CD19/20 versus BCMA) and time point (6 months and 1 year post-CARTx versus pre-CARTx); we included these variables, as well as the interactions between CARTx target and time point, in all models and referred to this as base model one. Using the interaction terms, CARTx target comparisons were conducted for each time point, and time point comparisons were conducted within each CARTx target group. These models used an independent working correlation with robust standard errors. Pathogen-specific comparisons of antibody titer outcomes (using the normal distribution) and proportion of participants with seroprotective antibody titer outcomes (using the binomial distribution with logit link) were conducted using base model one; separate models were used for each pathogen. Due to sparse data or zero cells for the proportion with seroprotective antibodies among certain pathogens, alternative methods were used in select cases; chi-square or Fisher’s exact tests were used to compare outcomes by CARTx target, and GEE models using subgroups were used to compare outcomes by time point. We did not adjust for multiple comparisons in these or any analyses; two-sided tests were used for all analyses. Pathogen-specific proportion of participants with seroprotective antibodies were also estimated for each group and time point using Wilson 95% confidence intervals (CI).
For the pre- and post-CARTx pathogen-specific immunity analyses, our primary outcome was a summary metric defined as the proportion of pathogens with seroprotective antibody levels, computed for each participant at each time point. To test for differences in this outcome by groups, we used logistic GEE models with the dependent variable specified as the number of pathogens with seroprotective antibody levels (successes) out of the number of pathogens measured (trials) per participant at each time point, with similar specifications as described above. Here, we added time-dependent variables for receipt of IGRT in the 8–16 weeks before each sample and number of pathogens with vaccination prior to each sample to the base model one described above, and referred to this as base model two. Pre-specified candidate adjustment variables included age at CARTx (>60 years versus ≤60 years), biological sex, race (nonwhite versus white), ethnicity, number of lines of cancer therapy prior to CARTx, any prior HCT or CARTx, any B cell targeting therapy in 6 months before CARTx, type of CARTx product (commercial versus investigational), and the following laboratory measures as time-dependent covariates: total IgG, IgA, IgM; CD19+ B cell count; CD4+ T cell count. Multivariable model selection used a modified purposeful variable selection procedure as follows68. For each candidate adjustment variable, we first ran models that added the candidate adjustment variable to base model two. Continuous variables were evaluated for functional form and categorized according to clinical cut points if a linear relationship was not supported. When included in these models, adjustment variables that either led to a >20% change in any of the primary exposure model coefficients or had a p value < 0.20 were then added to a preliminary multivariable model. Next, candidate adjustment variables that were neither significant at the 0.10 level, nor changed any other variable coefficients by >20% were sequentially removed from the preliminary model. Finally, we confirmed that none of the initially excluded adjustment variables were significant at the 0.10 level nor changed other variable coefficients by >20%, to arrive at the final multivariable model. Model estimates were presented as odds ratios (OR) with 95% confidence intervals (CI). For easier interpretation of the primary comparisons, we also presented model-predicted proportions of pathogens with seroprotection within primary exposure subgroups, using marginal standardization69. This method computes a weighted average of predicted probabilities to reflect the confounder distribution in the target population, which, in our case, was the total cohort eligible for this analysis.
VirScan analyses
Statistical methods were adapted from ecologic analyses employed in microbiome or other population analyses: (i) total epitope score: the sum of unique epitopes observed for all antigens in VirScan, (ii) Simpson’s Index70,71, and (iii) Shannon’s Evenness metric72,73.
We used GEE to describe and compare means and mean changes in the evaluated VirScan metrics at pre-, 6-month, and 1-year post-CARTx time points. The base model included primary explanatory variables, including CARTx type and sampling time points. Interaction terms between different time points (pre-CARTx, 6-months post-CARTx, 1-year post-CARTx) and the CARTx group were included in the models to estimate changes within each subgroup and to test whether these changes differed by subgroup. Additionally, the base model was adjusted for receipt of IGRT 8–16 weeks before sample collection. We also adjusted for other potential confounders in the models and explored associations of other biologically relevant variables with these outcomes. To aid parsimonious model building, we used purposeful variable selection to choose the optimal number of additional confounders to adjust for in each model.
Violin plots were generated to graphically represent the spectrum of viruses and epitope densities at pre- and post-CARTx time points for each CARTx group (CD19 vs. BCMA). Furthermore, we explored the relationship between age (discretized age group categories 0–8, 9–17, 18–39, 40–59, 60–69, ≥70) and VirScan outcomes at baseline for those receiving only the CD19-CARTx therapy (100 adults, 22 pediatric participants).
Vaccine immunogenicity analyses
Initial descriptive vaccine response analyses included participants with ≥1 pre- and ≥1 post-vaccine dose sample, regardless of the sequential dose to which this corresponded; a sample collected before the first vaccine dose was not required. Baseline (pre-first dose of vaccine) immunoglobulins, B cell subsets, and T cell subsets were defined as those corresponding to the earliest vaccine administered per participant. These baseline values were compared by CARTx target group using Wilcoxon rank-sum tests. Pathogen-specific antibody titers were compared by CARTx target group and time point using similar GEE models as described for previous analyses. Due to sparse data, values for post-dose≥2 were combined, and for some pathogens, simplified models with fewer parameters and/or small sample bias corrections were used.
To estimate the cumulative incidence of vaccine response overall and by select baseline factors, we focused on a clinically relevant group of participants with baseline titers below the defined threshold for seroprotection for at least one pathogen. Vaccine response was evaluated separately for each pathogen. Pathogens with too few participants meeting baseline criteria for inclusion were excluded from these analyses. Fold differences in pathogen-specific antibody titers following each vaccine dose were computed using the ratio of post-dose to baseline untransformed values; baseline values of zero were assigned a value of half the distance to the minimum non-zero value for purposes of these calculations. Cumulative incidence of vaccine response was computed using dose as the time variable. Participants not achieving the seroresponse endpoint, defined as a ≥2-fold increase in antibody titers, were censored after the last dose received. To test for associations between select baseline factors (CARTx target, time from CARTx to first vaccine dose, and baseline CD19+ B cell count) and hazard rate of vaccine response, we used marginal discrete time (dose) multivariate Cox models with robust standard errors to accommodate participants that contributed vaccine response data for ≥1 pathogen (multiple endpoints)74. This model was stratified by pathogen, allowing for separate baseline hazards for each pathogen. We tested for equal effects across pathogens and estimated an average effect across pathogens when there was not sufficient evidence to suggest unequal effects. We first ran univariable models for each factor. We considered two different parameterizations of baseline CD19+ B cell count: continuous on the log10 scale and a pre-specified binary indicator of ≥20 cells/µL vs <20 cells/µL, based on the use of this threshold in other studies. Due to limited number of events, multivariable models including a maximum of two independent variables were considered by selecting variables significant in univariable analysis. Separate models were developed for each of the two parameterizations of baseline CD19+ B cell count.
SAS, version 9.4 (SAS Institute, Cary, North Carolina); Stata, version 18.5 (StataCorp LLC, College Station, Texas); and R (version 4.3.1) were used for analyses.
Reporting summary
Further information on research design is available in the Nature Portfolio Reporting Summary linked to this article.
Data availability
Comprehensive individual-level data generated in this study contain human participant information and, therefore, are not publicly available due to ethical and legal restrictions, including participant privacy protections and the terms of informed consent. Access to the minimum necessary de-identified dataset required to reproduce all analyses is available via controlled access through Fred Hutchinson Cancer Center’s data governance processes. Requests will be subject to institutional review and require submission of (i) a brief research proposal, (ii) documentation of IRB/ethics approval or exemption as applicable, and (iii) execution of an appropriate data use agreement. Requests may be initiated by contacting the corresponding author (jahill3@fredhutch.org) after publication. The authors will make their best efforts to provide the requested information within 3 months of the request. Source data are provided with this paper.
References
Cappell, K. M. & Kochenderfer, J. N. Long-term outcomes following CAR T cell therapy: what we know so far. Nat. Rev. Clin. Oncol. 20, 359–371 (2023).
June, C. H. & Sadelain, M. Chimeric antigen receptor therapy. N. Engl. J. Med. 379, 64–73 (2018).
Bhaskar, S. T., Dholaria, B., Savani, B. N., Sengsayadeth, S. & Oluwole, O. Overview of approved CAR-T products and utility in clinical practice. Clin. Hematol. Int. 6, 100–106 (2024).
Roddie, C. et al. Obecabtagene autoleucel in adults with B-cell acute lymphoblastic leukemia. N. Engl. J. Med. 391, 2219–2230 (2024).
Swan, D., Madduri, D. & Hocking, J. CAR-T cell therapy in Multiple Myeloma: current status and future challenges. Blood Cancer J. 14, 1–16 (2024).
Brudno, J. N. et al. T cells genetically modified to express an anti-B-Cell maturation antigen chimeric antigen receptor cause remissions of poor-prognosis relapsed multiple myeloma. J. Clin. Oncol. 36, 2267–2280 (2018).
Schett, G. et al. Advancements and challenges in CAR T cell therapy in autoimmune diseases. Nat. Rev. Rheumatol. 20, 531–544 (2024).
Müller, F. et al. CD19 CAR T-cell therapy in autoimmune disease—a case series with follow-up. N. Engl. J. Med. 390, 687–700 (2024).
Brudno, J. N. & Kochenderfer, J. N. Toxicities of chimeric antigen receptor T cells: recognition and management. Blood 127, 3321–3330 (2016).
Kochenderfer, J. N. et al. B-cell depletion and remissions of malignancy along with cytokine-associated toxicity in a clinical trial of anti-CD19 chimeric-antigen-receptor-transduced T cells. Blood 119, 2709–2720 (2012).
Maude, S. L. et al. Chimeric antigen receptor T cells for sustained remissions in leukemia. N. Engl. J. Med. 371, 1507–1517 (2014).
Turtle, C. J. et al. CD19 CAR–T cells of defined CD4+:CD8+ composition in adult B cell ALL patients. J. Clin. Investig. 126, 2123–2138 (2016).
Turtle, C. J. et al. Immunotherapy of non-Hodgkin’s lymphoma with a defined ratio of CD8+ and CD4+ CD19-specific chimeric antigen receptor-modified T cells. Sci. Transl. Med. 8, 355ra116 (2016).
Porter, D. L., Levine, B. L., Kalos, M., Bagg, A. & June, C. H. Chimeric antigen receptor-modified T cells in chronic lymphoid leukemia. N. Engl. J. Med. 365, 725–733 (2011).
Jain, M. D. et al. Five-year follow-up of standard-of-care axicabtagene ciloleucel for large B-cell lymphoma: results from the US Lymphoma CAR T Consortium. J. Clin. Oncol. 42, 3581–3592 (2024).
Cordas dos Santos, D. M. et al. A systematic review and meta-analysis of nonrelapse mortality after CAR T cell therapy. Nat. Med. 30, 2667–2678 (2024).
Halliley, J. L. et al. Long-lived plasma cells are contained within the CD19-CD38hiCD138+ subset in human bone marrow. Immunity 43, 132–145 (2015).
Amanna, I. J., Carlson, N. E. & Slifka, M. K. Duration of humoral immunity to common viral and vaccine antigens. N. Engl. J. Med. 357, 1903–1915 (2007).
Manz, R. A., Thiel, A. & Radbruch, A. Lifetime of plasma cells in the bone marrow. Nature 388, 133–134 (1997).
Tangye, S. G., Liu, Y. J., Aversa, G., Phillips, J. H. & de Vries, J. E. Identification of functional human splenic memory B cells by expression of CD148 and CD27. J. Exp. Med. 188, 1691–1703 (1998).
Robillard, N., Wuillème, S., Moreau, P. & Béné, M. C. Immunophenotype of normal and myelomatous plasma-cell subsets. Front. Immunol. 5, 137 (2014).
Perez-Andres, M. et al. Human peripheral blood B-Cell compartments: a crossroad in B-cell traffic. Cytom. Part B Clin. Cytom. 78, 47–60 (2010).
Pihlgren, M. et al. Delayed and deficient establishment of the long-term bone marrow plasma cell pool during early life. Eur. J. Immunol. 31, 939–946 (2001).
Pescovitz, M. D. et al. Effect of rituximab on human in vivo antibody immune responses. J. Allergy Clin. Immunol. 128, 1295–1302.e5 (2011).
Pescovitz, M. D. et al. Rituximab, B-lymphocyte depletion, and preservation of beta-cell function. N. Engl. J. Med. 361, 2143–2152 (2009).
Walti, C. S. et al. Antibodies against vaccine-preventable infections after CAR-T cell therapy for B cell malignancies. JCI Insight 6, e146743 (2021). 146743.
Reynolds, G. K. et al. Seropositivity against vaccine preventable infections in the early post chimeric antigen receptor T-cell period: preservation of vaccine-associated antibodies between 0 and 6 months. Br. J. Haematol. 205, 2498–2502 (2024).
Bhoj, V. G. et al. Persistence of long-lived plasma cells and humoral immunity in individuals responding to CD19-directed CAR T-cell therapy. Blood 128, 360–370 (2016).
Carpenter, R. O. et al. B-cell maturation antigen is a promising target for adoptive T-cell therapy of multiple myeloma. Clin. Cancer Res. 19, 2048–2060 (2013).
O’Connor, B. P. et al. BCMA is essential for the survival of long-lived bone marrow plasma cells. J. Exp. Med. 199, 91–98 (2004).
Novak, A. J. et al. Expression of BCMA, TACI, and BAFF-R in multiple myeloma: a mechanism for growth and survival. Blood 103, 689–694 (2004).
Kinoshita, H. et al. T cell immune response to influenza vaccination when administered prior to and following autologous chimeric antigen receptor-modified T cell therapy. Transplant. Cell. Ther. 31, 327–338 (2025).
Gonzalez, M. A. et al. Humoral and cellular responses to SARS-CoV-2 vaccines before and after chimeric antigen receptor-modified T-cell therapy. Blood Adv. 7, 1849–1853 (2023).
Kansagra, A. J. et al. Clinical utilization of Chimeric Antigen Receptors T-cells (CAR-T) in B-cell acute lymphoblastic leukemia (ALL)—an expert opinion from the European Society for Blood and Marrow Transplantation (EBMT) and the American Society for Blood and Marrow Transplantation (ASBMT). Biol. Blood Marrow Transplant. 25, e76–e85 (2019).
Wat, J. & Barmettler, S. Hypogammaglobulinemia After Chimeric Antigen Receptor (CAR) T-Cell Therapy: characteristics, management, and future directions. J. Allergy Clin. Immunol. Pract. 10, 460–466 (2022).
Tacke, C. E. et al. Reduced serologic response to mumps, measles, and rubella vaccination in patients treated with intravenous immunoglobulin for Kawasaki disease. J. Allergy Clin. Immunol. 131, 1701–1703 (2013).
Richardson, T. et al. Characteristics of infections after BCMA-directed CAR T-cell therapy for multiple myeloma: a real-world analysis. Blood Adv. 9, 1370–1375 (2025).
van Assen, S. et al. Humoral responses after influenza vaccination are severely reduced in patients with rheumatoid arthritis treated with rituximab. Arthritis Rheum. 62, 75–81 (2010).
Bingham, C. O. et al. Immunization responses in rheumatoid arthritis patients treated with rituximab: results from a controlled clinical trial. Arthritis Rheumatol. 62, 64–74 (2010).
Sinisalo, M. et al. Response to vaccination against different types of antigens in patients with chronic lymphocytic leukaemia. Br. J. Haematol. 114, 107–110 (2001).
Walti, C. S. et al. Humoral immunogenicity of the seasonal influenza vaccine before and after CAR-T-cell therapy: a prospective observational study. J. Immunother. Cancer 9, e003428 (2021).
Kochenderfer, J. N. et al. Long-duration complete remissions of diffuse large B cell lymphoma after anti-CD19 chimeric antigen receptor T cell therapy. Mol. Ther. 25, 2245–2253 (2017).
Wiedmeier-Nutor, J. E. et al. Response to COVID-19 vaccination post-CAR T therapy in patients with non-Hodgkin lymphoma and multiple myeloma. Clin. Lymphoma Myeloma Leuk. 23, 456 (2023).
Hill, J. A. et al. SARS-CoV-2 vaccination in the first year after hematopoietic cell transplant or chimeric antigen receptor T-cell therapy: a prospective, multicenter, observational study. Clin. Infect. Dis. 79, 542–554 (2024).
Abid, M. A. & Abid, M. B. SARS-CoV-2 vaccine response in CAR T-cell therapy recipients: a systematic review and preliminary observations. Hematol. Oncol. 40, 287–291 (2022).
Einarsdottir, S. et al. Humoral vaccine responses following chimeric antigen receptor T-cell therapy for hematological malignancies. Blood Cancer J 15, 114 (2025).
Lee, D. et al. Pneumococcal conjugate vaccine does not induce humoral response when administrated within the six months after CD19 CAR T-cell therapy. Transplant. Cell. Ther. 29, 277.e1–277.e9 (2023).
Bampoe, V. D. et al. Serologic immunity to tetanus in the United States, National Health and Nutrition Examination Survey, 2015-2016. Clin. Infect. Dis. 78, 470–475 (2024).
Hofmeister, M. G., Yin, S., Nelson, N. P., Weng, M. K. & Gupta, N. Trends and Opportunities: Hepatitis A Virus Infection, Seroprevalence, and Vaccination Coverage-United States, 1976-2020 Public Health Report, Washington, DC, 1974 https://doi.org/10.1177/00333549231184007 (2023).
Roberts, H. et al. Prevalence of HBV infection, vaccine-induced immunity, and susceptibility among at-risk populations: US households, 2013-2018. Hepatology 74, 2353–2365 (2021).
Mital, A. K. et al. Mapping anti-diphtheria toxin antibody: a systematic review and meta-analysis with multi-level meta-regression. Pathog. Glob. Health 119, 48–59 (2025).
Immunotherapy (IMTX): vaccination after B cell-targeted CAR T-cell therapy for adult and pediatric immunotherapy patients. https://www.fredhutch.org/en/research/long-term-follow-up/cellular-immunotherapy-ltfu/info-for-physicians.html (2023).
Zhang, Z. et al. Immunotherapy targeting B cells and long-lived plasma cells effectively eliminates pre-existing donor-specific allo-antibodies. Cell Rep. Med. 4, 101336 (2023).
Stock, S. et al. Prognostic significance of immune reconstitution following CD19 CAR T-cell therapy for relapsed/refractory B-cell lymphoma. HemaSphere 9, e70062 (2025).
Wang, Y. et al. Humoral immune reconstitution after anti-BCMA CAR T-cell therapy in relapsed/refractory multiple myeloma. Blood Adv. 5, 5290–5299 (2021).
Wang, D. et al. Viral infection/reactivation during long-term follow-up in multiple myeloma patients with anti-BCMA CAR therapy. Blood Cancer J. 11, 1–4 (2021).
Angelidakis, G. et al. Humoral immunity and antibody responses against diphtheria, tetanus, and pneumococcus after immune effector cell therapies: a prospective study. Vaccines 12, 1070 (2024).
Josyula, S. et al. Pathogen-specific humoral immunity and infections in B Cell maturation antigen-directed chimeric antigen receptor T cell therapy recipients with multiple myeloma. Transplant. Cell. Ther. 28, 304.e1–304.e9 (2022).
Xu, G. J. et al. Comprehensive serological profiling of human populations using a synthetic human virome. Science 348, aaa0698 (2015).
Wilck, M. et al. A Phase 3, randomized, double-blind, comparator-controlled study to evaluate safety, tolerability, and immunogenicity of V114, a 15-valent pneumococcal conjugate vaccine, in allogeneic hematopoietic cell transplant recipients (PNEU-STEM). Clin. Infect. Dis. 77, 1102–1110 (2023).
Bange, E. M. et al. CD8+ T cells contribute to survival in patients with COVID-19 and hematologic cancer. Nat. Med. 27, 1280–1289 (2021).
Zonozi, R. et al. T cell responses to SARS-CoV-2 infection and vaccination are elevated in B cell deficiency and reduce risk of severe COVID-19. Sci. Transl. Med. 15, eadh4529 (2023).
Koleba, T. & Ensom, M. H. H. Pharmacokinetics of intravenous immunoglobulin: a systematic review. Pharmacotherapy 26, 813–827 (2006).
LaFon, D., Kim, Y.-I., Burton, R., Dransfield, M. & Nahm, M. Pneumococcal antibody function for immunologic evaluation: normal results in older adults, and a novel analytical model for vaccine response. J. Clin. Immunol. 41, 1964–1968 (2021).
Burton, R. L. & Nahm, M. H. Development and validation of a fourfold multiplexed opsonization assay (MOPA4) for pneumococcal antibodies. Clin. Vaccine Immunol. 13, 1004–1009 (2006).
Mina, M. J. et al. Measles virus infection diminishes preexisting antibodies that offer protection from other pathogens. Science https://doi.org/10.1126/science.aay6485 (2019).
Galloway, J. G. et al. phippery: a software suite for PhIP-Seq data analysis. Bioinformatics 39, btad583 (2023).
Bursac, Z., Gauss, C. H., Williams, D. K. & Hosmer, D. W. Purposeful selection of variables in logistic regression. Source Code Biol. Med. 3, 17 (2008).
Muller, C. J. & MacLehose, R. F. Estimating predicted probabilities from logistic regression: different methods correspond to different target populations. Int. J. Epidemiol. 43, 962–970 (2014).
Huttenhower, C. et al. Structure, function and diversity of the healthy human microbiome. Nature 486, 207–214 (2012).
Hill, M. O. Diversity and evenness: a unifying notation and its consequences. Ecology 54, 427–432 (1973).
Pielou, E. C. The measurement of diversity in different types of biological collections. J. Theor. Biol. 13, 131–144 (1966).
Keylock, C. J. Simpson diversity and the Shannon–Wiener index as special cases of a generalized entropy. Oikos 109, 203–207 (2005).
Wei, L. J., Lin, D. Y. & Weissfeld, L. Regression analysis of multivariate incomplete failure time data by modeling marginal distributions. J. Am. Stat. Assoc. 84, 1065–1073 (1989).
Acknowledgements
The authors would like to acknowledge Mr. Rob Burton and Sunfire Biotechnologies for conducting and interpreting the S. pneumococcal multiplexed opsonophagocytosis assay testing. The authors thank Dr. Jeffrey Cohen (National Institute of Allergy and Infectious Diseases) for guidance on VZV antibody testing. Funding for this work was provided by the National Institutes of Health/National Cancer Institute (5U01CA247548 to J.A.H., NCI T32 CA009351 to S.O.). This research was supported by the Immune Monitoring Shared Resource, RRID:SCR_022615, of the Fred Hutch/University of Washington/Seattle Children’s Cancer Consortium (P30 CA015704). The authors would also like to acknowledge Jacob Keane-Candib, Joyce Maalouf, and Atif Bhatti for help with study implementation.
Author information
Authors and Affiliations
Contributions
J.A.H. conceptualized and oversaw the study. Participant recruitment, enrollment, sample processing, and testing were conducted by K.T., W.L., J.M., and C.C. Flow cytometry and analysis were conducted by S.P. and J.B. VirScan library preparation and analysis were performed by K.Y. and T.S.-A. Analysis, data visualization, and interpretation were performed by E.M.K., S.D., S.O., and J.A.H. Preparation of the paper, figures, tables, and supplementary figures was performed by S.O., E.M.K., S.D., and J.A.H. Additional facilitation of participant enrollment and intellectual input was provided by A.J.C., D.J.G., J.G., B.G.T., R.A.G., M.S., M.Bl., M.Bo., and C.J.T. Edits and revisions were provided by all authors.
Corresponding author
Ethics declarations
Competing interests
A.J.C. reports advising and consultancy for Sebia, Janssen Pharmaceuticals, BMS, Sanofi, HopeAI, Adaptive Biotechnologies, AbbVie, Kite/Arcellx, and research funding from Janssen Pharmaceuticals, BMS, Juno/Celgene, Sanofi, Regeneron, IGM BIosciences, Nektar, Harpoon, Caelum, Opna Bio, and Karyopharm. D.J.G. reports advising for Juno Therapeutics, Seattle Genetics, Janssen Pharmaceuticals, Bristol-Myers Squibb, GlaxoSmithKline, Ensoma, and Legend Biotech, and research funding from Juno Therapeutics, Seattle Genetics, Janssen Pharmaceuticals, Bristol-Myers Squibb, SpringWorks Therapeutics, Sanofi, AstraZeneca, and Cellectar Biosciences. J.G. reports consultancy for Bristol-Myers Squibbs, Sobi, Legend Biotech, Janssen, Kite Pharma, MorphoSys, and research funding from Sobi, Juno Therapeutics, Celgene, Angiocrine Bioscience, Faron Pharmaceuticals, CARGO Therapeutics, and CytoAgents. B.G.T. reports consultancy for Proteios Technology and research funding from Mustang Bio and BMS/Celgene. R.A.G. reports royalties from BMS related to patents in the CAR-T cell field. C.J.T. reports advising for Caribou Biosciences, T-CURX, Myeloid Therapeutics, ArsenalBio, Cargo Therapeutics, Celgene/BMS Cell Therapy, Differentia Bio, eGlint, IQVIA, research funding from Juno Therapeutics/BMS, Nektar Therapeutics, 10X Genomics, Genscript, Kite/Gilead, Umoja Biopharma, and consultancy for Prescient Therapeutics, Century Therapeutics, Boxer Capital, Novartis, Merck Sharp and Dohme, and AbbVie. J.A.H. reports consultancy for Moderna, Allovir, Gilead, Takeda, CSL Behring, Karius, Geovax, and Sanofi, and research funding from Gilead, Takeda, Merck, Geovax, and Sanofi. All others deny any competing interests.
Peer review
Peer review information
Nature Communications thanks Sigrun Einarsdottir and the other, anonymous, reviewer(s) for their contribution to the peer review of this work. A peer review file is available.
Additional information
Publisher’s note Springer Nature remains neutral with regard to jurisdictional claims in published maps and institutional affiliations.
Source data
Rights and permissions
Open Access This article is licensed under a Creative Commons Attribution-NonCommercial-NoDerivatives 4.0 International License, which permits any non-commercial use, sharing, distribution and reproduction in any medium or format, as long as you give appropriate credit to the original author(s) and the source, provide a link to the Creative Commons licence, and indicate if you modified the licensed material. You do not have permission under this licence to share adapted material derived from this article or parts of it. The images or other third party material in this article are included in the article’s Creative Commons licence, unless indicated otherwise in a credit line to the material. If material is not included in the article’s Creative Commons licence and your intended use is not permitted by statutory regulation or exceeds the permitted use, you will need to obtain permission directly from the copyright holder. To view a copy of this licence, visit http://creativecommons.org/licenses/by-nc-nd/4.0/.
About this article

Cite this article
Ozog, S., Krantz, E.M., Tindbaek, K. et al. Influence of B cell-lineage targeted CAR-T cell therapy on humoral immunity and vaccine-induced antibody response. Nat Commun 17, 4924 (2026). https://doi.org/10.1038/s41467-026-71473-1
Received:
Accepted:
Published:
Version of record:
DOI: https://doi.org/10.1038/s41467-026-71473-1
