
Abstract
Optimizing several properties simultaneously based on small data-driven machine learning in complex black-box scenarios can present difficulties and challenges. Here we employ a triple-objective optimization algorithm deduced from probability density functions of multivariate Gaussian distributions to optimize the γ′ volume fraction, size, and morphology in CoNiAlCr-based superalloys. The effectiveness of the algorithm is demonstrated by synthesizing alloys with desired γ/γ′ microstructure and optimizing γ′ microstructural parameters. In addition, the method leads to incorporating refractory elements to improve γ/γ′ microstructure in superalloys. After four iterations of experiments guided by the algorithm, we synthesize sixteen alloys of relatively high creep strength from ~120,000 candidates of which three possess high γ′ volume fraction (>54%), small γ′ size (<480 nm), and high cuboidal γ′ fraction (>77%).
Introduction
Data-driven machine learning (ML) techniques have been used to accelerate the discovery of materials in science and engineering beyond trial and error1,2,3,4. Many of these studies have shown how the search for materials with promising properties can be guided in a large space of possible candidates5,6. Bayesian optimization algorithms using Gaussian processes, with and without evolutionary algorithms, have been widely employed to search for optimal properties. This typically constructs surrogate models from data with a utility or acquisition function to rank recommendations for calculation or experiment within an active learning loop. The acquisition functions are typically based on predictions of the objectives and their uncertainties, and include probability of improvement, expected improvement, and confidence interval strategies7. The method has a long history, has been utilized in industry and in the engineering sciences, and is well suited for small data sets for which targeted properties are often found with dramatically low costs. It has been applied to a range of materials problems, including finding NiTi-based shape memory alloys with very small thermal hysteresis8, piezoelectrics with large electrostrains9, high-entropy alloys with high hardness10, and low-density Co-based superalloys with a high γ′ solvus temperature11. In these cases, compositions with better properties than available in the training data are found within a few active learning loops with experiments. As algorithms largely determine the efficiency of the search, especially in dealing with small amounts of materials data, progress in advancing algorithmic development is a key.
For optimizing multiple properties, methods that screen out compounds outside the regime of interest based on single objective predictions, probabilistic maximization of target-fulfillment likelihood as well as multiobjective optimization methods that successively improve the Pareto front, are typically used. The screening method is effective only if adequate materials data exists so that prediction uncertainties can be reduced substantially and the materials with expected property can be directly distilled one by one based on predicted values of the single objective ML models11,12,13. However, such screening is often not effective in obtaining the Pareto front when the materials data is limited7. Probabilistic manner14 and multiobjective optimization with two or more objectives using acquisition functions such as expected hypervolume improvement15, Maximin and Centroid design strategies16 and MOEI17 has been employed for materials discovery, certainly for two objectives. However, few studies consider applications with several objectives.
The focus of this work is to optimize three objectives related to the γ/γ′ microstructure of superalloys18,19,20,21. Specific, γ/γ′ microstructural characteristics, e.g. high γ′ volume fraction, small γ′ size, and cuboidal γ′ shape, etc. have been shown to be necessary for the remarkable mechanical properties in superalloys22,23,24. These are preferred in commercial Ni-based single crystal (SX) superalloys where for targeted γ/γ′ microstructures are highly desirable19,25,26. Murakumo et al.22 have reported the relationship between the γ′ volume fractions and creep behavior in a 3rd Ni-based SX superalloy TMS-75. Alloys with a high γ′ volume fraction tend to have longer rupture life times, and the longest rupture life has been obtained for a γ′ volume fraction of ~60%. Nathal et al.23 explored the creep resistance as a function of initial γ′ size, and found that alloys with smaller γ′ sizes tend to have longer rupture lives and lower creep rates. Sluytman et al.24 compared the creep rupture life of alloys with different γ′ morphologies, and showed that those with cuboidal γ′ had a longer life. Almost all SX superalloys in service, including AM1, CMSX-4, and CMSX-1027,28,29,30 contain a high γ′ volume fraction, small γ′ size, and cuboidal γ′ shape. Hence, even though the desired γ/γ′ microstructure of superalloys is well established in industry, the simultaneous optimization of γ/γ′ microstructure with multiple microstructural parameters has been an ongoing challenge in the superalloy field for the last 40 years4,19,31. Changing the composition in favor of one property typically offsets one or more other properties. What is required is to simultaneously optimize multiple microstructural properties, in particular, three properties in these alloys based on small amounts of materials data.
In this study, we propose the use of triple-objective optimization that includes ML surrogate models developed on small data sets to simultaneously optimize the γ′ volume fraction, γ′ size, and γ′ shape in CoNiAlCr-based superalloys. The active learning workflow for this study is shown in Fig. 1a. To ensure the newly synthesized alloys have the potential for applications, we applied screening (sequential filters)11 to remove alloys with undesired properties (γ′ solvus temperature, processing window, freezing range, density, detrimental phases, and oxidation resistance) by constraining the search space and ML predictions. As for the major microstructural parameters including γ′ volume fraction, γ′ size, and γ′ morphology, we use a multivariate Gaussian to optimize to obtain newly synthesized alloys with high γ′ volume fraction, small γ′ size, and high cuboidal γ′ fraction (the cuboidal γ′ fraction is the ratio of the cuboidal γ′ area to the total γ′ area21) during aging at 1100 °C (Considering the service temperature requirements of blades in aero engines and experimental cost about aging time, the selected heat treatment schedule is 1100 °C for 168 h). After four iterations with experiments guided by the algorithm, we synthesized sixteen alloys from ~120,000 potential compositions of which three possessed high γ′ volume fraction (>54%), small γ′ size (<480 nm) and high cuboidal γ′ fraction (>77%) after aging at 1100 °C for 168 h. Moreover, the alloys also have high γ′ solvus temperatures (>1190 °C), appropriate processing windows (>100 °C), and freezing ranges (<60 °C), low densities (<8.9 g cm−3), desired γ/γ′ stability devoid of detrimental phase precipitation, and good oxidation resistance at 1100 °C. The effectiveness of the algorithm is demonstrated by synthesizing alloys with desired γ/γ′ microstructure and optimizing γ′ microstructural parameters. In addition, this leads to higher compositions of refractory elements to improve γ/γ′ microstructure in synthesized alloys. The synthesized CoNiAlCr-based superalloys possess multiple desirable material properties for high-temperature applications. Thus, the method shows promise for optimizing the properties of other materials.

a The iterative workflow includes multi-property screening, triple-objective optimization, and experimental feedback (this image does not contain any third party material). b The performance of the ML regressor (γ′ solvus temperature, solidus, liquidus, density, γ′ volume fraction, γ′ size, and cuboidal γ′ fraction) and classifier (precipitate of detrimental phases) used for predicting corresponding property in testing data. c Illustration of triple-objective optimization algorithm. The equiprobability distribution with the maximum confidence interval (95%) of a three-dimensional Gaussian probability density function. The 1/8 ellipsoid surface is discretized (yellow points). The weight function varies with the three target values (y1, y2, and y3) in the range (0, 100). The right mapping axis is the weight function value of the corresponding target values.
Results
Iterative workflow
The workflow of the optimization is shown in Fig. 1a. It includes constraining the search space and screening predictions from ML models trained on a relatively large data set that includes properties of interest in industry (γ′ solvus temperature, processing window, freezing range, density, detrimental phases, and oxidation resistance). The ML models trained on small data sets are combined with a triple-objective optimization algorithm to recommend materials with desired γ/γ′ microstructure (γ′ volume fraction, γ′ size, and cuboidal γ′ fraction). We synthesized four materials samples in each iteration and characterized their microstructure. The acquired experimental data augments the training data in the iterative workflow until the synthesized γ/γ′ microstructure of the alloys cannot be further improved.
Materials data, search space, and machine learning models
We apply materials design and γ′ microstructural optimization to the Co-Ni-Al-Ti-W-Ta-Mo-Nb-Cr-Re alloy system. The data was assembled from the literature (data sources see Supplementary information) and includes results of our experiments (these data are also collected in the materials genome engineering database https://www.mgedata.cn). We have 258, 185, 145, 171, 31, 31, and 31 experimental data for γ′ solvus temperature (Tγ′-solvus, °C), solidus temperature (Tsolidus, °C), liquidus temperature (Tliquidus, °C), density (ρ, g cm−3), γ′ volume fraction (Vγ′, %), γ′ size (rγ′, nm) and cuboidal γ′ fraction (Cγ′, %), respectively, and 1400 thermodynamic computational data are produced from Pandat software for the detrimental precipitate formation during aging at 1100 °C (precipitate classification, PC). The labels “0” and “1” denote absence or presence of detrimental precipitates during aging. As for γ′ size, the optimization direction tends to minimize it, in contrast to the maximization of the other two objectives (Vγ′ and Cγ′). For convenience, we transform the actual target γ′ size to Rγ′ = (1500-rγ′)/15 (unit, %), so that Vγ′, Rγ′ and Cγ′ values are expected to be higher. For the multi-component Co-based superalloys with γ′ solvus temperature <1100 °C, γ′ precipitates cannot exist during aging at 1100 °C. We uniformly process these “failed” data to reduce unnecessary iterative searches. We stipulate that for Co-based alloys with γ′ solvus temperature lower than 1100 °C, Vγ′, Rγ′, and Cγ′ are 0. For the alloy with network-like γ′ precipitates, both Rγ′ and Cγ′ are defined as 0. The potential compositional space of undiscovered aCo-bNi-cAl-dTi-eW-fTa-gMo-hNb-iCr-jRe superalloys is given by 40 ≤ a ≤ 60, b = 30, 10.5 ≤ c ≤ 12.5, 0 ≤ d ≤ 3, 0 ≤ e ≤ 3, 2 ≤ f ≤ 4, 0 ≤ g ≤ 3.5, 0 ≤ h ≤ 1, i = 5, 0 ≤ j ≤ 1.5 at.%, and with a step size of 0.5 at.%, there are 122,406 possible candidate alloys. A higher composition of Al and Cr is necessary to form a continuous alumina layer32,33, and a large amount of Ni is beneficial to expand the γ/γ′ two-phase region, thus providing phase stability without the precipitation of detrimental phases34.
The ML surrogate models used to establish the relationship7,35,36 between alloy composition and property are shown in Fig. 1b. The input to the ML surrogate models is the alloy composition (Co, Ni, Al, Ti, W, Ta, Mo, Nb, Cr and Re in at.%), and the output includes the material properties (for detailed training processes see “Methods” section, and specific evaluation metrics are collected in Supplementary information). The ML model with the least mean squared error is employed as the surrogate model. The selected regressors for Tγ′-solvus, Tsolidus, Tliquidus, ρ, Vγ′, Rγ′, and Cγ′ were found to be the support vector regressor, gradient boosting tree, random forest, linear, Adaboost, gradient boosting tree and random forest, respectively. The best classifier for precipitate classification is the support vector classifier. We used sequential filters to constrain the other properties (Tγ′-solvus ≥ 1200 °C, processing window = Tsolidus−Tγ′-solvus ≥ 70 °C, freezing range = Tliquidus−Tsolidus ≤ 60 °C, ρ ≤ 8.85 g cm-3, the alloy can form continuous alumina on the surface and precipitate no detrimental phases during aging at 1100 °C) based on ML predictions and defined search space.
Design of triple-objective optimization
In this section, we introduce the algorithm design, iterative efficiency testing, and practical application of the method in optimizing superalloys microstructure in sequence. We use bootstrap sampling to obtain training data sets to build 1000 ML surrogate models to predict alloys with Vγ′, Rγ′, and Cγ′. We assume the distribution of Vγ′, Rγ′, and Cγ′ for each alloy obeys a three-variable Gaussian distribution with covariance zero. ML predictions of the three properties for each alloy are made in this high-dimensional geometric space. The probability density function of the three-variable Gaussian distribution is
where \({y}_{1},{y}_{2}\,{{\rm{and}}\,{y}}_{3}\) are the possible Vγ′, Rγ′ and Cγ′ of the corresponding alloy in the search space, \({u}_{1},{u}_{2}\,{{\rm{and}}\,{u}}_{3}\) are the mean values of 1000 predicted Vγ′, Rγ′ and Cγ′ of the corresponding alloy, \({\sigma }_{1},{\sigma }_{2}\) and \({\sigma }_{3}\) are the standard deviations of the 1000 predicted Vγ′, Rγ′ and Cγ′. The equiprobability distribution with the maximum confidence interval (95%) of a three-variable Gaussian probability density function is an ellipsoid surface. The target values \({y}_{1},{y}_{2}\,{{\rm{and}}\,{y}}_{3}\) need to be determined based on the ellipsoid surface
The optimization direction of the three objectives with higher values occupies 1/8 of the ellipsoid surface (Fig. 1c), and these points can be obtained by discretizing the ellipsoid surface. In order to make the value of the three targeted properties all high along a desired specific optimization direction, it is necessary to adopt the weight function to recommend the desired candidates (especially candidates with high target values along the diagonal direction in Fig. 1c will be recommended for validation). The employed weight function (the form of the weight function is not unique, depending on the user’s optimization needs) is
where \({k}_{1},{k}_{2}\,{{\rm{and}}\,{k}}_{3}\) are the weight coefficients, which are used to adjust the specific optimization direction with the desired demands. The \({k}_{1},{k}_{2}\,{\rm{and}}\,{k}_{3}\) are all set to 1 in this study (Fig. 1c). We calculate the weight function value of each point on the ellipsoid surface one by one, and take the largest to represent the solution for the corresponding alloy. The candidate alloy with the highest weight function value is recommended for synthesis and characterization. Equations 2–4 provide the acquisition function combination using the mean and uncertainty on the Gaussian ellipsoid to give the three objectives for each alloy. The weight function is responsible for controlling the specific optimization direction in recommending the best candidate. This algorithm is derived from the equiprobability distribution with maximum confidence interval (ED-MCI) in the multivariate Gaussian probability density function.
To verify the high efficiency of the ED-MCI in multiobjective optimization problems, we performed two computational tests. The common test functions in optimization problems are used to generate data, and a small amount of data is taken as training data. The new data points are fed back through the recommendation of acquisition functions until the optimum with multiple high-targeted values is found (the optimum is defined according to the weight function). In the two multiobjective optimization tests, ED-MCI has the highest iteration efficiency, and only a few unlabeled sample points are needed to find the global optimum. It is more efficient than acquisition functions such as maximum predicted values37 and MOPA38 (details of these computational tests are provided in Supplementary information). Therefore, the effective ED-MCI is used to optimize several γ′ microstructural parameters in CoNiAlCr-based superalloys.
Based on bootstrap sampling, ML predictions, and algorithm recommendations, four alloys with the highest weight function values are recommended in each iteration for synthesis, and the experimental characterization gives the γ′ microstructural parameters. If the alloys with experimental γ′ microstructural parameters do not meet the desired properties (after aging at 1100 °C for 168 h, the desired γ′ microstructural parameters are Vγ′ ≥ 55%, Rγ′ ≥ 55% (namely rγ′ ≤ 675 nm), and Cγ′ ≥ 55%), the synthesized alloy data augment the training data and the next iteration is executed until the γ/γ′ microstructure of the alloys does not significantly change.
Synthesized alloys with multiple desired properties
We perform the iterative workflow four times, and the synthesized alloys have been collected in Table 1. In this ten-element alloy system, we consider nine materials properties, three of which involve the optimized γ/γ′ microstructural parameters (Vγ′, Rγ′ and Cγ′). The other six properties (Tγ′-solvus, processing window, freezing range, ρ, PC, and oxidation resistance) are screened by constraining the search space and ML predictions. The γ/γ′ microstructure images of these alloys are shown in Fig. 2a. Alloys MGE 1-1, MGE 1-2, and MGE 4-4 have higher Vγ′, Rγ′ and Cγ′ simultaneously during aging at 1100 °C for 168 h, and are also superior to the reported Co-based superalloys in the training set and high-generation Ni-based SX superalloys39,40. Other alloys such as MGE 2-1 and MGE 3-4, etc are close to MGE 1-2, and they possess relatively inferior γ/γ′ microstructures. In addition, certain alloys such as MGE 1-3, MGE 2-3, MGE 3-2, and MGE 4-1 belong to other regions of composition space with higher Mo and Nb content. These alloys have higher alloying content and lower solidus temperatures, which yield larger freezing ranges and narrower processing windows. A high fraction of secondary phases formed after solid solution treatment cannot be completely removed, suggesting their stability extends to the solidus temperature, and the distribution of the alloying elements in the alloy is not uniform. Therefore, we do not collect further statistics of γ/γ′ microstructures (the SEM and EDS images of microstructure after solution treatment are collected in Supplementary Fig. 7).

a γ/γ′ microstructure during aging at 1100 °C for 168 h. b Typical DSC curves of alloys MGE 1-2, MGE 2-1, and MGE 3-1 for determining the γ′ solvus, solidus, and liquidus temperatures. c Typical oxidation microstructure and elemental distribution (O and Al) of synthesized alloy MGE 1-1 after isothermal oxidation at 1100 °C for 100 h. Scale bars: 5 μm (a), 10 μm (c).
As for the other six properties (Tγ′-solvus, processing window, freezing range, ρ, PC, and oxidation resistance), alloys MGE 1-1, MGE 1-2, and MGE 4-4 essentially meet the expected requirements. They all have high γ′ solvus temperatures (Fig. 2b) without precipitating detrimental phases, low density, great oxidation resistance, and a proper processing window and freezing range. In particular, their oxidation layers are thinner than advanced 3rd–5th Ni-based SX superalloys TMS-75, TMS-138A, and TMS-173, and comparable to the 6th superalloy TMS-23825,41. As shown in Fig. 2c, a continuous and dense alumina layer forms at 1100 °C, indicating great oxidation resistance.
Discussion
We consider four aspects: (1) The synthesized alloys have desired γ/γ′ microstructure, (2) γ′ microstructural parameters, (3) degree of optimization, and (4) the degree to which higher compositions of refractory elements are involved. We address each of these in turn.
-
(1)
Of the nine synthesized alloys after complete homogenization, five alloys have γ/γ′ microstructural parameters that are not dominated by Pareto front points in the training data (Fig. 3a), and the three γ/γ′ microstructural parameters yield desired results along the expected optimization direction. Based on the γ/γ′ microstructural parameters of the synthesized alloys, MGE 1-1, MGE 1-2, and MGE 4-4 show superior properties to previously reported alloys (Fig. 3b). Based on the observed trend of alloying elements in subsequent iterations (Fig. 3c), the compositions of certain elements (e.g. Ta, W, Nb, Re, and Al) do not change significantly. The compositions of other elements (Mo and Ti) fluctuate slightly. This suggests that alloy compositions do not change significantly in later iterations. In addition, some alloys with inferior γ/γ′ microstructural parameters are also recommended, and they are located in the proximity of alloys MGE 1-1 and MGE 1-2. This means the candidates that remained in the current search space have a low potential to obtain desired γ/γ′ microstructure. However, this does not mean that CoNiAlCr-based superalloys have insufficient potential to possess desired γ/γ′ microstructures at 1100 °C. If we change the composition step interval from 0.5 at.% to 0.2 at.%, there are over 23 million candidates, which is about 190 times greater than the current space (122,406). A larger search space can potentially lead to higher-performance candidates, however precise control of alloy composition is challenging during melting, especially in the presence of volatile elements such as Al. In Fig. 3d, we calculate the configurational entropy of these alloys using the nominal composition, \(\Delta S=-R{\sum }_{i=1}^{n}{c}_{i}\mathrm{ln}{c}_{i}\), where R is the universal gas constant, \({c}_{i}\) is the composition of each element i. Most synthesized alloys fall into the medium-entropy range. Only two alloys are in the high-entropy region. However, these high-entropy alloys are not desired as they contain more alloying elements resulting in secondary phases that are difficult to homogenize completely (Supplementary Fig. 7). Most of the medium-entropy alloys such as alloys MGE 1-1, MGE 1-2, and MGE 4-4, etc. have less alloying elements as they can be then completely dissolved. Therefore, our algorithm has the ability to recommend advanced materials with multiple balanced properties.
Fig. 3: Evaluation of the synthesized alloys. 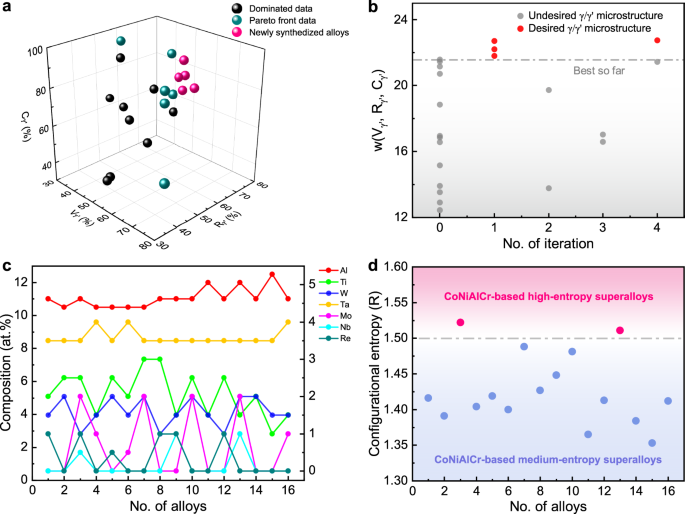
a The γ/γ′ microstructural parameters (Vγ′, Rγ′ and Cγ′) of the newly synthesized 5 alloys are not dominated by the Pareto front consisting of training data. b w(Vγ′, Rγ′, Cγ′) is calculated based on the experimental γ/γ′ microstructural parameters of each alloy using weight function, and the training data is at iteration 0. c Variation of nominal composition of alloying elements in the synthesized alloys. The left ordinate axis represents the composition of element Al, and the right ordinate axis shows the composition of elements Ti, W, Ta, Mo, Nb, and Re. d Configurational entropy for the synthesized alloys.
-
(2)
One of the challenges in developing reliable multiobjective optimization is to simultaneously improve multiple properties. Here we compare the predicted properties before and after experimental feedback for certain alloys located near the Co-30Ni-5Cr-3.5Ta-0Nb-(10.5-11)Al-(0-3)Ti-(0-2)W-(0-2)Mo-(0-1)Re region in composition. As shown in Fig. 4a, the three targeted properties (Vγ′, Rγ′, and Cγ′) predicted by the ML models are generally low, and the deviation (uncertainty) of each property is large without experimental feedback. After the first iteration (Fig. 4b), the three properties predicted by the models improve to varying degrees, with the deviation of each property also reduced. After two iterations (Fig. 4c), the model predictions no longer change significantly. After four iterations, the MSE for Vγ′, Rγ′, and Cγ′ on the testing data decreased by 17.2%, 8.3%, and 16.6% compared to the ML models without any feedback, respectively. This indicates that multiple γ′ microstructural parameters have been optimized simultaneously to different degrees.
Fig. 4: Simultaneous optimization for three targeted properties based on experimental feedback and ML predictions. 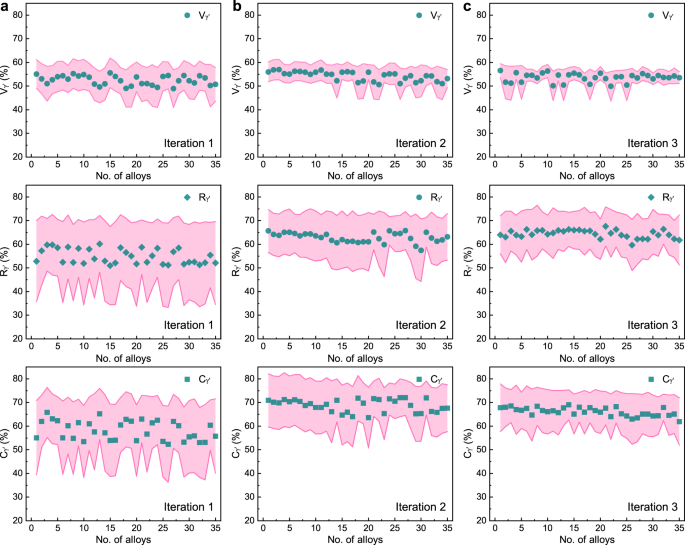
The 35 candidate alloys are located in the Co-30Ni-5Cr-3.5Ta-0Nb-(10.5-11)Al-(0-3)Ti-(0-2)W-(0-2)Mo-(0-1)Re region. The pink shadows represent the corresponding standard deviation. a The ML model predictions of targeted properties (Vγ′, Rγ′, and Cγ′) of 35 candidates without experimental feedback. b ML predictions after one iteration with experimental feedback. c ML predictions after two iterations.
-
(3)
We compare the maxima distribution of weight function (w*, calculated based on ML predictions) before and after experimental feedback for certain alloys located around the (Mo+Nb)-rich and (Mo+Nb)-poor regions. As shown in Fig. 5a, b, the preferred candidates (MGE 1-1 and MGE 2-1) do not contain Mo or Nb elements without experimental feedback. After two iterations, the recommended alloys (such as MGE 3-1) begin to move toward another region containing higher Nb element (Fig. 5c), which suggests that the algorithm gradually tries to find other local optimal regions that might have superior targeted properties. This trend becomes more pronounced after three iterations (Fig. 5d). Finally, the recommended candidate contains higher Mo and Nb compositions (MGE 4-1) compared to other synthesized alloys (MGE 4-2 and MGE 4-3). One of the reasons that the algorithm often recommends alloys with high Mo and Nb content is that the uncertainties in predictions for the alloys in this local region are very high (see Supplementary information for the predictions of synthesized alloys’ targeted properties). In addition, in terms of the effect of alloying elements on the γ/γ′ microstructure, Mo can substitute for W and Re to maintain a small γ′ size, and Nb can replace Ti to maintain a high γ′ volume fraction21. In four iterations of experiments, the secondary phases of alloys such as MGE 1-3, MGE 2-3, MGE 3-2, and MGE 4-1 cannot be completely removed during homogenization heat treatment. Elevated levels of elements such as Al, Ti, Ta, W, and Mo, etc in these secondary phases lead to large consumption of alloying elements in the formation of the γ/γ′ phases (Supplementary Fig. 7), which often yields inferior microstructure.
Fig. 5: The behavior of three targeted properties based on experimental feedback. 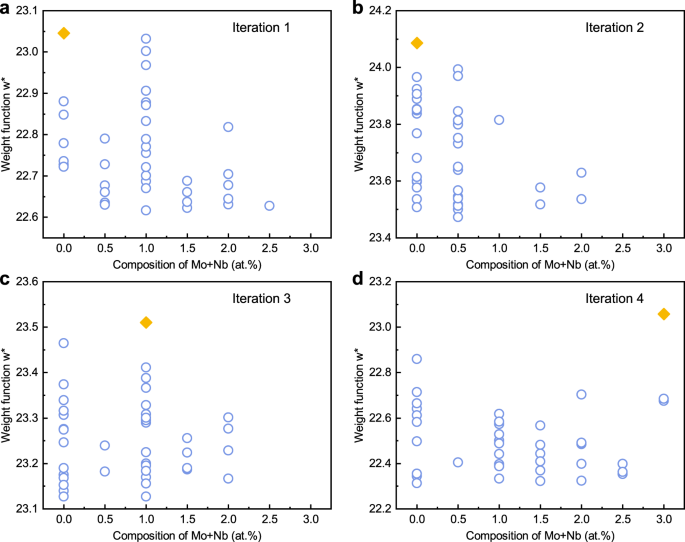
The value of the weight function w*(Vγ′, Rγ′, Cγ′) is calculated based on ML predictions, and the top 40 alloys with high w* in each iteration’s initial predictions are used for comparison. The orange diamond points represent the preferred candidates. a Recommendation of candidate alloys with high w* without experimental feedback. b Recommendation of candidate alloys after one iteration. c Recommendation after two iterations. d Recommendation after three iterations.
-
(4)
The synthesized alloys exhibit desired γ/γ′ microstructures, which are often attributed to intrinsic strengthening mechanisms among elements. The alloys show strengthening from the high content of refractory elements (alloying elements with melting points higher than 2000 °C, including W, Re, Ta, Mo, Nb, and Ru, etc) on the γ/γ′ microstructures. As shown in Fig. 6a, the compositions of refractory elements in the Ni-based SX superalloys show an upward trend with temperature capability. In this strengthening, refractory elements simultaneously adjust the γ′ volume fraction, γ′ size, and γ′ morphology to indirectly improve the mechanical properties. This cannot be achieved just by combinations of other elements (e.g. Al, Ti, Cr, and Ni, etc). In Fig. 6b, the synthesized alloys also have a higher content of refractory elements than previously reported multi-component Co-based superalloys, which suggests that mechanical properties, such as creep resistance, may be higher. All the other synthesized alloys with lower compositions of refractory elements yield inferior γ/γ′ microstructure, which does not help with mechanical properties.


To evaluate the creep resistance, we calculate the creep merit index of multi-component superalloys using the Arrhenius equation and the Reed et al. model42,
where \({D}_{{eff},m}\), \({D}_{0}^{{eff},m}\), \({Q}_{{eff},m}\) and \({x}_{m}\) are the diffusion coefficient, pre-exponential coefficient, activation energy, and atomic fraction of the element m, respectively. \({D}_{{eff}}\) and \({M}_{{creep}}\) are effective diffusion coefficient and creep merit index. According to the Arrhenius equation, we use the pre-exponential coefficients and activation energies of elements listed in Supplementary Table 7 to calculate the diffusion coefficient of each element. Then, we derive the effective diffusion coefficients and creep merit indexes of these alloys based on composition-weighted elements’ diffusion coefficient and Reed’s model. Figure 7a shows Deff and Mcreep for a number of Ni-based SX superalloys43,44 and CoNiAlCr-based superalloys at 1100 °C. The creep resistance is improved with decreasing Deff, and high-generation Ni-based SX superalloys have higher Mcreep. The lower the effective diffusion coefficients, the better the creep resistance. The Mcreep of alloys MGE 1-1 and MGE 4-4 is also higher than the 4th Ni-based SX superalloys, which suggests the creep resistance may be higher. As shown in Fig. 7b, c, stable γ/γ′ microstructure appears in alloys MGE 1-1 and MGE 4-4 without γ′ rafting after aging at 1100 °C for 500 h, which is a sign of good creep resistance.

a Creep merit index of 1st to 4th Ni-based SX superalloys, MGE 1-1 and MGE 4-4 alloys. b, c Stable γ/γ′ microstructure of alloys MGE 1-1 and MGE 4-4 without obvious rafting after aging at 1100 °C for 500 h. Scale bars: 3 μm (b, c).
In summary, we have proposed a triple-objective optimization algorithm that has been applied to the optimization of γ/γ′ microstructure in CoNiAlCr-based superalloys based on a relatively small amount of materials data. Utilizing this algorithm, we have synthesized compositions with multiple desired properties, i.e. alloys MGE 1-1, MGE 1-2, and MGE 4-4, which simultaneously possess high γ′ volume fraction (>54%), small γ′ size (<480 nm) and high cuboidal γ′ fraction (>77%) after aging at 1100 °C for 168 h. They also exhibit a high γ′ solvus temperature (>1190 °C), proper processing window (>100 °C) and freezing range (<60 °C), low density (<8.9 g cm−3), desired γ/γ′ stability without precipitating detrimental phases and good oxidation resistance at 1100 °C. The CoNiAlCr-based superalloys with targeted multiple properties are desired for high-temperature materials of the future. The algorithm is effective in finding alloys with superior γ/γ′ microstructure and γ′ microstructural parameters. It also leads to intrinsic strengthening due to the higher compositions of refractory elements that improve γ/γ′ microstructure towards higher γ′ volume fraction, small γ′ size, and cuboidal γ′. It also indirectly improves the creep resistance.
Methods
Synthesis and characterization
We utilized pure metals (>99.95%) to synthesize these candidate alloys. They were melted eight times using vacuum arc melting to yield a 40 g ingot. To ensure the homogeneity of the composition of the alloys, the ingots were sealed in a quartz tube filled with argon, and solution heat treated at 1225 °C for 24 h followed by air cooling (standard solid solution). The γ′ solvus, solidus and liquidus were detected by DTA (NETZSCH STA 449F3), and the samples (aged at 1050 °C for 24 h) with a size of φ3mm × 1 mm were tested at a heating rate of 10 °C min−1. The density of each alloy was measured five times by Archimedes displacement principle and the average value was taken.
To validate the γ/γ′ microstructure of the alloys, long-term aging was monitored at 1100 °C for 168 h and 500 h. All metallographic samples were etched for a few seconds using a solution of HNO3 : HCl : H2O = 1 : 1 : 1. The γ/γ′ microstructures were observed using a Zeiss GeminiSEM 300 field-emission scanning electron microscope (SEM) in backscattered electron imaging mode, and alloy composition was measured with an equipped energy-dispersive X-ray spectroscopy detector (EDS). Five images of different regions in each sample were used to represent its microstructure under the corresponding aging conditions. The value of γ′ volume fraction, γ′ size and cuboidal γ′ fraction were quantified by the computer vision framework proposed in our previous work21 (For alloys that cannot be fully homogenized after standard solid solution, the γ/γ′ microstructural parameters were not be used for analysis).
Isothermal oxidation experiments were carried out at 1100 °C for 100 h. The weight of the sample and crucible was measured by an electronic balance with sensitivity down to 10−5 g. The crucible was pre-fired at 1150 °C until the weight change was <2 × 10⁻⁴ g, and then considered to be constant weight. The oxidized samples were Ni-plated to preserve oxidation layers. The oxide microstructure was characterized with the SEM in backscattered electron imaging mode, and EDS was used to detect the elemental distribution to the oxides.
Machine learning models
The experimental data of Tγ′-solvus, Tsolidus, Tliquidus, ρ, Vγ′, Rγ′, and Cγ′ are utilized for ML regression models, and computational data are used for ML classification models. The linear regression (LR), decision tree regression (DTR), k-nearest neighbors regression (KNR), support vector regression with a kernel of radial basis function (SVR), Adaboost regression (ABR), random forests regression (RFR), and gradient boosting tree regression (GBTR) are used and compared to select an optimal regressor for each material property. The logistic regression classification (LC), decision tree classification (DTC), k-nearest neighbors classification (KNC), support vector classification with a kernel of radial basis function (SVC), Adaboost classification (ABC), random forests classification (RFC), and gradient boosting tree classification (GBTC) are used and compared to select an optimal classifier for predicting the precipitate of detrimental phases. The data was split into a training set (80%) and testing set (20%) randomly. Each model was trained 1000 times by ten-fold cross-validation with the data chosen randomly, and the mean value of the mean square error on the testing set - \({MSE}=\frac{1}{n}{\sum }_{i=1}^{n}{({y}_{i}-\hat{{y}_{i}})}^{2}\), where \({y}_{i}\) is the experimental value and \(\hat{{y}_{i}}\) is the predicted value - is evaluated as a measure of the regression fitting. The smaller the MSE of the regressor on the testing set, the better the regression prediction. The best regressor for Tγ′-solvus, Tsolidus, Tliquidus, ρ, Vγ′, Rγ′, and Cγ′ is SVR, GBTR, RFR, LR, ABR, GBTR, and RFR, respectively. The mean value of the accuracy on the testing set is used as a measure of the classification fitting and also monitored by AUC11. The larger the accuracy/AUC of the classifier on the testing set, the better the classification prediction. The best classifier for precipitate classification is SVC (The evaluation metrics of these ML models see Supplementary information).
Data availability
The data that support the findings of this study are available from the corresponding author upon reasonable request.
Code availability
The codes that support the findings of this study are available from the corresponding author upon reasonable request.
References
Raccuglia, P. et al. Machine-learning-assisted materials discovery using failed experiments. Nature 533, 73–77 (2016).
Butler, K. T., Davies, D. W., Cartwright, H., Isayev, O. & Walsh, A. Machine learning for molecular and materials science. Nature 559, 547–555 (2018).
Burger, B. et al. A mobile robotic chemist. Nature 583, 237–241 (2020).
Hart, G. L. W., Mueller, T., Toher, C. & Curtarolo, S. Machine learning for alloys. Nat. Rev. Mater. 6, 730–755 (2021).
Xue, D. et al. Accelerated search for BaTiO3-based piezoelectrics with vertical morphotropic phase boundary using Bayesian learning. Proc. Natl Acad. Sci. USA 113, 13301–13306 (2016).
Ramprasad, R., Batra, R., Pilania, G., Mannodi-Kanakkithodi, A. & Kim, C. Machine learning in materials informatics: recent applications and prospects. NPJ Comput. Mater. 3, 54 (2017).
Lookman, T., Balachandran, P. V., Xue, D. & Yuan, R. Active learning in materials science with emphasis on adaptive sampling using uncertainties for targeted design. NPJ Comput. Mater. 5, 21 (2019).
Xue, D. et al. Accelerated search for materials with targeted properties by adaptive design. Nat. Commun. 7, 11241 (2016).
Yuan, R. et al. Accelerated discovery of large electrostrains in BaTiO3-based piezoelectrics using active learning. Adv. Mater. 30, 1702884 (2018).
Wen, C. et al. Machine learning assisted design of high entropy alloys with desired property. Acta Mater. 170, 109–117 (2019).
Liu, P. et al. Machine learning assisted design of γ′-strengthened Co-base superalloys with multi-performance optimization. NPJ Comput. Mater. 6, 62 (2020).
Zou, M., Li, W., Li, L., Zhao, J. & Feng, Q. Machine learning assisted design approach for developing γ'-strengthened Co-Ni-base superalloys. Superalloys 2020, 937–947 (2020).
Wang, C., Fu, H., Jiang, L., Xue, D. & Xie, J. A property-oriented design strategy for high performance copper alloys via machine learning. NPJ Comput. Mater. 5, 87 (2019).
Conduit, B., Jones, N., Stone, H. & Conduit, G. Design of a nickel-base superalloy using a neural network. Mater. Des. 131, 358–365 (2017).
Shimoyama, K., Sato, K., Jeong, S. & Obayashi, S. Updating Kriging surrogate models based on the hypervolume indicator in multi-objective optimization. J. Mech. Design 135, 094503 (2013).
Gopakumar, A. M., Balachandran, P. V., Xue, D., Gubernatis, J. E. & Lookman, T. Multi-objective optimization for materials discovery via adaptive design. Sci. Rep. 8, 3738 (2018).
Zhang, H., Fu, H., Zhu, S., Yong, W. & Xie, J. Machine learning assisted composition effective design for precipitation strengthened copper alloys. Acta Mater. 215, 117118 (2021).
Pollock, T. M. Alloy design for aircraft engines. Nat. Mater. 15, 809–815 (2016).
Reed, R. C. The Superalloys: Fundamentals and Applications (Cambridge University Press, 2006).
Wang, W. et al. Automated pipeline for superalloy data by text mining. NPJ Comput. Mater. 8, 9 (2022).
Liu, P. et al. Evolution analysis of γ′ precipitate coarsening in Co-based superalloys using kinetic theory and machine learning. Acta Mater. 235, 118101 (2022).
Murakumo, T., Kobayashi, T., Koizumi, Y. & Harada, H. Creep behaviour of Ni-base single-crystal superalloys with various γ' volume fraction. Acta Mater. 52, 3737–3744 (2004).
Nathal, M. V. Effect of initial gamma prime size on the elevated temperature creep properties of single crystal nickel base superalloys. Metall. Mater. Trans. A 18, 1961–1970 (1987).
Van Sluytman, J. S. & Pollock, T. M. Optimal precipitate shapes in nickel-base γ-γ′ alloys. Acta Mater. 60, 1771–1783 (2012).
Sato, A., Harada, H., Yeh, A. & Kawagishi, K. A 5th generation SC superalloy with balanced high temperature properties and processability. Superalloys 2008, 131–138 (2008).
Koizumi, Y. et al. Development of next-generation Ni-base single crystal superalloys. Superalloys 2004, 35-43 (2004).
Pollock, T. M. & Argon, A. S. Creep resistance of CMSX-3 nickel base superalloy single crystals. Acta Metall. Mater. 40, 1–30 (1992).
Royer, A., Bastie, P. & Veron, M. In situ determination of γ' phase volume fraction and of relations between lattice parameters and precipitate morphology in Ni-based single crystal superalloy. Acta Mater. 46, 5357–5368 (1998).
Völkl, R., Glatzel, U. & Feller-Kniepmeier, M. Measurement of the lattice misfit in the single crystal nickel based superalloys CMSX-4, SRR99 and SC16 by convergent beam electron diffraction. Acta Mater. 46, 4395–4404 (1998).
Schulze, C. & Feller-Kniepmeier, M. Transmisson electron microscopy of phase composition and lattice misfit in the Re-containing nickel-base superalloy CMSX-10. Mater. Sci. Eng. A 281, 204–212 (2000).
Suzuki, A., Inui, H. & Pollock, T. M. L12-strengthened cobalt-base superalloys. Annu. Rev. Mater. Res. 45, 345–368 (2015).
Yan, H. Y., Vorontsov, V. A. & Dye, D. Effect of alloying on the oxidation behaviour of Co-Al-W superalloys. Corros. Sci. 83, 382–395 (2014).
Li, W., Li, L., Antonov, S., Lu, F. & Feng, Q. Effects of Cr and Al/W ratio on the microstructural stability, oxidation property and γ′ phase nano-hardness of multi-component Co-Ni-base superalloys. J. Alloy. Compd 826, 154182 (2020).
Shinagawa, K. et al. Phase equilibria and microstructure on γ' phase in Co-Ni-Al-W system. Mater. Trans. 49, 1474–1479 (2008).
Su, Y., Fu, H., Bai, Y., Jiang, X. & Xie, J. Progress in materials genome engineering in China. Acta Metall. Sin. 56, 1313–1323 (2020).
Xie, J. et al. Machine learning for materials research and development. Acta Metall. Sin. 57, 1343–1361 (2021).
Xue, D. et al. An informatics approach to transformation temperatures of NiTi-based shape memory alloys. Acta Mater. 125, 532–541 (2017).
Hanaoka, K. Bayesian optimization for goal-oriented multi-objective inverse material design. iScience 24, 102781 (2021).
Huang, Y. et al. Effect of thermal exposure on the microstructure and creep properties of a fourth-generation Ni-based single crystal superalloy. J. Mater. Sci. Technol. 69, 180–187 (2021).
Gan, W., Gao, H., Pei, H. & Wen, Z. Effects of microstructure and lattice misfit on creep life of Ni-based single crystal superalloy during long-term thermal exposure. Int. J. Mater. Res. 112, 203–214 (2021).
Kawagishi, K. et al. Development of an oxidation-resistant high-strength sixth generation single-crystal superalloy TMS-238. Superalloys 2012, 189-195 (2012).
Reed, R. C., Tao, T. & Warnken, N. Alloys-by-design: application to nickel-based single crystal superalloys. Acta Mater. 57, 5898–5913 (2009).
Zhu, Z., Basoalto, H., Warnken, N. & Reed, R. C. A model for the creep deformation behaviour of nickel-based single crystal superalloys. Acta Mater. 60, 4888–4900 (2012).
Utada, S., Despres, L. & Cormier, J. Ultra-high temperature creep of Ni-based SX superalloys at 1250 °C. Metals 11, 1610 (2021).
Takebe, Y. et al. Effect of Ir on the microstructural stability of the 6th generation Ni-base single crystal superalloy, TMS-238. J. Jpn Inst. Met. Mater. 79, 227–231 (2015).
Acknowledgements
The authors acknowledge the financial support of National Key Research and Development Program of China (2022YFB3707502 and 2021YFB3802100) and Guangdong Major Project of Basic and Applied Basic Research (2019B030302011).
Author information
Authors and Affiliations
Contributions
The study was planned and designed by Y.S. and P.L., machine learning programs and experiments were performed by P.L., the manuscript was prepared by P.L., H.H., T.L., and Y.S.; C.W. gave helpful discussion. All authors discussed the results and commented on the manuscript.
Corresponding authors
Ethics declarations
Competing interests
The authors declare no competing interests.
Additional information
Publisher’s note Springer Nature remains neutral with regard to jurisdictional claims in published maps and institutional affiliations.
Supplementary information
Rights and permissions
Open Access This article is licensed under a Creative Commons Attribution 4.0 International License, which permits use, sharing, adaptation, distribution and reproduction in any medium or format, as long as you give appropriate credit to the original author(s) and the source, provide a link to the Creative Commons license, and indicate if changes were made. The images or other third party material in this article are included in the article’s Creative Commons license, unless indicated otherwise in a credit line to the material. If material is not included in the article’s Creative Commons license and your intended use is not permitted by statutory regulation or exceeds the permitted use, you will need to obtain permission directly from the copyright holder. To view a copy of this license, visit http://creativecommons.org/licenses/by/4.0/.
About this article

Cite this article
Liu, P., Huang, H., Wen, C. et al. The γ/γ′ microstructure in CoNiAlCr-based superalloys using triple-objective optimization. npj Comput Mater 9, 140 (2023). https://doi.org/10.1038/s41524-023-01090-9
Received:
Accepted:
Published:
Version of record:
DOI: https://doi.org/10.1038/s41524-023-01090-9
This article is cited by
-
Influence of Rejuvenation Heat Treatment on Creep Property for Nickel-Based Directionally Solidified Superalloy
Chinese Journal of Mechanical Engineering (2025)
-
Explainable machine learning-enabled dual-objective design of γ' phase characteristic parameters in γ'-strengthened Co-based superalloys
npj Computational Materials (2025)
-
A Review on the Application of Superalloys Composition, Microstructure, Processing, and Performance via Machine Learning
JOM (2025)
-
Rapid Discovery of High-Performance Additive Manufacturing Superalloys Using High-Throughput and Artificial Intelligence Methods
Metallurgical and Materials Transactions A (2025)
-
Design of Novel High-Strength Ni-Based Superalloys Using a Data-Driven Approach
Transactions of the Indian Institute of Metals (2025)
