
Abstract
Twisted two-dimensional van der Waals heterostructures provide a fertile ground for tailoring electronic and structural properties. However, their vast configurational space poses challenges for systematic study. Here, we introduce SAMBA, an open-source, high-throughput Python workflow that automates the generation, simulation, and analysis of twisted bilayers. Using the coincidence lattice method, we generate a comprehensive set of over 18,000 quasi-commensurable homo- and heterobilayer structures based on 63 experimentally reported monolayers, and perform DFT simulations on a growing subset. The resulting database includes symmetry, interlayer energetics, band alignment, and charge transfer. A detailed case study on graphene-jacutingaite illustrates the framework’s capabilities. This platform offers a robust foundation for data-driven discovery and the rational design of 2D materials with tunable properties.
Introduction
The modern paradigm of materials science—linking processing, structure, properties, and performance—has been increasingly expanded by data-driven approaches that combine high-throughput computations, machine learning, and large-scale databases. These methods have accelerated the discovery of compounds with targeted functionalities, particularly in the search for quantum materials, where quantum effects govern macroscopic behavior. In this context, two-dimensional (2D) systems have attracted growing attention, driven by demands for miniaturization and low-energy devices. Since the experimental discovery of graphene1, the first and most well-known member of this class (a zero-gap semimetal), the family of 2D structures has grown to include metals (NbSe2), semiconductors (MoS2), trivial insulators (hBN), and topological insulators (WTe2), encompassing a wide range of properties often distinct from their bulk counterparts. Research in this field has advanced significantly, impacting various subfields of physics, including spintronics2,3, valleytronics4, polaritonics5, unconventional superconductivity6, multiferroics7, and quantum light sources8.
Although numerous monolayers have been experimentally characterized and compiled into databases9,10, the study of multilayer structures remains largely limited to the investigation of commensurate homostructures or unit-cell heterostructures, where the different layers share the same Bravais lattice11,12,13. In particular, the study of heterostructures poses greater challenges, due both to the synergistic interactions between different materials, which may lead to charge redistribution and structural modifications, and to the lattice incommensurability, which introduces difficulties for both theoretical simulations and experimental realization14,15.
Despite these challenges, the investigation of heterostructures is of great interest, with recent efforts have been directed toward exploring more complex systems, including high-throughput studies and the manipulation of additional degrees of freedom16,17,18,19. In particular, van der Waals heterolayers allow for the exploration of nontraditional combinations of materials and geometries, extending beyond what is achievable through conventional growth methods. These systems are particularly attractive for band structure engineering aimed at optimizing and/or achieving new properties for specific technological applications. For example, enhanced mobility in graphene-based transistors has been achieved through encapsulation with hBN20, while photovoltaic and light-emitting devices have been developed by combining optically active semiconducting layers with graphene as a transparent electrode21. Additionally, we highlight a recent study22, in which we demonstrated the manipulation of the spin orientation of surface states in a topological insulator through a van der Waals interface with a ferromagnetic material.
Among the various degrees of freedom available for band structure engineering in heterostructures, relative sliding and rotation between layers have gained particular attention, giving rise to the emerging fields of slidetronics23,24 and twistronics25, respectively. These approaches have enabled applications such as non-volatile ferroelectric memories26, the Hall effect27, and spontaneous valley polarization28. They strongly influence the physical properties of materials: slidetronics enables the control of ferroelectricity, conductivity, and magnetism29,30,31,32,33, while twistronics modifies interlayer coupling and the electronic structure16,34,35,36. In twisted bilayers, phenomena such as unconventional superconductivity and ferromagnetism have been observed in graphene-based systems6,37,38,39, along with emergent effects in Moiré lattices, such as the Hofstadter’s butterfly and the opening of energy gaps40,41,42,43,44.
Exploring the vast and complex configurational space enabled by the combination of diverse 2D materials, together with the variation of twist angles in bilayers, represents a major challenge for first-principles simulations. In line with recent efforts to overcome this challenge18,19, in this work we present the SAMBA code (Simulation and Automated Methods for Bilayer Analysis). SAMBA is a high-throughput Python-based computational workflow developed to automate the generation of twisted homo- and heterobilayers, the execution of DFT calculations, the systematic analysis of their structural and electronic properties, as well as the extraction and storage of the resulting data. As a validation of our workflow, we employed this high-throughput first-principles framework to construct a database of twisted homo- and heterobilayers based on a broad selection of 2D monolayers (listed in Table 1).
All materials were extracted from the C2DB (Computational 2D Materials Database)9,45 and have been previously reported as experimentally synthesized or naturally occurring. This selection covers a broad spectrum of materials relevant to twistronics, consisting mainly of intrinsic van der Waals (vdW) materials, whose weak interlayer interactions are ideal for exfoliation and stacking. To expand the potential for discovering novel interface phenomena, we also included a select group of compounds, such as CdTe, HgTe, Ge2, Si2, and Zn2Se2, which, while not traditionally bulk vdW solids, exhibit vdW-like interactions in the few-layer limit, especially when forming heterostructures. This hybrid selection strategy ensures our framework explores both well-established vdW systems and emergent 2D materials of significant current interest, providing a robust platform for the data-driven discovery of novel twisted bilayers. For each material combination, we investigate different structural configurations, including in-plane displacements and rotations, while maintaining commensurate lattices or a maximum lattice mismatch of 3%.
It is worth noting that while high-quality homostructures can be obtained via exfoliation from natural bulk samples or scalable chemical methods46,47, the production of van der Waals heterostructures and twisted bilayers remains a considerably more complex process, with low yield and high sample-to-sample variability. We anticipate that this study will serve as a valuable guide for the experimental synthesis of heterostructures, facilitating the identification of energetically favorable structures and technologically relevant properties. The data obtained in this investigation are accessible through the following link stored in the INCT—Materials Informatics database (https://midb.cloud/), contributing to the advancement of 2D materials science.
The structure of this article is organized to present the scientific value of our work in a concise and discovery-oriented manner. In the “Results” section, we quantify the vast configurational space of twisted vdW bilayers, introduce the architecture of the resulting database, and demonstrate the platform’s potential through an in-depth case study on the graphene-jacutingaite heterostructure. These findings are followed by a “Discussion” section, where we contextualize our results and highlight the relevance of our framework to the field of twistronics. Finally, the “Methods” section provides a complete technical description of the SAMBA code architecture, detailing the high-throughput DFT simulations and the analysis methodologies employed. For readers seeking a deeper understanding of the tool’s construction and technical parameters, the article may alternatively be approached beginning with the “Methods” section.
Results
Database overview
To systematically map and explore the vast configurational space of twisted van der Waals bilayers, we developed the open-source workflow SAMBA (Simulation and Automated Methods for Bilayer Analysis). The code was designed in interconnected modules capable of: (i) generating thousands of quasi-commensurate structures using coincidence lattice method; (ii) performing first-principles calculations based on Density Functional Theory (DFT) within a high-performance approach; and (iii) efficiently extracting, processing, and organizing structural, electronic, and energetic properties into a robust database. The results of this large-scale computational screening are detailed below, while a complete description of the SAMBA code architecture and the specific DFT methodologies employed for data generation is provided in the Methods section.
The database constructed in this study comprises the generation of more than 18,000 unique bilayer structures, characterized according to specific criteria of twist angle and lattice mismatch. To date, we have performed structural optimizations and electronic structure calculations for more than 850 configurations. The remaining calculations will be progressively carried out, prioritizing structures with an increasing number of atoms and those classified by twist angles associated with the most frequent symmetries.
To discuss the content of the database, we next present a specific bilayer configuration as an example, in order to illustrate the capabilities of our workflow. In sequence, we provide a statistical overview of the entire dataset contained in the database, in which we examine selected properties in greater detail, including band gaps, work function, binding and sliding energies and twist angles. The aim is to explore trends and correlations within the data and to demonstrate potential applications of the database, rather than to provide an in-depth or material-specific analysis of a series of compounds.
Jacuntigaite on graphene
Here, we employ graphene and monolayer jacutingaite as example materials to illustrate the capabilities of the SAMBA code, both in generating twisted bilayers and in performing structural optimization and detailed analysis of the electronic structure of a selected bilayer.
Graphene is a planar monolayer of carbon atoms arranged in a hexagonal lattice with sp2 hybridization1. This crystalline structure endows graphene with remarkable properties, such as high electron mobility, outstanding mechanical strength, and excellent thermal conductivity48,49. Graphene exhibits a linear Dirac-like energy dispersion at the K and \(K^{\prime}\) points of the Brillouin zone, with no band gap and high electrical conductivity50. Since its experimental isolation in 2004, graphene has been extensively studied due to the fact that its charge carriers behave as massless Dirac fermions, giving rise to a variety of nontrivial quantum phenomena, thus making it a promising platform for applications in electronics and spintronics51.
Jacutingaite (Pt2HgSe3) is a naturally occurring, exfoliable mineral discovered in 2008 in the Itabira district, Minas Gerais, Brazil52,53. It consists of vdW-type layers, in which Hg atoms form a honeycomb lattice embedded in a PtSe matrix. In its monolayer form, jacutingaite exhibits a Dirac cone crossing the Fermi level at the K point in the absence of spin-orbit coupling (SOC), while the inclusion of SOC opens an indirect energy gap that characterizes its topological phase54,55. Monolayer jacutingaite is a promising candidate for the study of relativistic effects in two-dimensional materials, standing out due to the presence of topologically protected edge states with shallow penetration depth56.
The bilayer generator in SAMBA was configured with a maximum of 200 atoms per cell for the scan cutoff and used the percentage variation limits from subsection Bilayer generator workflow of Methods. This configuration produced 16 output structures. These structures vary in terms of the number of atoms in the unit cell, the twist angle between the layers, and the lattice mismatch. Figure 1 presents four examples of generated structures, where “Mismatch” refers to the relative area mismatch between the two materials.

Representation of twisted bilayer configurations for graphene and jacutingaite obtained using the SAMBA code. The structures illustrate the explored configurational diversity, varying in unit cell size, twist angle, and lattice mismatch. Panels a-d respectively represent bilayers with 30, 92, 122, and 176 atoms in their unit cell.
Here, we present the structural optimization and electronic structure calculations for the configuration with 30 atoms and θt = 0% with lattice mismatch of 0.48%. The plots shown in Fig. 2, along with a .json file that stores the set of information listed in the Supplementary Information Table S1, constitute an example of an entry in the database. Figure 2b, c present the structural optimization of the bilayer, with a vertical separation (panel b) of 3.06 Å between the layers and a lateral displacement (panel c) of the top Jacutingaite layer given by (\(\frac{1}{6}{\vec{A}}_{1}\), \(\frac{1}{4}{\vec{A}}_{2}\)). The structural optimization yields a binding energy of approximately 21 meV/Å2, comparable to that found in bilayer graphene, while the energetic cost for lateral sliding between the layers is minimal, with a maximum barrier of only 0.82 meV/Å2.

a-c Results of structural optimization, including interlayer separation and lateral displacement. d, e Band structures resolved by material, showing the bands (solid black line) and contributions from Graphene (blue dots) and Jacutingaite (red dots). f-i Orbital-resolved bands and projected Density of States. j-l Spin-resolved bands for the x, y, and z components of spin, distinguishing between spin up (red dots) and spin down (blue dots). m, o Work function alignment between the layers. n, o Net charge transfer from jacutingaite to graphene.
The band structure of the bilayer, including projections of atomic-orbital contributions and spin components (Fig. 2d-l), reveals a relatively weak hybridization between the electronic states of the two layers. This indicates that the main electronic features of each material are largely preserved. For Graphene, note that the Dirac cone features, originating from the K and \(K^{\prime}\) points of the primitive Brillouin Zone, are mapped to the Γ-point of the supercell BZ due to band-folding, retains its nearly unaltered Dirac cone at the Γ-point, with the exception of a small band gap opening of 6.4 meV.
Regarding the Jacutingaite monolayer states, we observe spin splitting of the bands near the Fermi level, with the magnitude of the splitting increasing alongside the predominance of the out-of-plane (Sz) spin component, possibly associated with the presence of a Zeeman-like effect. This behavior of the Jacutingaite states may influence both the topological classification of the system and the nature of edge states under confinement. Finally, Fig. 2m shows that the work function of the bilayer lies between the values of the isolated layers, while Fig. 2n demonstrates a net electron transfer from Jacutingaite toward graphene.
This illustrative case study highlights the robustness of our workflow and the capability of the SAMBA framework to handle twisted bilayers of significant structural and electronic complexity. The framework’s versatility is further underscored by its successful application in a previous study, where a preliminary version was used to analyze the interface between Bi2Se3 and the ferromagnetic insulator CrI322. Having now established the reliability of our approach, we turn our focus in the followin subsection to a broad statistical analysis of the entire generated database.
Statistical analysis of properties
Here, we explore general trends and correlations observed in the database, focusing on the distribution of twist angles θt, binding Eb and sliding Es energies, the evolution of structural symmetries, and electronic properties such as the band gap, work function, ionization potential, and charge transfer. These results highlight not only the robustness of the proposed methodology but also the diversity and complexity of the configurational space explored in this study. Additionally, we emphasize relevant implications for areas such as twistronics, slidetronics, topological materials, 2D optoelectronics, and spintronics. This analysis is presented through the following key points:
-
Twist Angle Distribution and Expansion of the Twistronics Space: The histogram analysis in Fig. 3 reveals how the distribution of twist angles varies with the number of atoms in the generated cells. For smaller structures (up to 30 atoms), there is a predominance of highly symmetric orientations (0°, 30°, and 60°), whereas larger cells (up to 100 atoms) exhibit a drastic reduction in the frequency of these angles. For instance, the occurrence of 0° drops from 38.47% to just 3.7% with the increase in cells. In this regime, the distribution becomes denser, revealing a broad spectrum of unconventional angles. This behavior reflects a greater configurational freedom and the ability to access a quasi-continuous range of angular variations, which justifies the adoption of the high-throughput computational approach employed in this work.
Fig. 3: Twist angle distribution and expansion of configurational space. 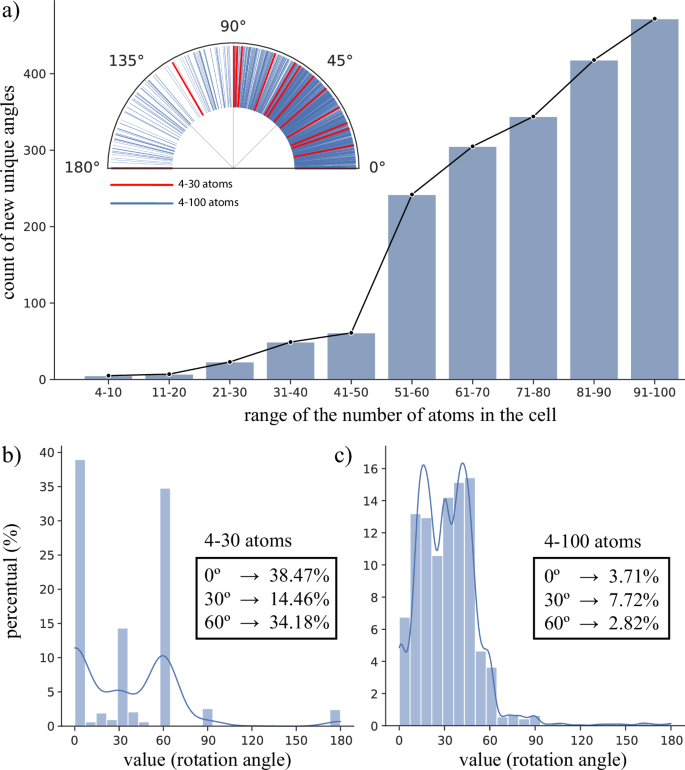
Twist angle distribution across different bilayer sizes, demonstrating that increasing the number of atoms in the cell expands the configurational space for twist angles. a Distribution of the count of new unique twist angles as a function of the bilayer size (increasing range of number of atoms in the cell). The inset shows the angular distribution for the 4-30 atom range (red line) and the 4-100 atom range (blue line). Histograms illustrating the percentage of twist angles in bilayers containing up to 30 atoms (b) and up to 100 atoms (c) per cell. Subpanel (c) highlights the sharp drop in the frequency of high-symmetry orientations (0, 30 and 60 degrees) in larger cells, indicating a denser distribution of unconventional angles.
Obtaining a wide range of twist angles is particularly advantageous for twistronic applications, where the relative rotation between layers serves as a fundamental degree of freedom, capable of redefining or subtly modulating the electronic properties of the system. This angular control can even enable the emergence of exotic phenomena associated with so-called “magic angles,” such as unconventional superconductivity, correlated ferromagnetism, and flat bands6,39,57. By cataloging thousands of structures with different twist angles, this database serves as a strategic tool for the systematic search for new phases and emergent functionalities in two-dimensional materials.
-
Correlation Between Energetic and Structural Parameters: Figure 4 reveals important correlations among the twist angle, interlayer separation Z, number of atoms in the structure, and the binding Eb and sliding Es energies. The analysis is based on structural and electronic data extracted for smaller cells, which are predominantly characterized by high-symmetry stackings.
Fig. 4: Cross-correlations between structural and energetic parameters. 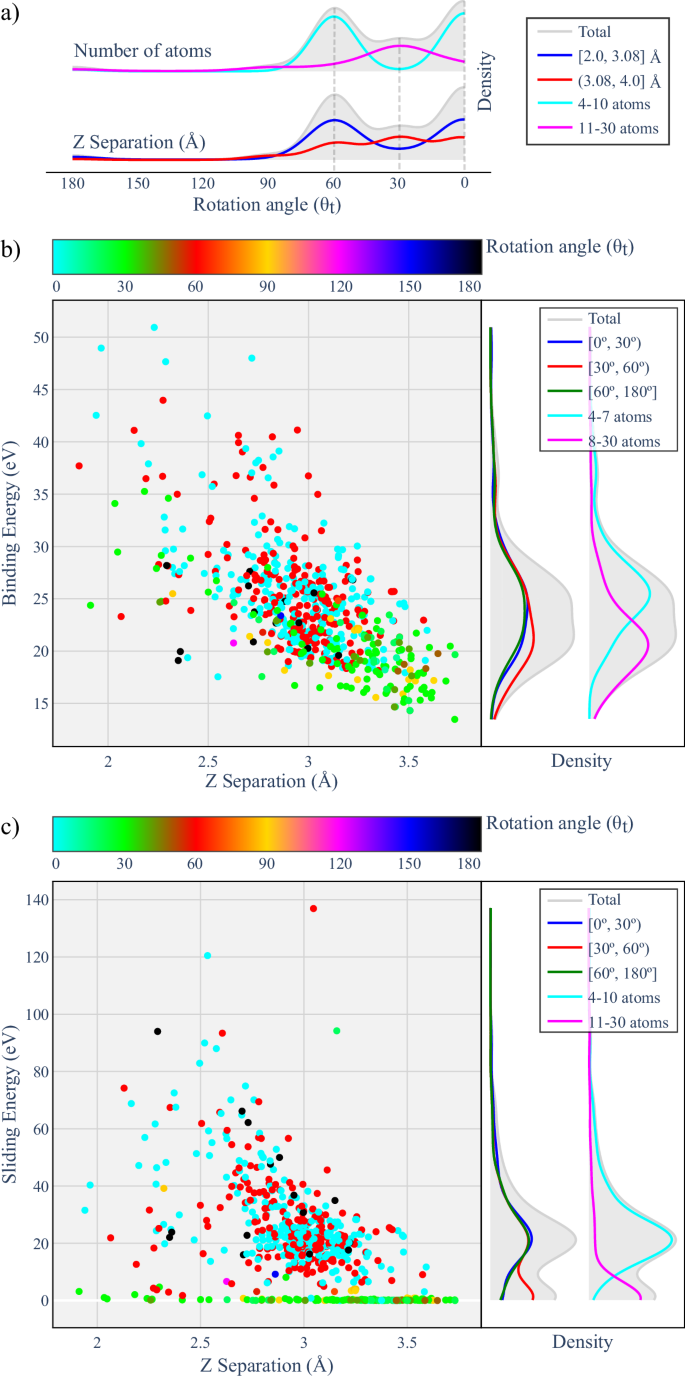
Cross-correlations between the twist angle, interlayer separation, and energetic parameters for the generated bilayers. a Density plots of the number of atoms (light blue and turquoise solid lines) and interlayer separation (dark blue and purple solid lines) as a function of the twist angle. This highlights preferred stacking regimes for different twist angles and system sizes. Distributions and density plots showing the behavior of the binding energy (b) and the sliding energy (c) as functions of interlayer distance, twist angle (color map at the top), and bilayer size (by atom count range, light blue and turquoise lateral solid lines).
The data in panels of Fig. 4 show how the twist angle directly influences structural properties and interlayer coupling in van der Waals bilayers. Our analysis shows that bilayers with 0° and 60° angles mainly occur in small cells (4-10 atoms), with commensurate AA or low-mismatch AB-type stacking. We find that these configurations exhibit Z separations between 2.5 and 3.0 Å, consistent with what we calculate to be strong structural coupling and favorable atomic alignment, resulting in high values for both the binding energy (Eb, between 20-30 meV/Å2) and sliding energy (Es, between 10–40 meV/Å2). From our results, this combination indicates a robust interlayer interaction, with efficient cohesion—despite the absence of covalent bonding—and significant lateral sliding barriers, which favor the stabilization of such configurations.
In contrast, our results for stackings with a 30° angle show they are associated with larger cells (11-30 atoms), generally presenting AB-type stacking with larger lattice mismatches, leading to interlayer separations above 3.0 Å and reduced atomic overlap. As a result, these bilayers exhibit lower binding energy values (Eb < 20 meV/Å2) and, more significantly, a sharp drop in sliding energy Es, which can fall below 1 meV/Å2. We interpret this behavior as a reflection of weaker interlayer interactions and smoother energy landscapes, favoring lateral sliding and structural reconfiguration. These characteristics are particularly relevant for slidetronic, where low Es values enable lateral switching mechanisms and the development of reconfigurable 2D architectures, with potential applications in 2D ferroelectric memories, reconfigurable devices, and electromechanical sensors58.
In brief, Fig. 4 demonstrate how this cross-correlation, mediated by the twist angle, represents a versatile parameter for tuning thermodynamic stability (via Eb) and mechanical response (via Es) in bilayers, reinforcing the role of twist engineering in the design of 2D heterostructures with adjustable interlayer coupling.
-
Structural Symmetry and Emergent Phenomena: Figure 5 illustrates how the space groups of bilayers evolve in relation to the symmetries of their constituent monolayers. The data show that the twisting between layers often leads to a reduction in the system’s symmetry, particularly through the breaking of inversion symmetry. This breaking arises from the loss of common periodicity between the two lattices and enables a range of physical phenomena, such as topological transitions, valley polarization, modifications in optical selection rules, piezoelectricity, 2D ferroelectricity, second-harmonic generation (SHG), and Rashba-Dresselhaus-type spin splittings59, key effects for spintronics and nonlinear optics2,60.
Fig. 5: Symmetry analysis and transitions. 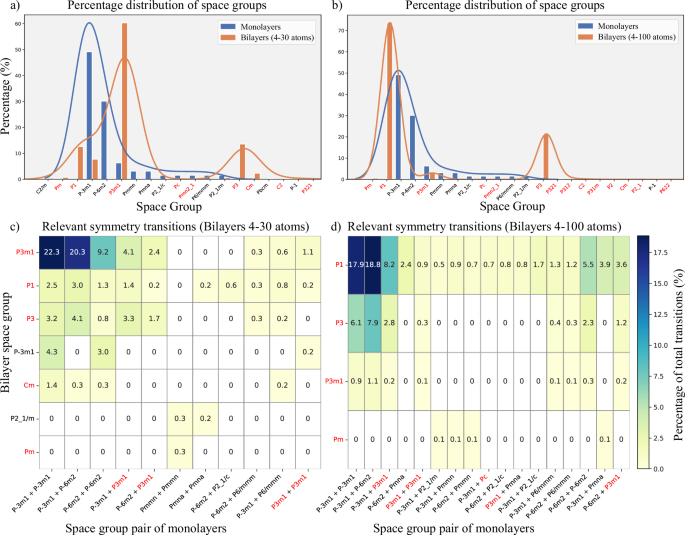
Symmetry analysis of the generated mono- and bilayers. Percentage distribution of space groups in monolayers (blue bars) and bilayers (orange bars) for systems containing up to 30 atoms (a) and up to 100 atoms (b), respectively. Heatmap diagrams illustrating the frequency (in percent) of relevant symmetry transitions between the space group pair of the constituent monolayers (x-axis) and the resulting bilayer space group (y-axis). Bilayers are categorized by up to 30 atoms (c) and up to 100 atoms (d). Space groups lacking inversion symmetry are highlighted in red on the x-axis.
Active symmetry control, made possible by adjusting the twist angle or through lateral sliding between layers, significantly broadens the range of functionalities in 2D devices. In this context, the systematic mapping of space groups for over 18,000 bilayers in the database provides a robust and predictive platform for identifying structures with specific symmetries and associated functionalities. This catalog can be integrated into automated screening pipelines or serve as a foundation for machine learning models, accelerating the discovery and rational design of multifunctional materials with tunable properties.
-
Electronic Landscape and Technological Potential: The histograms in Fig. 6 provide a comprehensive statistical overview of various electronic and structural properties contained in the database, reflecting both the configurational diversity and the corresponding electronic flexibility accessed by twisted bilayers.
Fig. 6: Statistical overview. 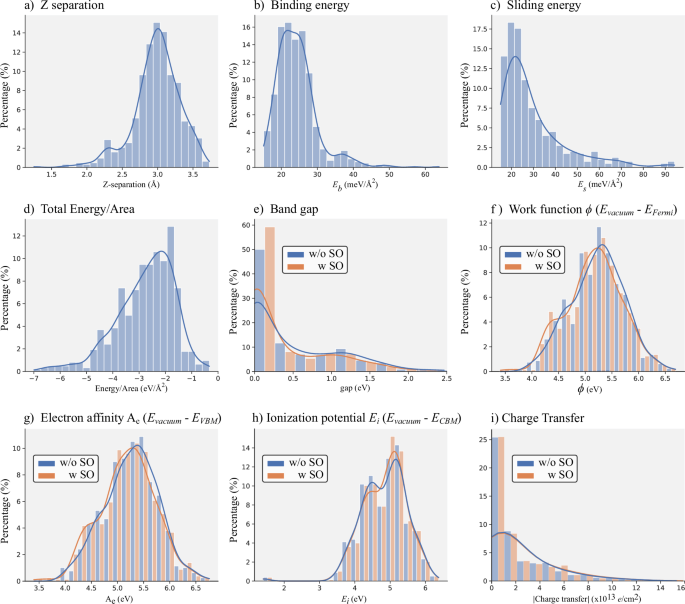
Statistical overview via histograms and density plots of various structural and electronic properties of the twisted bilayers. Distributions are shown both including (orange bars) and neglecting (blue bars) spin-orbit coupling (SOC). Structural and energetic properties, including interlayer Z separation (a), binding energy (b), sliding energy (c), and total energy per area (d). Electronic properties, including band gap (e), work function (f), electron affinity (g), ionization potential (h), and interlayer charge transfer (i).
Panel (e) shows that the band gap values vary widely, ranging from metallic structures to semiconductors with gaps exceeding 2 eV. The inclusion of spin-orbit coupling slightly alters this distribution; additionally, the variation in the density of metallic states suggests transitions to insulator states induced by SOC, without ruling out effects related to the twist angle. This scenario paves the way for the emergence of two-dimensional topological phases in twisted systems35.
The work function, electron affinity, and ionization potential, shown in panels (f–h), are critical properties for band alignment in 2D devices such as transistors, photodetectors, and solar cells. These parameters exhibit broad distributions across the database, reflecting the chemical diversity of the constituent monolayers. Identifying bilayers with distinct alignment regimes can favor mechanisms such as efficient exciton separation or efficient recombination.
Finally, panel (i) presents the interlayer charge transfer, revealing systems with both negligible and significant transfer levels, directly related to differences in electronegativity and the degree of interlayer hybridization. This phenomenon can act as an intrinsic doping mechanism, allowing modulation of the Fermi level without the introduction of chemical dopants. Such control is crucial for Schottky barrier engineering61 and the formation of p − n junctions in 2D electronic devices21, with applications in logic, sensing, piezoelectricity, and photovoltaics62.
-
Overview of the Statistical Analysis: In brief, the comprehensive statical analysis of the twisted bilayer dataset presented here unveils fundamental correlations between structural configurations, interlayer interactions, symmetry evolution, and electronic properties. By systematically exploring a broad configurational space, this study provides valuable insights into how twist angle, stacking, and chemical composition can be harnessed to modulate functionalities relevant to next-generation 2D technologies. The observed trends reinforce the versatility of twist engineering and interlayer control as powerful tools for designing materials with tailored properties, offering promising pathways for advances in twistronics, slidetronics, topological phases, and reconfigurable electronic and optoelectronic devices.


Discussion
In this work, we developed a high-throughput computational framework for the systematic construction and first-principles analysis of twisted van der Waals homo- and heterobilayers. This framework is implemented in an open-source code, called SAMBA. We explored the configurational space of 63 monolayers, defined by variations in twist angles and stacking configurations. The resulting database contains over 18,000 unique structures characterized by specific twist and mismatch criteria. Up to this date, we have performed structural optimizations and electronic structure calculations for more than 850 of these configurations; the remaining calculations will be carried out progressively, prioritizing structures with increasing atom count and those sorted by the most frequent symmetry-related twist angles.
The statistical analyses highlight the rich physical landscape accessible through twist engineering, revealing fundamental correlations between twist angle, interlayer coupling, and symmetry breaking, favorable for the emergence and/or modulation of relevant electronic phenomena. In particular, we demonstrate that rotational alignment acts as an effective parameter for tuning both the thermodynamic stability and mechanical response of bilayers, offering design guidelines for applications in twistronics, slidetronics, topological engineering, and devices with tunable interlayer charge transfer. We also show that increasing the cell size enables access to a quasi-continuous range of twist angles, extending beyond the high-symmetry orientations typically investigated.
The architecture of the SAMBA code and the breadth of the associated database provide a versatile platform for several future research directions, including: (i) integration with machine learning techniques for property prediction and automated screening, due to the structured and extensive nature of the database.; (ii) extension to more complex systems, such as trilayers and externally doped structures; (iii) exploration of magnetic orderings; and (iv) adaptation to other first-principles package beyond VASP.
Therefore, this platform provides the scientific community with a powerful tool to accelerate the identification of promising bilayer combinations and guide the rational design of 2D materials with tunable properties for novel technological applications.
Methods
The SAMBA code used in this study consists of two main modules: the twisted homo/heterobilayer generator, which performed the pairwise combination of all 63 selected van der Waals monolayers, followed by the high-throughput DFT module for executing first-principles calculations.
Bilayer generator workflow
The construction of van der Waals heterostructures, considering the degrees of freedom introduced by possible twists in the crystalline lattice, is theoretically and experimentally hindered by incommensurability, which arises from differences in the lattice parameters or crystalline symmetries of the materials to be stacked.
In density functional theory-based simulations, this issue can be mitigated by using progressively larger supercells, which, however, increase computational cost. For the development of this database, the SAMBA code employs the coincidence site lattice method63 to predict favorable combinations of monolayers in the construction of twisted 2D bilayers. This approach enables the generation of reasonably sized cells for computational calculations at the expense of small distortions in the materials.
Thus, we can simulate twist angles and Moiré patterns with lower computational cost, expanding the set of analyzed van der Waals heterostructures. Additionally, this approach can aid in the interpretation of experimental data and guide possible synthesis configurations. The workflow for bilayer generation is presented in Fig. 7. A detailed, step-by-step description referencing the stages of this figure is provided below.
-
Operating loop (Stage I, Fig. 7): To generate the twisted bilayers from the van der Waals monolayers, the code employs the coincidence lattice method, executed through a brute-force approach. This involves scanning all possible combinations of cells from the first material (A) with all possible cells configurations from the second material (B). Instead of targeting a specific twist angle, the code systematically sweeps through combinations of supercells to identify all configurations that fulfill the predefined mismatch criteria.
Consequently, the twist angles arise as an emergent outcome of this geometrical search. To construct the database, the code operates in a loop, forming pairs for all 63 monolayers, generating a total of 2016 material combinations: 63 homobilayers (A, A) and 1953 heterobilayers (A, B), where the pairs (A, B) and (B, A) were considered equivalent.
-
Supercell construction (Stage II, Fig. 7): Throughout each step of the loop, that is, during the analysis of a given combination of monolayers (A, B), the code begins by generating a supercell for each material, based on the structure files (unit cell) of the respective monolayer. For each material, the code determine all possible cells configurations within the corresponding supercell by scanning the combination of all lattice vectors \(({\vec{A}}_{1},{\vec{A}}_{2})\) and \(({\vec{B}}_{1},{\vec{B}}_{2})\), expressed as linear combination of the respective primitive lattice vectors \(({\vec{a}}_{1},{\vec{a}}_{2})\) and \(({\vec{b}}_{1},{\vec{b}}_{2})\), that is, Bravais lattice points given by:
$${\vec{A}}_{1}={m}_{1}{\vec{a}}_{1}+{m}_{2}{\vec{a}}_{2};\quad {\vec{A}}_{2}={m}_{3}{\vec{a}}_{1}+{m}_{4}{\vec{a}}_{2}$$$${\vec{B}}_{1}={n}_{1}{\vec{b}}_{1}+{n}_{2}{\vec{b}}_{2};\quad {\vec{B}}_{2}={n}_{3}{\vec{b}}_{1}+{n}_{4}{\vec{b}}_{2}$$Where (m1,2,3,4) and (n1,2,3,4) \(\in {\mathbb{Z}}\). These are the elements of the supercell matrix Ms that transform the unit cell of the monolayer into the bilayer supercell.
-
Lattice coincidence criteria (Stage III, Fig. 7): Once all possible cells of the materials (A and B) are listed, a comparison in loop is performed between each cell, with the lattice coincidence achieved when the following criteria are satisfied:
1st) Percentage variation in cell areas:
$$({S}_{A}=| {\vec{A}}_{1}\times {\vec{A}}_{2}| \,\leftrightarrow \,{S}_{B}=| {\vec{B}}_{1}\times {B}_{2}| ) < 5 \%$$2nd) Percentage variation in the modulus of lattice vectors:
$$({\vec{A}}_{1}\leftrightarrow \,{\vec{B}}_{1})\,{\rm{and}}\,({\vec{A}}_{2}\leftrightarrow {\vec{B}}_{2}) < 3 \%$$3rd) Percentage and absolute variation in the opening angle of the lattice vectors:
$$({\theta }_{A}\leftrightarrow {\theta }_{B}) < 2 \% \,{\rm{and}}\,{2}^{\circ },\,\text{respectively}\,$$4th) Lattice percentage distortion:
$$({\vec{A}}_{1}\leftrightarrow \,{\vec{A}}_{2})\,{\rm{and}}\,({\vec{B}}_{1}\leftrightarrow {\vec{B}}_{2}) < 3 \% .$$From the 1st to the 3rd criteria, cells with similar shape and area are selected, ensuring the lowest possible mismatch lattice, while the 4th criterion minimizes the deformation applied to each cell.
The twist angle θt between the monolayers is obtained by defining, in each cell of the match, the vectors \({\vec{R}}_{A}\) and \({\vec{R}}_{B}\) that connect the origin of the cell to its center, as shown in Fig. 7 (III). Where θt corresponding to the angle required to align \({\vec{R}}_{B}\) with \({\vec{R}}_{A}\), such that:
$${\theta }_{t}={\tan }^{-1}\left(\frac{{\vec{R}}_{B}\times {\vec{R}}_{A}}{{\vec{R}}_{B}\cdot {\vec{R}}_{A}}\right)$$In other words, we apply the rotation to material B while keeping material A fixed. We emphasize that the initial lattice orientation, defined by the monolayer’s structure file provided to the SAMBA code, serves as the zero-angle reference for all bilayer structures. Consequently, users must consider this reference file to accurately analyze the twist angles, both for their own generated structures and for those in our database.
-
Bilayer cell construction (Stage IV, Fig. 7): Once the lattice matching between monolayers A and B has been verified for a given twist angle θt, the bilayer cell is constructed as an intermediate cell between the two materials. This vector-averaging approach is used to construct a reference cell that minimizes and evenly distributes the strain between layers A and B, where the bilayer vectors are: \({\vec{C}}_{1}\) = (\({\vec{A}}_{1}\) + \({\vec{B}}_{1}\))/2 and \({\vec{C}}_{2}\) = (\({\vec{A}}_{2}\) + \({\vec{B}}_{2}\))/2.
-
Filtering the generated structures (Stage V, Fig. 7): At the end of each iteration of the loop, a large number (hundreds to thousands) of structures are typically generated. However, most of them correspond to structurally similar lattices, which is a side effect of the brute-force approach we employ. To address this, we implemented a filtering process to eliminate redundant structures using two approaches:
1st) Initial Decomposition Test: All generated structures are first examined to determine whether they can be decomposed into smaller cells. If decomposition is possible, the structure is discarded, as the smaller cell is already present in the dataset by construction.
2nd) Geometric Comparison: The remaining structures are compared against each other. When similar pairs are identified, one of the structures is eliminated, preserving the more geometrically favorable one. The selection criterion favors the structure with the smallest variation in the magnitudes of the lattice vectors (avoiding elongated cells) and the smallest opening angles.
For structure filtering, we utilize Root Mean Square Deviation (RMSD) minimization, as implemented in the pymatgen (Python Materials Genomics)64 and spglib65 packages. This approach is based on the Kabsch algorithm66 for point-set alignment and the Hungarian algorithm67 for solving the optimal atomic matching problem.
-
Storing generated structures (Stage VI, Fig. 7): At the end of the loop, the structures corresponding to 2.016 (A,B) bilayers for different twist angles, are stored in the structure files. For this study, we generated bilayers with up to 100 atoms within the cell, totaling 18,436 structures, of which only 318 (1.73%) correspond to fully commensurate lattices. Figure 7 illustrates that the number of commensurate structures, and consequently the number of unique twist angles, grows rapidly with the number of atoms within the the cell.

Schematic representation of the SAMBA code workflow for constructing twisted homo- and heterobilayers based on the coincidence lattice method. The pipeline is divided into six main stages. I) The operating loop combines the 63 selected monolayers, generating 2016 combinations (AA/AB). II) Supercell creation and obtaining all possible cells for Material A and Material B. III) Comparison of candidate cells using the coincidence lattice method and mismatch criteria, resulting in the twist angle and cell area. IV) Initial set of generated twisted bilayers. V) Filtering of structures to eliminate non-unit cells and identical lattices, employing an initial decomposition test and geometric comparison. VI) Final storage of the generated structures. The graph shows the number of generated bilayers (blue bars) and the cumulative growth (red line) of accumulated bilayers as the number of atoms in the cell increases (up to 100 atoms).
High-throughput DFT workflow
Once the set of structures to be analyzed was obtained, we performed first-principles calculations using density functional theory (DFT)68,69, through the Vienna Ab initio Simulation Package (VASP)70,71, to investigate the structural and electronic properties of twisted homo/hetero van der Waals bilayers. Due to the large number of generated structures, we opted to develop a custom algorithm for high-throughput DFT calculations, followed by result analysis, extraction, and storage, integrating one of the main modules of the SAMBA code. The algorithm recognizes the structures generated by the bilayer generator module, identifying the constituent monolayers, including the atoms belonging to each material, the twist angle, mismatch criteria, and the supercell and strain matrices used in the construction. Instead of adapting third-party codes to the specific needs of this study, we focused on developing this dedicated code, optimizing the workflow and improving result delivery.
The SAMBA code’s capabilities extend beyond bilayer systems to the analysis of any structure provided in a VASP POSCAR format. As a versatile high-throughput DFT tool, its purpose is to facilitate systematic electronic structure investigations and aid in the computational discovery of novel materials. The workflow for High-Throughput DFT calculations implemented in the SAMBA code is presented in Fig. 8. A detailed, step-by-step description referencing the stages of this figure is provided below.
-
Input File Generation and Setup (Stage I, Fig. 8): The code fully automates the setup for high-throughput VASP calculations on each bilayer structure. The process is initiated by parsing the POSCAR file to extract the necessary structural information (ionic species and positions). This information is then used to generate the input files (POTCAR, INCAR, KPOINTS) and define key computational parameters, as follows:
POTCAR Assembly: The POTCAR file is created by concatenating the individual pseudopotentials for each ionic species present in the system.
ENCUT tag: This tag in the INCAR file defines the cutoff energy, where we define it as 30% greater than the largest ENMAX value found in the POTCAR file.
DIPOL tag: This tag in the INCAR file defines the reference position for calculating the total dipole moment, where we define it as the center of mass of the bilayer.
KPOINTS Generation: The KPOINTS file is generated using the VASPKIT package72, which identifies the Bravais lattice and provides an appropriate k-point grid and k-path for band structure calculations.
Job Script: Finally, a Bash script (job.sh) is created to sequentially execute the DFT calculations for all bilayers. The script can be easily modified to run on different Linux job schedulers, such as Slurm, OpenPBS, or Torque.
-
Structural Optimization (Stage II, Fig. 8): The DFT workflow begins with the structural optimization of the bilayer, divided into three stages:
z-scan: Estimates the equilibrium separation between the layers by scaning the total energy as function of the vertical separation, the displacement ΔZ in Fig. 2(a). Initially, the total energy is computed for separations ranging from 1 Å to 5 Å (in steps of 1 Å). Thus, the energy is analyzed for intermediate separations between the values that minimize the total energy, refining the precision until it is below 0.01 Å.
xy-scan: The in-plane potential landscape was explored by rigidly scanning the lateral displacement (Δx, Δy) of the top layer relative to the fixed bottom layer. This scan utilized a grid of 9 × 9 points within the unit cell, for a total of 81 distinct stacking configurations. During this scan, the interlayer distance was kept constant. The most stable stacking arrangement is identified as the global minimum on the resulting potential energy surface.
Relaxation: Finally, the relaxation of the system is performed to adjust the relative positions of the ions and the separation between layers, aiming for the most stable configuration. Additionally, a static calculation is also carried out for the isolated monolayers, separated by 15 Å. The energy difference between the most stable stacking and the non-interacting system provides the binding energy Eb between the layers. Therefore, for a given system (A,B), among the bilayers with different twisting angles, the thermodynamically most stable configurations will be those with the highest values of Eb.
-
Electronic structure (Stage III, Fig. 8): With the optimized structure, the workflow continues by performing the following calculations to analyze the electronic structure:
SCF: The electronic density is determined self-consistently using a uniform Monkhorst-Pack k-point mesh.
NSCF: From the electronic density, the band structure is then determined along the k-path connecting high-symmetry points of the 1st BZ.
DOS: The density of states (DOS), is then calculated using the tetrahedron method with Blöchl corrections. This approach accurately determines the partial occupations of each orbital without smearing. To ensure conservation of the number of electrons, we used an increased value for the energy grid (NEDOS = 3001).
Bader’s Charge: Finally, to estimate the charge transfer between the layers, the code uses the method proposed by Richard Bader73, which allows dividing molecular systems into individual atoms based on the analysis of the electronic density surface. The charge transfer is quantified as the difference between the Bader’s charge of the bilayer (A,B) and the isolated layers, where ΔQ = QAB − QA − QB.
-
Post-processing step (Stage IV, Fig. 8): The DFT outputs were post-processed using VASProcar74, an open-source Python3 tool developed by one of the authors. The code’s main functionalities include analyzing the total and projected DOS, plotting the electronic band structure with orbital and spin projections, and estimating the work function from the electrostatic potential. Furthermore, VASProcar extracts key electronic properties such as the band gap, Fermi level, and total energy for database integration.
-
Database integration (Stages V-VI, Fig. 8): Any additional information is analyzed and extracted using internal scripts, including the interlayer separation distance, lateral displacement, binding energy, and parameters for constructing the bilayers. Meanwhile, the symmetry analysis of the crystalline structure is performed using the pymatgen package and the Spglib crystallographic symmetry library65. All relevant information for each structure is stored in .json files, where each data point is assigned a specific label. Additionally, each structure is assigned a unique 16-digit ID that identifies it, along with the constituent monolayers. Finally, the main database is created by merging the .json files from all calculated structures.

Overview of the dedicated SAMBA module for high-throughput Density Functional Theory calculations. I) Automatic generation of VASP input files (POTCAR, INCAR, KPOINTS, job run) from the generated bilayer POSCAR files. II) Structural optimization performed in three stages: z-scan (to estimate equilibrium interlayer separation), xy-scan (to explore the in-plane potential energy surface for lateral sliding), and full relaxation. III) Electronic structure calculations, including Self-Consistent and Non-Self-Consistent Field, Density of States, and Bader’s Charge calculations. IV) Analysis of raw VASP output files via the open-source post-processor VASProcar code. V) Extraction and organization of relevant information into .json files, including structural parameters, symmetry analysis, twist angle, and key electronic properties. VI) Integration of the structured data into the database hosted on the INCT Materials Informatics platform (midb.cloud).
The DFT calculations were performed within the generalized gradient approximation for the exchange-correlation functional, employing the PerdewBurke-Ernzerhof parametrization75. A fully relativistic pseudopotential within the projector-augmented wave (PAW) method76,77 was used in the self-consistent noncollinear spin-DFT formalism. For the DFT calculations, we employ a plane-wave basis set with an energy cutoff 30% higher than the largest ENMAX value present in the POTCAR file. The Brillouin zone was sampled using a uniform k-point grid with a density of 12.0/Å−1 for electronic structure calculations and 6.0/Å−1 for structural optimization, ensuring total energy convergence within the meV scale. To account for relativistic effects, we performed calculations both including and neglecting spin-orbit coupling. The van der Waals interaction was incorporated using the optB86b functional, which has been reported to provide good accuracy in estimating structural parameters78. A vacuum region of 15 Å was included to prevent unphysical interactions along the stacking direction. During atomic structure relaxation, the force on each atom was constrained to be less than 0.01 eV/Å.
Data availability
The compiled database contains first-principles (DFT) calculations for over 850 twisted bilayers and is actively expanding. It comprises VASP output files, plots of structural and electronic properties, and individual .json files with detailed metadata for each bilayer. This database, titled Twisted 2D van der Waals Homo and Hetero Bilayers, can be directly accessed through the link, being publicly hosted on the INCT – Materials Informatics database (https://midb.cloud/). Additionally, to facilitate data access and manipulation, two aggregated .json files are provided. The first file collects information from all performed DFT calculations, while the second stores the structural metadata of over 18,000 bilayers generated by the SAMBA code. These files are available the link (https://github.com/Augusto-de-Lelis-Araujo/SAMBA-ilum/tree/main/Twisted_2D_vdW_Bilayers_database).
Code availability
The SAMBA code is an open-source, distributed under the GNU General Public License v3.0, and it si available on the Python Package Index (PyPI) as samba-ilum at https://pypi.org/project/SAMBA-ilum/. A tutorial with usage instructions is provided at the link.
References
Novoselov, K. S. et al. Electric field effect in atomically thin carbon films. Science 306, 666–669 (2004).
Sierra, J. F., Fabian, J., Kawakami, R. K., Roche, S. & Valenzuela, S. O. Van der waals heterostructures for spintronics and opto-spintronics. Nat. Nanotechnol. 16, 856–868 (2021).
Yang, H. et al. Two-dimensional materials prospects for non-volatile spintronic memories. Nature 606, 663–673 (2022).
Schaibley, J. R. et al. Valleytronics in 2d materials. Nat. Rev. Mater. 1, 1–15 (2016).
Low, T. et al. Polaritons in layered two-dimensional materials. Nat. Mater. 16, 182–194 (2017).
Cao, Y. et al. Unconventional superconductivity in magic-angle graphene superlattices. Nature 556, 43–50 (2018).
Behera, B., Sutar, B. C. & Pradhan, N. R. Recent progress on 2d ferroelectric and multiferroic materials, challenges, and opportunity. Emergent Mater. 4, 847–863 (2021).
Tran, T. T., Bray, K., Ford, M. J., Toth, M. & Aharonovich, I. Quantum emission from hexagonal boron nitride monolayers. Nat. Nanotechnol. 11, 37–41 (2016).
Haastrup, S. et al. The computational 2d materials database: high-throughput modeling and discovery of atomically thin crystals. 2D Mater. 5, 042002 (2018).
Mounet, N. et al. Two-dimensional materials from high-throughput computational exfoliation of experimentally known compounds. Nat. Nanotechnol. 13, 246–252 (2018).
Wang, X., Zhou, J., Wang, X., Shen, L. & Feng, Y. P. Heterobilayer ferroelectricity with competitive polarization. ACS Nano https://doi.org/10.1021/acsnano.5c11217 (2025).
Pakdel, S. et al. High-throughput computational stacking reveals emergent properties in natural van der waals bilayers. Nat. Commun. 15, 932 (2024).
Dong, R., Jacob, A., Bourdais, S. & Sanvito, S. High-throughput bandstructure simulations of van der waals hetero-bilayers formed by 1t and 2h monolayers. npj 2D Mater. Appl. 5, 26 (2021).
Carr, S. et al. Relaxation and domain formation in incommensurate two-dimensional heterostructures. Phys. Rev. B 98, 224102 (2018).
Dai, Z., Lu, N., Liechti, K. M. & Huang, R. Mechanics at the interfaces of 2d materials: Challenges and opportunities. Curr. Opin. Solid State Mater. Sci. 24, 100837 (2020).
Carr, S. et al. Twistronics: Manipulating the electronic properties of two-dimensional layered structures through their twist angle. Phys. Rev. B 95, 075420 (2017).
Ohm Sauer, M., Meisner Lyngby, P. & Sommer Thygesen, K. Dispersion-corrected machine learning potentials for 2d van der waals materials. arXiv e-prints arXiv–2504 https://arxiv.org/pdf/2504.05754 (2025).
Gerber, E. et al. High-throughput ab initio design of atomic interfaces using intermatch. Nat. Commun. 14, 7921 (2023).
Zhang, Q., Yang, J. & Hu, W. Pyhtstack2d: A python package for high-throughput homo/hetero stacking of 2d materials. Computer Phys. Commun. 312, 109618 (2025).
Martini, L. et al. Scalable high-mobility graphene/hbn heterostructures. ACS Appl. Mater. Interfaces 15, 37794–37801 (2023).
Lee, C.-H. et al. Atomically thin p–n junctions with van der waals heterointerfaces. Nat. Nanotechnol. 9, 676–681 (2014).
Araújo, A. L., de Lima, F. C., Lewenkopf, C. H. & Fazzio, A. Design of spin-orbital texture in ferromagnetic/topological insulator interfaces. Phys. Rev. B 109, 085142 (2024).
Zhou, J. Photo-magnetization in two-dimensional sliding ferroelectrics. npj 2D Mater. Appl. 6, 15 (2022).
Xiao, R.-C. et al. Non-synchronous bulk photovoltaic effect in two-dimensional interlayer-sliding ferroelectrics. npj Computational Mater. 8, 138 (2022).
Zhang, S. et al. Domino-like stacking order switching in twisted monolayer–multilayer graphene. Nat. Mater. 21, 621–626 (2022).
Wang, S. et al. Two-dimensional ferroelectric channel transistors integrating ultra-fast memory and neural computing. Nat. Commun. 12, 53 (2021).
Wu, Z. et al. Intrinsic valley hall transport in atomically thin mos2. Nat. Commun. 10, 611 (2019).
Zhang, T., Xu, X., Huang, B., Dai, Y. & Ma, Y. 2d spontaneous valley polarization from inversion symmetric single-layer lattices. npj Computational Mater. 8, 64 (2022).
Li, L. & Wu, M. Binary compound bilayer and multilayer with vertical polarizations: two-dimensional ferroelectrics, multiferroics, and nanogenerators. ACS Nano 11, 6382–6388 (2017).
Yang, Q., Wu, M. & Li, J. Origin of two-dimensional vertical ferroelectricity in wte2 bilayer and multilayer. J. Phys. Chem. Lett. 9, 7160–7164 (2018).
Wang, C., You, L., Cobden, D. & Wang, J. Towards two-dimensional van der waals ferroelectrics. Nat. Mater. 22, 542–552 (2023).
Peng, R., Ma, Y., Wang, H., Huang, B. & Dai, Y. Stacking-dependent topological phase in bilayer mbi2te4 (m= ge, sn, pb). Phys. Rev. B 101, 115427 (2020).
Xu, B., Deng, J., Ding, X., Sun, J. & Liu, J. Z. Van der waals force-induced intralayer ferroelectric-to-antiferroelectric transition via interlayer sliding in bilayer group-iv monochalcogenides. npj Computational Mater. 8, 47 (2022).
Zhang, Y.-H., Mao, D., Cao, Y., Jarillo-Herrero, P. & Senthil, T. Nearly flat chern bands in moiré superlattices. Phys. Rev. B 99, 075127 (2019).
Wu, F., Lovorn, T., Tutuc, E., Martin, I. & MacDonald, A. Topological insulators in twisted transition metal dichalcogenide homobilayers. Phys. Rev. Lett. 122, 086402 (2019).
Chen, X. et al. Dirac edges of fractal magnetic minibands in graphene with hexagonal moiré superlattices. Phys. Rev. B 89, 075401 (2014).
Sharpe, A. L. et al. Emergent ferromagnetism near three-quarters filling in twisted bilayer graphene. Science 365, 605–608 (2019).
Liu, X. et al. Tunable spin-polarized correlated states in twisted double bilayer graphene. Nature 583, 221–225 (2020).
Cao, Y. et al. Correlated insulator behaviour at half-filling in magic-angle graphene superlattices. Nature 556, 80–84 (2018).
Dean, C. R. et al. Hofstadter’s butterfly and the fractal quantum hall effect in moiré superlattices. Nature 497, 598–602 (2013).
Yankowitz, M. et al. Emergence of superlattice dirac points in graphene on hexagonal boron nitride. Nat. Phys. 8, 382–386 (2012).
Ponomarenko, L. et al. Cloning of dirac fermions in graphene superlattices. Nature 497, 594–597 (2013).
Hunt, B. et al. Massive dirac fermions and hofstadter butterfly in a van der waals heterostructure. Science 340, 1427–1430 (2013).
Woods, C. et al. Commensurate–incommensurate transition in graphene on hexagonal boron nitride. Nat. Phys. 10, 451–456 (2014).
Gjerding, M. N. et al. Recent progress of the computational 2d materials database (c2db). 2D Mater. 8, 044002 (2021).
Shinde, S. M. et al. Stacking-controllable interlayer coupling and symmetric configuration of multilayered mos2. NPG Asia Mater. 10, e468–e468 (2018).
Bertoldo, F. et al. Intrinsic defects in mos2 grown by pulsed laser deposition: from monolayers to bilayers. ACS Nano 15, 2858–2868 (2021).
Balandin, A. A. et al. Superior thermal conductivity of single-layer graphene. Nano Lett. 8, 902–907 (2008).
Lee, C., Wei, X., Kysar, J. W. & Hone, J. Measurement of the elastic properties and intrinsic strength of monolayer graphene. science 321, 385–388 (2008).
Castro Neto, A. H., Guinea, F., Peres, N. M. R., Novoselov, K. S. & Geim, A. K. The electronic properties of graphene. Rev. Mod. Phys. 81, 109–162 (2009).
Han, W., Kawakami, R. K., Gmitra, M. & Fabian, J. Graphene spintronics. Nat. Nanotechnol. 9, 794–807 (2014).
Cabral, A., Galbiatti, H., Kwitko-Ribeiro, R. & Lehmann, B. Platinum enrichment at low temperatures and related microstructures, with examples of hongshiite (ptcu) and empirical ‘pt2hgse3’from itabira, minas gerais, brazil. Terra Nova 20, 32–37 (2008).
Vymazalová, A. et al. Jacutingaite, pt2hgse3, a new platinum-group mineral species from the cauê iron-ore deposit, itabira district, minas gerais, brazil. Can. Mineralogist 50, 431–440 (2012).
Kandrai, K. et al. Signature of large-gap quantum spin hall state in the layered mineral jacutingaite. Nano Lett. 20, 5207–5213 (2020).
Cucchi, I. et al. Bulk and surface electronic structure of the dual-topology semimetal pt2hgse3. Phys. Rev. Lett. 124, 106402 (2020).
Freire, R. L., de Lima, F. C., Miwa, R. H. & Fazzio, A. Exploring topological transport in pt2hgse3 nanoribbons: Insights for spintronic device integration. Phys. Rev. B 110, 035111 (2024).
Andrei, E. Y. & MacDonald, A. H. Graphene bilayers with a twist. Nat. Mater. 19, 1265–1275 (2020).
Sun, X., Xia, Q., Cao, T. & Yuan, S. Sliding ferroelectricity in two-dimensional materials and device applications. Mater. Sci. Eng.: R: Rep. 163, 100927 (2025).
Liu, Y. et al. Van der waals heterostructures and devices. Nat. Rev. Mater. 1, 1–17 (2016).
Wang, Q. & Zhang, H.-L.Two-dimensional Materials for Nonlinear Optics: Fundamentals, Preparation Methods, and Applications (John Wiley & Sons, 2023). https://doi.org/10.1002/9783527838288.
Allain, A., Kang, J., Banerjee, K. & Kis, A. Electrical contacts to two-dimensional semiconductors. Nat. Mater. 14, 1195–1205 (2015).
Novoselov, K. S., Mishchenko, A., Carvalho, A. & Neto, A. H. C. 2d materials and van der waals heterostructures. Science 353, aac9439 (2016).
Koda, D. S., Bechstedt, F., Marques, M. & Teles, L. K. Coincidence lattices of 2d crystals: Heterostructure predictions and applications. J. Phys. Chem. C. 120, 10895–10908 (2016).
Ong, S. P. et al. Python materials genomics (pymatgen): A robust, open-source python library for materials analysis. Computational Mater. Sci. 68, 314–319 (2013).
Togo, A., Shinohara, K. & Tanaka, I. Spglib: a software library for crystal symmetry search. Sci. Technol. Adv. Mater.: Methods 4, 2384822 (2024).
Kabsch, W. A solution for the best rotation to relate two sets of vectors. Found. Crystallogr. 32, 922–923 (1976).
Kuhn, H. W. The hungarian method for the assignment problem. Nav. Res. Logist. Q. 2, 83–97 (1955).
Hohenberg, P. & Kohn, W. Inhomogeneous elec2dbtron gas https://doi.org/10.1103/PhysRev.136.B864 (1964).
Kohn, W. & Sham, L. J. Self-consistent equations including exchange and correlation effects. Phys. Rev. 140, A1133–A1138 (1965).
Kresse, G. & Furthmüller, J. Efficiency of ab-initio total energy calculations for metals and semiconductors using a plane-wave basis set. Computational Mater. Sci. 6, 15 – 50 (1996).
Kresse, G. & Furthmüller, J. Efficient iterative schemes for ab initio total-energy calculations using a plane-wave basis set. Phys. Rev. B 54, 11169–11186 (1996).
Wang, V., Xu, N., Liu, J.-C., Tang, G. & Geng, W.-T. Vaspkit: A user-friendly interface facilitating high-throughput computing and analysis using vasp code. Computer Phys. Commun. 267, 108033 (2021).
Bader, R. F. W.Atoms in Molecules: A Quantum Theory (Oxford University Press, 1990). https://doi.org/10.1093/oso/9780198551683.001.0001.
Araújo, A. L. & Maciel, R. P. VASProcar: Python tools for DFT calculations https://doi.org/10.5281/zenodo.6343960 (2023).
Perdew, J. P., Burke, K. & Ernzerhof, M. Generalized gradient approximation made simple. Phys. Rev. Lett. 77, 3865 (1996).
Blöchl, P. E. Projector augmented-wave method. Phys. Rev. B 50, 17953–17979 (1994).
Corso, A. D. Projector augmented-wave method: Application to relativistic spin-density functional theory. Phys. Rev. B 82, 075116 (2010).
Klimeš, J., Bowler, D. R. & Michaelides, A. Van der waals density functionals applied to solids. Phys. Rev. B—Condens. Matter Mater. Phys. 83, 195131 (2011).
Acknowledgements
The authors acknowledge financial support from the Brazilian agencies FAPESP (grants 23/12336-5, 23/09820-2 and FAPESP-CEPID 24/00989-7), CNPq (INCT - Materials Informatics) grant 157793/2025-7, and LNCC (Laboratório Nacional de Computação Científica) for computer time (Project didmat).
Author information
Authors and Affiliations
Contributions
A.L.A. performed the calculations and implemented the SAMBA code. P.H.S. contributed to parts of the code implementation. A.L.A., F.C.L., and A.F. contributed to the writing and revision of the manuscript. F.C.L. and A.F. supervised the project.
Corresponding authors
Ethics declarations
Competing interests
The authors declare no competing interests.
Additional information
Publisher’s note Springer Nature remains neutral with regard to jurisdictional claims in published maps and institutional affiliations.
Supplementary information
Rights and permissions
Open Access This article is licensed under a Creative Commons Attribution 4.0 International License, which permits use, sharing, adaptation, distribution and reproduction in any medium or format, as long as you give appropriate credit to the original author(s) and the source, provide a link to the Creative Commons licence, and indicate if changes were made. The images or other third party material in this article are included in the article’s Creative Commons licence, unless indicated otherwise in a credit line to the material. If material is not included in the article’s Creative Commons licence and your intended use is not permitted by statutory regulation or exceeds the permitted use, you will need to obtain permission directly from the copyright holder. To view a copy of this licence, visit http://creativecommons.org/licenses/by/4.0/.
About this article

Cite this article
Araújo, A.L., Sophia, P.H., Crasto de Lima, F. et al. A high-throughput framework and database for twisted 2D van der Waals bilayers. npj Comput Mater 12, 40 (2026). https://doi.org/10.1038/s41524-025-01892-z
Received:
Accepted:
Published:
Version of record:
DOI: https://doi.org/10.1038/s41524-025-01892-z
