
Abstract
Breast cancer remains a major global health challenge1. Here, to comprehensively characterize its genomic landscape and the clinical significance of genomic characteristics, we analysed whole-genome sequences from 1,364 clinically annotated breast cancers, with transcriptome data available for most cases. Our study expands the repertoire of oncogenic alterations and identifies novel driver genes, recurrent gene fusions, structural variants and copy number alterations. Timing analyses on copy number alterations suggest that genomic instability emerges decades before tumour diagnosis, and offer insights into early initiation of tumorigenesis. Pattern-driven genomic features, including mutational signatures2, homologous recombination deficiency3, tumour mutational burden and tumour heterogeneity scores4, were associated with clinical outcomes, highlighting their potential utility as predictive biomarkers for clinical evaluation of treatments such as CDK4/6 and HER2 inhibitors, as well as adjuvant and neoadjuvant chemotherapy. These findings highlight the power of large-scale, clinically annotated whole-genome sequencing in advancing our understanding of how genomic alterations shape patient outcomes.
Main
Breast cancer remains a substantial global health challenge, and possesses significant molecular and clinical heterogeneity1. Over the past few decades, advances in understanding of genomic drivers have led to improved treatment modalities, including targeted therapies and immunotherapies5. However, recurrence and metastasis of breast cancers remain common, underscoring the need for a deeper understanding of the biology. Recent advances in genomic technology serve as essential assets to unravel the genetic complexities of breast cancer, facilitating personalized treatment approaches to improve outcomes.
Despite previous valuable insights, the molecular landscape of breast cancer remains partially understood. Traditional methods, such as targeted sequencing approaches, mostly focus on individual mutations in known cancer genes, and miss significant information outside the targets and other pattern-based markers6, such as most genomic rearrangements, copy number alterations and mutational signatures7. In this context, whole-genome sequencing (WGS) is a comprehensive alternative technique that captures the full spectrum of genomic changes and offers an unbiased view of cancer genomes3,8, enabling biological discovery and the exploration of potential biomarkers for future clinical application.
Over the past few decades, academic-driven cancer genome research has analysed more than 10,000 cancer genomes across diverse cancer types8,9,10. Although these studies have identified and archived many genomic mutations, their clinical significance often remains unclear owing to insufficient integration of clinical records. To maximize the real-world impact of genome sequencing, it will be essential to integrate genomic data with comprehensive medical records, including treatment responses, disease recurrence and long-term clinical outcomes11.
To this end, we sequenced and analysed the whole genomes of 1,364 breast cancers from a Korean cohort in combination with full medical records. To our knowledge, this cohort—referred to as CUBRICS cohort—is the largest of its kind to date (Supplementary Methods, Supplementary Fig. 1 and Supplementary Table 1). In addition to WGS, transcriptome sequencing data were incorporated for most cases (n = 1,209; 88.6% of cases), which enabled stratification of these cancers into five prediction analysis of microarray 50 (PAM50) subtypes (luminal A, luminal B, HER2-enriched, basal-like and normal-like)12 and tracking the expression of acquired genomic variants. The cohort is characterized by a younger median age (44 years) and lower proportions of oestrogen receptor-positive (ER+)/luminal A subtypes compared with breast cancer cases in Western countries, making it a distinct population for investigation13,14,15 (Supplementary Discussion 1).
Mutational landscapes and cancer drivers
From the 1,364 whole-genome sequences, we identified 10,929,118 somatic mutations, which include 8,935,132 single nucleotide variants (SNVs), 1,785,446 indels and 208,540 structural variants with a substantial variation in their burden per sample (Extended Data Fig. 1 and Supplementary Figs. 2 and 3 present the full oncogrid plots; interactive exploration of the genomic variants is also possible at https://open.cancervision.com). The median tumour mutational burden (TMB) was 4,742 (interquartile range (IQR) 2,392–8,842), with subtype-specific medians as follows: luminal A, 2,182 (IQR 1,628–2,841); luminal B, 4,027 (IQR 2,376–7,392); HER2-enriched, 6,737 (IQR 4,076–14,213); and basal-like, 8,360 (IQR 5,296–11,504). Basal-like tumours had the highest TMB, as previously reported16.
By applying the IntOGen pipeline17, we identified 41 breast cancer driver genes (Methods), including 4 novel driver genes in addition to classical drivers such as TP53, PIK3CA and GATA33 (Fig. 1 and Extended Data Fig. 2). For example, BCL11B, which encodes a transcription factor that is involved in chromatic remodelling, gene regulation and mammary stem cell self-renewal18,19, was mutated in 23 patients at much higher frequency than random expectation. Similarly, RREB1, which encodes a zinc finger transcription factor that regulates Ras and TGFβ signalling and directly binds the p53 promoter20,21,22, was truncated in 26 patients, suggesting that its disruption could affect oncogenic pathways. Our data also suggest that RAF123 and SPECC124 (both were mutated in five patients) act as tumour suppressors, with potential roles in tumour initiation and progression.
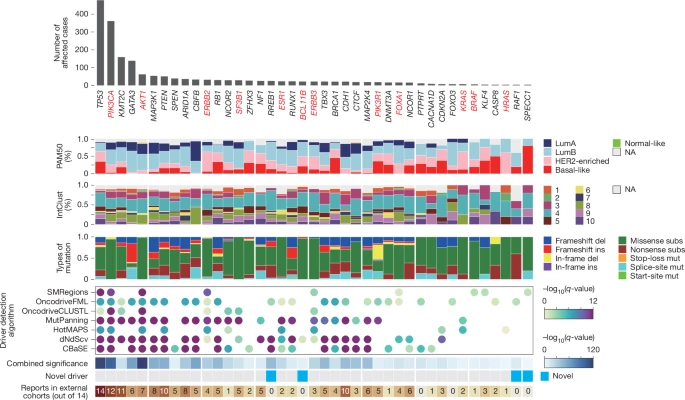
Seven driver gene identification algorithms (SMRegions, OncodriveFML, OncodriveCLUSTL, MutPanning, HotMAPS, dNdScv and CBaSE) were applied to identify protein-coding driver genes, generating a combined significance score and identifying 41 driver genes in breast cancer. Top to bottom: the number of affected cases for each gene, ranked by mutation frequency across the cohort; PAM50 subtype for each mutated gene; integrative clusters (IntClust) subtype for each mutated gene; types of point mutations; results from the seven driver gene detection algorithms; a combined significance score, summarizing the overall support for each gene as a driver; genes that were not observed in any external dataset were classified as putative novel drivers, highlighted in blue; and the number of external breast cancer cohorts (out of 14) in which each gene was reported. Del, deletion; ins, insertion; LumA, luminal A; lumB, luminal B; NA, not available; mut, mutation; subs, substitution.
Tumours with TP53 mutations frequently exhibited genomic instability25, characterized by higher ploidy and increased homologous recombination DNA repair deficiency (HRD) for double-strand DNA breaks (Extended Data Fig. 3a,b). TP53 mutations were positively associated with the level of intratumour genetic heterogeneity (calculated by mutant allele tumour heterogeneity (MATH) scoring with tumour WGS4), particularly in basal-like subtypes (Extended Data Fig. 3c shows MATH scores associated with different TP53 mutations), indicating more active late-stage mutagenesis and emergence of potent subclones in TP53-mutant tumours. Notably, higher MATH scores were associated with poorer overall survival, particularly in TP53-mutant tumours (hazard ratio 1.66, 95% confidence interval 1.08–2.74; P = 0.048; Extended Data Fig. 3d,e), suggesting that intratumoural heterogeneity, as measured by MATH score, is associated with clinical outcomes and deserves further investigation as a potential prognostic factor. The prognostic effect of the MATH score was further demonstrated in the METABRIC cohort of 1,670 participants26 (Extended Data Fig. 3f and Supplementary Discussion 2).
Key mutational signatures
To systematically explore the mutational processes that shape alterations in breast cancer genomes, we performed a comprehensive mutational signature analysis2 (Methods, Supplementary Discussion 3 and Supplementary Fig. 4). We identified various signatures, including 17 SNV signatures, 9 insertion–deletion mutation (indel) signatures and 6 structural variant signatures (Fig. 2a; reference mutational signatures are available at https://cancer.sanger.ac.uk/signatures/). Signatures with clock-like properties, such as SBS5, ID1 and ID2, were present in nearly all samples, and accounted for a substantial proportion (more than 10%) of somatic mutations. By contrast, some mutational signatures contributed to a high number of mutations in only a subset of samples, suggesting hyper-mutagenicity that was restricted to the affected tumours. For examples, mutational processes attributable to polymerase epsilon exonuclease domain mutations (SBS10a and SBS10b) and defective DNA mismatch repair (SBS21 and SBS44) were observed in four cases with an extremely high TMB (more than 100,000; Supplementary Fig. 5).

a, Distribution of mutational signatures across breast cancer subtypes. Top, number of mutations per signature for individual samples. Bottom, heat map showing the percentage of individuals within each subtype for whom a signature contributes more than 10% of total mutations. b, Correlation between signatures based on Pearson’s correlation coefficient. c, HRD score distribution (top) and receiver operating characteristic curve for predicting germline BRCA1 and BRCA2 mutations (bottom). d, Distribution of HRD and HRP cancers across all samples and subtypes; outer tracks indicate germline or somatic homologous recombination pathway mutations. e, Germline and somatic mutations in the homologous recombination pathway in cases with HRD. f, Disease-free survival (DFS) in patients with TNBC according to homologous recombination pathway status after adjuvant anthracycline–cyclophosphamide chemotherapy. Left, Kaplan–Meier curves for HRD versus HRP. Right, multivariate Cox proportional hazards regression (two-sided Wald test, no adjustment for multiple comparisons; n = 89). Error bars indicate 95% confidence intervals (CIs) and the centre dot is defined as the hazard ratio. g, Distribution of germline deletion of APOBEC3A/3B in our cohort (left), a healthy Korean population (middle) and Europeans with breast cancer (right). h, TMB (left), ratio of C>G and C>T mutations in YpTpCpA versus RpTpCpA contexts (middle) and sequence logo plots for C>T and C>G mutations at TC sites (right) in carriers of APOBEC3A/3B germline deletions. nYTCA and nRTCA represent the number of mutations occuring in YpTpCpA and RpTpCpA sequence contexts, respectively. Box plots indicate median (middle line), first and third quartiles (box edges) and 1.5× IQR (whiskers). P values were calculated using a two-sided Student’s t-test. Het, heterozygote; hom, homozygote; WT, wild type. i, APOBEC3A/3B germline status according to APOBEC mutational signature. Bars indicate the proportion of germline status in groups (n = 30) ordered by signature intensity. In all panels, n refers to the number of participants.
Mutational signatures associated with HRD3,27, including SBS3, SBS8, ID6, SV3 and SV5, are of particular interest, as they are potential WGS-based biomarkers for poly(ADP-ribose) polymerase inhibitors (Fig. 2b,c). The combined estimated HRD scores (Methods) showed a clear bimodal distribution (Fig. 2c), identifying 315 cases as HRD in the CUBRICS cohort (23.1%, 315 out of 1,364; Fig. 2d and Supplementary Fig. 6). Although it is highly enriched in the basal-like cancers (72.2%, 182 out of 252), HRD was also present in other subtypes (Fig. 2d). Out of the 315 cases identified as HRD, we identified causal pathogenic variants on genes in the homologous recombination pathway in 130 cases (41.3%, 130 out of 315), including 90 with germline defects (28.6%, 90 out of 315) and 40 (17.8%, 40 out of 225) with only somatically acquired defects (Supplementary Discussion 4, Supplementary Fig. 7 and Supplementary Table 2). Although germline pathogenic variants predominantly inactivated BRCA1 and BRCA2, somatic mutations most frequently truncated RAD51B, primarily by genomic rearrangements rather than point mutations (Fig. 2e).
The CUBRICS cohort included 89 patients with triple-negative breast cancer (TNBC) with a treatment history of adjuvant chemotherapy containing anthracycline–cyclophosphamide (Supplementary Table 3). Individuals with HRD (n = 66) exhibited significantly superior disease-free survival compared with those with homologous recombination DNA repair-proficient (HRP) cancer (hazard ratio 0.10, 95% confidence interval 0.02–0.54; P = 0.006; Fig. 2f); this difference was more pronounced than in a previous study with a targeted panel-based assay28, highlighting the potential of WGS for more specific clinical evaluation of HRD.
APOBEC-associated mutational signatures (SBS2 and SBS13; Fig. 2b) were widespread in breast cancers, contributing more than 10% of somatic SNVs in 633 samples. Of these, 12 samples were hypermutators with APOBEC-associated mutational processes, with TMB of more than 50,000. A germline deletion involving APOBEC3A and APOBEC3B (APOBEC3A/B), which effectively generates APOBEC3A–APOBEC3B fusion transcripts, has been suggested to predispose to APOBEC-mediated hypermutations29 (Extended Data Fig. 4a). Of note, the population allele frequency of the germline deletion was 31.8% in our cohort (present in 736 individuals, 131 being homozygous and 605 heterozygous; Fig. 2g and Extended Data Fig. 4b), significantly higher than the frequency in the European population29 (31.8% versus 8.5%; P < 0.001 by two-sided chi-square test), suggesting an East Asian origin. Contrary to previous reports30,31, the deletion was not substantially enriched in patients with breast cancer compared with the background Korean population (51.0%, 844 out of 1,654 individuals, with 150 being homozygous and 694 heterozygous; P = 0.276 by two-sided chi-square test; Fig. 2g), suggesting that it is not a strong cancer-predisposing germline variant. However, carriers exhibited reduced APOBEC3B expression (Extended Data Fig. 4c), significantly higher TMB (median 4,325 in wild type versus median 5,148 in carriers; P < 0.001; Fig. 2h) and APOBEC-associated signatures (SBS2, SBS13 and ID9; Extended Data Fig. 4d) in cancers. In addition, wild-type individuals were substantially depleted in the APOBEC hypermutator cancers (10.0% in the top 30 cases versus 46.9% in others; P < 0.001 by two-sided Fisher’s exact test; Fig. 2i). APOBEC-deletion carriers showed an enrichment of APOBEC-associated mutations in the YpTpCpN context than in the RpTpCpN context (where Y represents pyrimidine, R represents purine and the mutated cytosine is underlined; Fig. 2h).
Frequently rearranged genes
A key mutational process in cancer is structural variation, which acts to amplify, delete or reorder chromosomal material at scales that range from single genes to entire chromosomes32. To determine the structural variation landscape, we generated a DNA interaction map between 5-Mb segments across the entire genome (Fig. 3a), along with large-scale copy number amplification patterns (CNAs; G-score). Of the 208,540 structural variation events, local intrachromosomal (<5 Mb) rearrangements were predominant (162,988 out of 208,540, 78.2%), but reshuffling of genomic materials between distal intrachromosomal or interchromosomal regions were also observed (45,266 out of 208,540, 21.7%). Some of the rearrangements were observed more frequently than random. For example, 15 breast cancers carried an interchromosomal translocation between chromosomes 8 and 11, which brought CCND1, and ZNF703 and FGFR1 (ZNF703/FGFR1) into close proximity (mostly luminal B type; 73.3%, 11 out of 15; Fig. 3a, top left). Of note, the interaction was observed in lung cancer33, and was also reported to be associated with reduced benefit from aromatase inhibitors in metastatic breast cancer34. Consistent with these findings, tumours with these rearrangements exhibited distinct transcriptomic profiles, including upregulation of tumour progression-related pathways such as TNF, TGFβ signalling and epithelial–mesenchymal transition, as well as metabolic reprogramming (Extended Data Fig. 5).

a, Genome-wide structural variation (SV) and copy number variation (CNV) landscape. Top, interchromosomal and intrachromosomal structural variant interactions across 5-Mb windows. Frequent events between chr. 8 and chr. 11 (top left) and between chr. 17 and chr. 20 (top right) are highlighted. Middle, number of samples with structural variants or super-enhancers (SEs) per window. Bottom, recurrent CNVs identified by GISTIC. b, Distribution of distal structural variant breakpoints (BPs) within 1 Mb of ERBB2 (grey) and breast cancer-specific super-enhancers (red). c, Structural variant breakpoint density within 1 Mb of ERBB2. Peaks at −99.0 kb (5′) and +91.7 kb (3′) indicate clustering near the gene. d, Effect of extragenic structural variations (<1 Mb from gene) on RNA expression. Genes with significant upregulation (log2(fold change) ≥ 1, q < 0.10) are highlighted. Dot size reflects the number of affected samples. e, CCF of extragenic structural variants affecting genes highlighted in d. f, Permutation test (10,000 iterations) shows that structural variant breakpoints (from d) are closer to super-enhancers than expected by chance (two-sided; P = 0.001). g, Left, genes that are downregulated by intragenic structural variants (q < 0.10). Well-known tumour suppressors (RB1, PTEN and RUNX1) are shown in bold. Right, PAM50 subtype distribution. h, Recurrent gene fusions (occurring in at least four participants). Number of patients and whole-transcriptome sequencing (WTS) support (left), and CCF (middle) and PAM50 (right) subtype for each fusion. i, NRG1 fusions in 17 patients in our cohort. Protein domain architecture of the N-terminal fusion partner and C-terminal NRG1 are shown. CCF values indicate the clonality of each fusion event. ADAM CR, ADAM family cysteine-rich domain; Del, deletion; DNA pol A exo 1, exonuclease 1 domain; Dup, duplication; glyco tran 10 N, glycosyltransferase family 10 domain; glyco transf 64, glycotransferase 64 domain; guanylate cyc 2, guanylate cyclase 2 domain; Inv, inversion; I-set, immunoglobulin-like domain; KH1, KH-type RNA-binding domain 1; Tra, translocation.
Another frequent interchromosomal translocation involved the ERBB2 locus on chromosome 17 and a locus on chromosome 20 (observed in 30 participants), where breast cancer super-enhancers were enriched35 (Fig. 3a, top right). Structural variations can influence transcription by disrupting enhancer–promoter interactions, chromatin topology and long-range regulatory elements36. In line with this idea, structural variations involving the ERBB2 locus were clustered with super-enhancers genome-wide (P = 0.028 by permutation test; Fig. 3b), which translocated super-enhancers in about 90 kb from the ERBB2 locus (Fig. 3c). Tumours with extragenic structural variants in the vicinity (within 1 Mb) showed significantly higher ERBB2 gene expression levels than their gene copy number (log2 fold change >1, q-value <0.10; Fig. 3d). They often carried extragenic structural variants in the vicinity (within 1 Mb) with a cancer cell fraction (CCF) of approximately 1 (Fig. 3e), and distal breakpoints significantly enriched near breast cancer-specific super-enhancers35 (Fig. 3f). Our observation overall suggests a possible enhancer-hijacking mechanism for transcriptional activation in breast cancer genomes.
In addition, we found gene truncation events associated with structural variation. A total of 28 genes, including the well-established tumour suppressors RB1, PTEN and RUNX1, exhibited significant downregulation due to gene-truncating structural variants, reinforcing their tumour suppressor role in breast cancer (Fig. 3g).
Although recurrent fusion oncogenes are considered rare in breast cancer37, we identified several recurrent fusion events (Fig. 3h and Extended Data Figs. 6 and 7). In luminal-type breast cancers, frequent fusion genes were MIPOL1–TTC6 (n = 9), CEP112–PRKCA (n = 6) and CCDC170–ESR1 (n = 6). In basal-like breast cancers, BCL2L14–ETV6 (n = 12), AGO2–PTK2 (n = 6) and BRD4–NOTCH3 (n = 6) were recurrent. Of note, CCDC170–ESR1 has been implicated in endocrine therapy resistance and metastasis in breast cancers38 and BCL2L14–ETV6 has been linked to increased invasiveness and paclitaxel resistance39. The fraction of variant-supporting reads suggests that most of the fusion events are clonal or near-clonal, implicating them in tumour initiation.
In the gene-level analysis, NRG1, which encodes a small ligand of ERBB family kinase receptors, was frequently affected by 166 structural variants in 110 cases (8%, 110 out of 1,364; Extended Data Fig. 8; top 2). Although gene disruption was the most frequent outcome (72.9%, 121 out of 166 structural variants), oncogenic fusions were sometimes formed with various partner genes40 (n = 17; Fig. 3i), collectively sixfold more frequently than previous reports41 (1.25% versus 0.2%). Of note, the EGF-like domain of NRG1 was retained in all 17 fusion cases, supporting their oncogenic effect.
Hotspots of focal amplifications
Focal amplification, which increases the copy number of short-segment DNA (typically up to 3 Mb in size, with a copy number gain greater than 3 compared with flanking regions), is a prominent signature in many human cancers42,43. To explore these events in breast cancers, we calculated the recurrence score of focal amplifications across the genome, referred to as F-score (Fig. 4a). The most prominent peaks were observed at chromosome 8 (chr. 8):35–40 Mb, chr. 11:65–70 Mb and chr. 17:35–40 Mb, which included ZNF703 (chr. 8; n = 124; 9.1%) and FGFR1 (chr. 8; n = 107; 7.8%), CCND1 (chr. 11; n = 108; 7.9%) and ERBB2 (chr. 17; n = 255; 18.7%), respectively (Fig. 4b and Extended Data Fig. 9a). Notably, ZNF703 exhibited higher amplification levels than FGFR1 on chromosome 8, suggesting its oncogenic role in breast cancer.

a–h, Focal CNAs, particularly ERBB2, and their clinical relevance. i–l, CNAs and their temporal dynamics with implications for therapeutic resistance. a, Genome-wide F-score plots highlight recurrent focal amplifications at chromosomes 8, 11 and 17. Orange rings indicate regions that are frequently amplified as ecDNA. b, Copy number profiles at the three major focal peaks. Black lines show mean copy number and grey shading indicates 95% confidence intervals. c, Amplification mechanisms of the oncogenes in b. BFB, breakage–fusion bridge. d, Distribution of PAM50 subtype, ERBB2 amplification type, copy number and expression across HER2 IHC and fluorescence in situ hybridization (ISH) groups. Amp, amplification. e, Clinicogenomic profiles of 75 HER2-positive breast cancers treated with neoadjuvant docetaxel–carboplatin–trastuzumab–pertuzumab (TCHP), stratified by pCR (n = 38) and non-pCR (n = 37). The top 10 most mutated genes are shown. ChT, chromothripsis; PR, progesterone receptor. f, Sankey plots showing associations of HER2 IHC 3+, ERBB2 copy number ≥33 and ecDNA status with pCR (two-sided chi-square test). g, Performance metrics comparing HER2 IHC 3+, ERBB2 copy number ≥33 and chromothripsis for predicting pCR. CN, copy number; LR, likelihood ratio; OR, odds ratio. h, Chromothripsis frequency in pCR versus non-pCR groups (two-sided chi-square test). i, Prognostic effect of 9p23 amplification in basal-like breast cancer. n = 252. Top, Kaplan–Meier overall survival. Bottom, multivariate Cox regression. Two-sided Wald test without adjustment for multiple comparisons. Error bars indicate 95% confidence intervals and the centre dot is defined as the hazard ratio. j,k, Circos plots and CNA timing curves for two cases with HRD: a triple-negative tumour (j) and a hormone receptor-positive tumour with a germline BRCA1 1-bp deletion (k). l, Integrative Genomics Viewer snapshot for patient 703, showing a somatic 8-bp deletion overlapping a germline 1-bp deletion in BRCA1 exon 14, which is likely to restore the reading frame. In all panels, n refers to the number of participants.
Gene expression levels of the oncogenes positively correlated with gene copy number in a dose-dependent manner (Extended Data Fig. 9b). Notably, ERBB2 expression exhibited mutual exclusivity with the other oncogenes, suggesting a redundant oncogenic mechanism between ERBB2 and the other three genes in breast tumorigenesis (Extended Data Fig. 9c). However, CCND1 and ZNF703/FGFR1 loci displayed a positive correlation in RNA expression, in line with their co-rearrangement as previously discussed (Fig. 3a).
Of note, more than 40% of the ERBB2, FGFR1, ZNF703 and CCND1 focal amplifications were formed by extrachromosomal DNA (ecDNA) (Fig. 4c), suggesting that ecDNA is the primary mechanism of focal amplification42,44. Overall, 387 cancer tissues (28.4%, 387 out of 1,364) carried ecDNA, whose location was tightly correlated with F-score (Fig. 4a).
Clinical effect of ERBB2 focal gain
Immunohistochemistry (IHC) targeting HER2 protein, encoded by ERBB2, is a gold standard technique for clinical detection of HER2-positive breast cancers45. In our cohort, as expected, HER2 IHC correlated with, but did not completely overlap with PAM50 subtypes or ERBB2 gene copy number gains (Fig. 4d). For example, ecDNA-derived focal amplification of ERBB2 (copy number 68) was observed in a case with HER2 IHC 0 (Extended Data Fig. 9d). Conversely, we also observed a case with HER2 IHC 3+ without obvious ERBB2 amplification (Extended Data Fig. 9e). The PAM50 subtype of this case was not HER2-enriched but luminal B, with ERBB2 transcription markedly lower (transcripts per million (TPM) = 43.5) than typically observed in HER2 IHC 3+ tumours (mean TPM = 692.0), but similar to HER2 IHC 0 tumours (Extended Data Fig. 9e).
Then, we evaluated whether these genome and transcriptome data can predict treatment responses in HER2-positive cancer. Out of 75 individuals with HER2-positive tumours who received neoadjuvant TCHP regimens (docetaxel (microtubule inhibitor), carboplatin (platinum intercalator), trastuzumab and pertuzumab (anti-HER2 inhibitors)), 38 showed pathologic complete response (pCR) (Fig. 4e and Supplementary Table 4). Although cases without pCR (n = 37) were characterized by a higher prevalence of luminal subtypes (P < 0.001, two-sided Fisher’s exact text), hormone receptor positivity (P = 0.001, two-sided chi-square test) and PIK3CA mutations (P = 0.003, two-sided chi-square test), cases with pCR (n = 38) exhibited significantly higher ERBB2 expression (P < 0.001, two-sided Student’s t-test) and a greater frequency of ERBB2 focal amplification (P = 0.001, two-sided Fisher’s exact test; Extended Data Fig. 9f–h (external validation in the TransNEO cohort46)). Although HER2 IHC 3+ was a sensitive biomarker for pCR (36 out of 38, 94.7%), ERBB2 copy number (n ≥ 33; Extended Data Fig. 9i,j) demonstrated higher precision (30 out of 38, 78.9%; Fig. 4f). Overall, ERBB2 copy number provided a complementary performance, with higher prediction in specificity, precision, and likelihood ratio (Fig. 4g).
Of note, ecDNA is generally associated with poor prognosis across multiple cancer types47. Notably, in our cohort, tumours with ERBB2 copy number of 33 or more were significantly more likely to be ecDNA-positive (P = 0.003; Fig. 4f, right); however, ERBB2 amplification by ecDNA was not associated with pCR rates (P = 0.540). Our observation suggests that absolute copy number. rather than the amplification mechanism, may be a more relevant predictor of therapeutic response. It also indicates that ERBB2-amplifying ecDNA may be an actionable target for anti-HER2 therapy.
Further, we observed a significant enrichment of chromothripsis events, a complex genomic rearrangement with catastrophic chromosomal shattering and erroneous reassembly, in cases with pCR48 (71.1% versus 43.2%; Fig. 4e,h and Supplementary Fig. 8). Adding chromothripsis to cancer stratification improved the precision and specificity of predicting responses to TCHP (Fig. 4g, Extended Data Fig. 9k and Supplementary Discussion 5).
Long-segmental copy number gains
Along with focal amplifications, long-segmental amplifications (typically larger than 1 Mb), often chromosome- or arm-level alterations, were common in breast cancers (Fig. 3a). The timing analysis with the burden of co-amplified, pre-amplification somatic base substitutions yielded the acquisition timing of the frequent long-segmental CNAs in breast cancer in molecular time49 (Extended Data Fig. 10). Most of the recurrent long-segmental CNAs were acquired by 20% of molecular time, when recent common ancestral cells of a cancer emerge, which should be decades earlier than tumour diagnosis. This implies that acquisition of the long-segmental CNAs is an early evolutionary event in breast cancer, which is presumably acquired in early puberty, consistent with a previous report50. Our findings also suggest that full neoplastic transformation can take decades from the first event of genomic instability.
The most common CNAs occurred at 8q21.13, with a relative timing of 0.15 (IQR 0.08–0.25) and a median copy number gain of 5.5 (IQR 4.0–8.0). This amplification was associated with poor overall survival (hazard ratio 1.67, 95% confidence interval 1.09–2.55; P = 0.019). This region contains the MYC oncogene, which has been linked to treatment resistance and poor survival across various solid tumours, including breast cancer51.
Of note, CNAs of 9q23 (n = 40), occurring at a relative timing of 0.13 (IQR 0.09–0.25), were enriched in basal-like cancers and exhibited poor overall survival in the subtype (hazard ratio 2.45, 95% confidence interval 1.16–5.18; P = 0.019; Fig. 4i and Supplementary Table 5). External validation in the METABRIC cohort confirmed this trend52 (Extended Data Fig. 11a,b and Supplementary Table 6). The 9p23 gain was associated with 823 differentially expressed genes genome-wide (282 upregulated and 531 downregulated; Extended Data Fig. 11c), including PSIP1, which has been reported to be negatively correlated with survival of patients with TNBC53.
Late-stage CNA acquisitions were more frequently observed in HRD breast cancers (P < 0.001; Extended Data Fig. 11d,e). This implies that the rate of large-segmental CNAs is accelerated when a tumour cell acquires the HRD phenotype. For instance, in one case with HRD (no. 635; Fig. 4j), the rate of CNA acquisition was substantially increased from about 75% of the molecular time, which we speculate is the time of complete inactivation of the homologous recombination-mediated DNA repair pathway.
By contrast, in another case with HRD (no. 703; Fig. 4k), there was no such late CNA acquisition stage. The cancer developed talazoparib resistance after ten months of the second-line palliative treatment. In line with the resistance, post-therapy cancer genome exhibited an 8-bp deletion in the vicinity of the germline 1-bp deletion in BRCA1, which is likely to have converted an HRD tumour back to HRP (Fig. 4l). From the timing analysis (Fig. 4k, bottom), we believe that the rescuing mutation could be acquired in about 50% of the molecular time in one of the cells in the primary cancer tissue, which could lead to talazoparib resistance.
Potential biomarkers from whole genomes
Finally, we explored the potential utility of whole-genome results by integrating genomic profiles and clinical records. First, we observed that an increased MATH score, which is indicative of higher intratumoural heterogeneity, was associated with worse progression-free survival (PFS) in first-line anti-HER2 therapies against HER2-positive breast cancer. In our cohort, 45 patients who received the therapy showed a median PFS of 1.08 years (range 0.14–9.96 years; as of 15 November 2023; Fig. 5a and Supplementary Table 7). Individuals with a high MATH score (≥40; cut-off with the median MATH score) exhibited worse PFS compared to those with a MATH score below 40 (hazard ratio 2.95, 95% confidence interval 1.48–5.91; P = 0.002; Fig. 5b,c).

a–c, Swimmer plot (a), Kaplan–Meier curves (b) and multivariate Cox proportional hazard analysis (c) comparing PFS according to MATH score in patients with HER2-positive breast cancer who received first-line anti-HER2 treatment as palliative treatment. a, Patients are stratified into two groups: MATH < 40 (n = 27) and MATH ≥ 40 (n = 18). Bars represent individual patients, with progression events indicated in yellow. Bottom, clinicopathologic and genomic features, including treatment regimen, ER and PR expression status, ERBB2 transcript expression as copy number (CN) gain and TPM, Ki67 index, tumour ploidy, HRD score and MATH score. L, lapatinib; Pro, prospective; retro, retrospective; T, taxane; TP, taxane plus platinum. d, Genomic and molecular characteristics of patients with hormone receptor-positive breast cancer (n = 57) treated with first-line CDK4/6 inhibitors (CDK4/6i), stratified by progression status. Top panel displays patient recruitment type, CDK4/6i regimen, PAM50 subtype, Ki67 expression, ploidy, MATH score, TMB and HRD score. Bottom, somatic mutations in recurrently altered cancer-related genes. e, Kaplan–Meier survival curves comparing PFS between individuals with high versus low TMB. f, Kaplan–Meier survival curves comparing PFS between HRD and HRP cases. g, Multivariate Cox proportional hazards analysis. The model accounts for potential correlations between TMB and HRD by incorporating a HRD:TMB interaction term. Multivariate Cox proportional hazards analysis was performed using a two-sided Wald test. Error bars indicate 95% confidence intervals, with the centre dot defined as the hazard ratio. AI, aromatase inhibitor; GNRH, gonadotrophin-releasing hormone; SERD, selective oestrogen receptor degrader. In all panels, n refers to the number of participants included in the analysis.
Similarly, we identified high TMB, and HRD scores were associated with worse PFS in CDK4/6 inhibitor plus endocrine therapy, a first-line palliative treatment recently developed for hormone receptor-positive breast cancer54 (Fig. 5d–g). In a total of 57 patients receiving the regimens, individuals with a high TMB (≥1.7 per Mb, cut-off with the median TMB) exhibited poor PFS (hazard ratio 2.55, 95% confidence interval 1.26–5.16; P = 0.009; Fig. 5d,e). Thirteen out of the 57 patients exhibited HRD, 85% of whom experienced progression, resulting in a shorter PFS than those with HRP (hazard ratio 4.20, 95% confidence interval 1.91–9.25; P < 0.001; Fig. 5f and Supplementary Table 8). Multivariate Cox proportional hazards analysis indicated HRD as the single most significant factor predicting favourable PFS to the treatment (hazard ratio 10.20, 95% confidence interval 1.68–61.80; P = 0.012; Fig. 5g), warranting validation in larger, prospective studies. In gene set enrichment analysis (GSEA), these HRD tumours showed significant enrichment of pathways related to cell cycle progression, DNA repair and mitotic checkpoint activation, suggesting that these tumours may exhibit increased reliance on cell cycle regulatory mechanisms (Extended Data Fig. 12). Of note, PTEN mutations were exclusively present in individuals who experienced progression on the treatment, suggesting that they had a negative impact on the treatment (P = 0.042, two-sided Fisher’s exact test; Fig. 5d).
Discussion
This study provides a comprehensive analysis of 1,364 tumour–normal pair WGS datasets with highly annotated paired clinical information for breast cancer (the findings are summarized in Supplementary Table 9). Our extensive efforts enabled us to construct a highly detailed somatic mutation landscape of breast cancer, revealing novel insights into the heterogeneous and complex genomics of the disease. By leveraging this meticulously curated clinical data, we were able to identify genomic features with potential clinical relevance and offer hypotheses for future prospective validation (Supplementary Discussion 5).
Our findings highlight the potential of whole-genome analysis for advancing precision oncology for breast cancer. However, integration of such whole-genome analysis into clinical practice has been challenging owing to the complexity of data interpretation, variability in clinical utility and lack of standardization. Despite these challenges, recent studies have shown promising results, such as WGS aiding in decision making for childhood solid cancers55, providing actionable insights for adult cancers11 and improving treatment outcomes in high-risk paediatric patients56. These findings, together with our breast cancer data, highlight the increasing potential of WGS in clinical research and its value for building a robust platform for systematic investigation through the integration of clinical and genomic big data.
Intratumoural heterogeneity poses a significant challenge in the clinical management of breast cancer, particularly in HER2-positive cases57, as it is closely linked to treatment responses. Traditionally, heterogeneity has been assessed through pathology, which is limited by its reliance on small tumour samples and often cannot detect subclonal mutations. By contrast, WGS offers a more comprehensive approach by analysing the entire genome, enabling detection of diverse genetic alterations, including subclonal mutations. This comprehensive analysis provides a quantitative understanding of tumour heterogeneity, capturing the full genetic diversity within tumours and aiding in the prediction of treatment responses (Fig. 5a–c). Given these advantages, we anticipate that WGS-based quantitative assessment of tumour heterogeneity, both at diagnosis and during progression, will have a critical role in shaping future precision oncology strategies.
The exploration of genome-wide mutational patterns reveals the various mutational processes that are active in breast cancer. Identifying mutational signatures associated with specific biological processes, such as HRD and APOBEC activity, provides a deeper understanding of different breast cancer subtypes2. Our study has implications in demonstrating the potential clinical relevance of mutational patterns. Notably, our study revealed the potential of HRD as a predictive biomarker for treatment response, particularly in adjuvant chemotherapy for TNBC (Fig. 2f) and first-line CDK4/6 inhibitor treatment for patients with advanced hormone receptor-positive breast cancers (Fig. 5d–g), providing a rationale for further investigation. Notably, HRD predicted a better response to the former but worse prognosis to the latter. This dichotomy highlights the nuanced role of HRD across different treatment contexts.
Cancer progresses along a specific trajectory, with somatic events accumulating in a defined order over time. By analysing somatic mutations, we were able to reconstruct the chronological trajectory of CNAs in key genomic regions (Extended Data Fig. 10), including ERBB2. Traditional sequencing methods have primarily viewed the genome in a two-dimensional manner, mapping genomic coordinates against the presence of mutations. However, by incorporating a time axis, we can visualize the genome in three dimensions. This advancement offers a more dynamic perspective, and provides crucial insights into cancer biology, tumorigenesis and the resistance mechanisms that emerge during treatment (Fig. 4j–l). Such data will be invaluable in deepening our understanding of these processes.
One potential limitation of our study is the possibility of left truncation bias in survival analyses, owing to the mixed retrospective and prospective nature of the cohort and variable timing of inclusion. In retrospective data, participants must survive until enrolment, which may exclude early deaths and bias survival estimates. Although our dataset lacks formal entry time variables for fully adjusted models, we applied several complementary strategies to mitigate this bias, including subgroup analyses and external validation (Supplementary Discussion 6). Nonetheless, residual bias may remain, particularly for the subgroup of patients with de novo metastases, and we urge caution when interpreting the overall survival findings in this context.
Overall, this study enhances our understanding of the genomic landscape of breast cancer and underscores the value of WGS in discovery research and its potential to inform future clinical strategies, contingent upon further validation. Integrating genomic data with detailed clinical outcomes paves the way for more personalized and effective treatment strategies, with the ultimate aim of improving outcomes for patients. Future prospective clinical trials will be essential to confirm the functional implications of the identified genomic alterations, facilitating their translation into real-world clinical practice.
Methods
Study design and participants
Participants were recruited from Samsung Medical Center and Seoul St Mary’s Hospital (Seoul, Korea) between 2012 and 2023 through prospective and retrospective cohorts. Retrospective cases were selected based on the availability of archived primary tumour and matched normal blood samples, along with sufficient clinical information, and were enroled regardless of disease stage or survival status at accrual. All retrospective samples were obtained shortly after diagnosis, typically at curative-intent surgery. Detailed study design, inclusion and exclusion criteria, and the CONSORT diagram are provided in Supplementary Methods and Supplementary Fig. 1. The study was approved by the Institutional Review Boards of both institutions (Samsung Medical Center: SMC 2022-05-050 and SMC 2013-04-005; Seoul St Mary’s Hospital: KC21TISI0007 and KC22TISI0292) and conducted in accordance with the Declaration of Helsinki and Good Clinical Practice guidelines. Written informed consent, including consent to publish de-identified clinical and genomic data, was obtained from all prospective participants. For retrospective cases, the use and publication of de-identified data were approved by the relevant institutional review boards, with a waiver of informed consent where applicable. A subset of participants was enroled as part of substudy components within the clinical trials NCT03131089 and NCT06334471, which informed specific aspects of the study design.
Sample preparation for sequencing
We performed WGS using CancerVision assay as previously reported58. In brief, WGS was performed on tumour samples obtained as part of routine clinical care either via surgery or biopsy and stored as fresh frozen tissue. For biopsy sample cores were retrieved first for routine pathology, followed by at least one additional core for cancer WGS. Biopsy sample cores were retrieved first for routine pathology, followed by at least one additional core for cancer WGS. For the matched normal samples peripheral blood was used. DNA extraction and library preparation was performed at the Inocras in a Clinical Laboratory Improvement Amendments (CLIA)-certified laboratory. We used the Allprep DNA/RNA Mini Kit (Qiagen) for DNA extraction, and TruSeq DNA PCR-Free (Illumina) for library preparation. Sequencing was performed on the Illumina NovaSeq6000 platform (Illumina) with an average depth of coverage of 40x for tumour and 20x for blood. Quality assessment of the WGS data is available in Supplementary Table 10.
For whole-transcriptome sequencing, total RNA was extracted using the AllPrep DNA/RNA Mini Kit (Qiagen) in accordance with the manufacturer’s protocol. Total RNA was quantified using a Qubit Fluorometer (Invitrogen) and the purity and integrity were assessed by the TapeStation RNA ScreenTape (Agilent Technologies). Total RNA-sequencing analysis enabled detection of both coding and noncoding RNA, along with other long intergenic noncoding RNA (lincRNA), small nuclear RNA (snRNA) and small nucleolar RNA (snoRNA). RNA-sequencing libraries were constructed using the KAPA RNA HyperPrep Kit, with RiboErase (Roche Molecular Systems, following the manufacturer’s protocol. We quantified and assessed the libraries using KAPA Library Quantification Kits for Illumina Sequencing platforms according to the qPCR Quantification Protocol Guide (KAPA Biosystems, KK4854) and the TapeStation D1000 ScreenTape (5067–5582, Agilent Technologies) recommendations. The generated libraries were sequenced by using a paired-end 150-bp read protocol on a NovaSeq 6000 platform (Illumina) with the S4 reagent kit (Illumina).
Genomic analysis and interpretation
Comprehensive genomic analysis and interpretation were conducted using the CancerVision platform (Inocras). WGS data were aligned to the GRCh38 human reference genome using bwa-mem (v.0.7.17-r1188)59. Preprocessing included duplicate marking and generation of compressed reference-oriented alignment map (CRAM) files. Somatic SNVs and short indels were called using Mutect2 (GATK v.4.0) and Strelka2 (v.2.9.10)60,61. High-confidence somatic variants were selected based on the following criteria: ≥2 variant reads in tumour, ≤1 variant read in matched normal, mapping quality ≥15, variant allele frequency (VAF) ≤ 5% in tumour, and population allele frequency ≤1% in the panel of normals.
Tumour purity, ploidy, and segmented CNV profiles were estimated with Sequenza (v.3.0.0)62 and somatic structural variations were identified using Delly (v.0.7.6)63. High-quality structural variations were defined as those with ≥2 variant reads in tumour, ≤1 in normal, mapping quality ≥15, and population allele frequency ≤5% in the panel of normals. GISTIC (v.2.0.23) was applied to identify recurrently amplified or deleted genomic regions64. AmpliconArchitect (v.1.2) was used to detect and characterize ecDNA amplicons42. Variant annotation was performed using the Ensembl Variant Effect Predictor (VEP, release 112)65. Variant call format (VCF) files were processed with bcftools (v.1.9). All variants, both germline and somatic, were subjected to rigorous manual review and curation within Inocras’s proprietary genome browser.
Identification of protein-coding driver genes
Protein-coding driver genes were identified using the IntOGen pipeline (v.2023), which integrates seven independent driver gene identification methods: dNdSCV, OncodriveFML, OncodriveCLUSTL, cBaSE, MutPanning, HotMaps3D and smRegions17. These methods collectively assess the selective advantage of somatic mutations in cancer genomes.
To determine a consensus set of driver genes, we combined the results from the seven methods using a strategy previously described. In brief, for each method, the top 100 ranked genes were selected along with their associated P values and q-values. Somatically mutated genes categorized as tier 1 or tier 2 in the COSMIC Cancer Gene Census (CGC) were used as a reference set of known drivers66. The relative enrichment of CGC genes in the top-ranked gene lists was evaluated to assign a per-method weighting. The final consensus ranking was obtained using Schulze’s voting method, and combined P values were estimated using a weighted Stouffer z-score method.
Candidate driver roles were further classified based on dN/dS ratios for missense (wmis) and nonsense (wnon) mutations, derived from dNdSCV. A distance metric was defined as:
Candidate drivers with distance >0.1 were considered oncogenes, as they exhibited an excess of missense over nonsense mutations, and candidate drivers with distance <0.1 were classified as tumour suppressor genes, characterized by an excess of nonsense over missense mutations.
Additionally, each candidate driver was annotated based on its presence in any IntOGen cohorts from a previous pan-cancer analysis (Supplementary Table 11).
To ensure accuracy, we manually filtered the significant driver genes (combined q-value <0.10), excluding known artefacts (for example, PABPC1) and genes whose annotated driver roles were inconsistent with prior literature, such as JAK1, VAV2 and HGF.
Mutational signature analysis
We estimated contributions of mutational signatures to an observed mutational spectrum in each sample (the presumed amount of exposure to corresponding mutational processes). We solved the following constrained optimization problem67:
where v ∈ Rm×10+, W ∈ Rm×k0+, h ∈ Rk×10+ where R denotes the set of real numbers, m×1 and k×1 indicate real vectors of dimensions m and k, respectively, m×k indicates a real matrix of dimension m by k, and 0+ denotes strictly positive real values (here, m is the number of mutation types and k is the number of mutational signatures). For each sample, given the observed counts of each mutation type v from a sample and the pre-trained mutational signature matrix W, we calculated exposure h. We used the R package pracma, which internally uses an active-set method to solve the above problem. Our method demonstrates comparable performance to SigProfiler68, an elaborated version of the framework used for the previous Catalogue Of Somatic Mutations In Cancer (COSMIC) compendium of mutational signatures, and SignatureAnalyzer69, which is based on a Bayesian variant of non-negative matrix factorization, in accurately estimating mutational signature contributions (Supplementary Discussion 3).
The relative contributions of mutational signatures were calculated by fitting 16 consensus mutational signatures previously identified in breast cancers (COSMIC signatures SBS1, SBS2, SBS3, SBS5, SBS8, SBS13, SBS17a, SBS17b, SBS18, ID1, ID2, ID3, ID5, ID6, ID8 and ID9; available at https://cancer.sanger.ac.uk/cosmic/signatures)2. For samples with a cosine similarity below 0.90, a manual review was performed, and additional COSMIC signatures were incorporated for refitting to improve the accuracy of signature decomposition. The additional signatures included those associated with polymerase eta somatic hypermutation activity (SBS9), polymerase epsilon exonuclease domain mutations (SBS10a and SBS10b), platinum chemotherapy treatment (SBS31), defective DNA mismatch repair (SBS21 and SBS44), and activation-induced cytidine deaminase (SBS84), as well as signatures of unknown aetiology (SBS34, SBS41, ID4 and ID11).
HRD and MSI
To assess HRD, we developed our proprietary algorithm by combining HRD-associated features, such as mutational signatures of point mutations, and copy number changes27. These included single-base substitution signatures (SBS3 and SBS8; reference signatures are available at https://cancer.sanger.ac.uk/signatures/), an indel signature (ID6), genomic rearrangement signatures (RS3 and RS5), deletions accompanied by microhomology, and CNVs. Custom scripts scaled scores of the multi-dimensional features using coefficients derived from published algorithms to compute the final HRD probability scores. For a quantitative evaluation of somatic microsatellite alterations, we considered both the score from MSIsensor70 and the proportion of microsatellite instability (MSI)-related mutational signatures (SBS6, SBS15, SBS20, SBS21, SBS26, SBS30 and SBS44)2.
Mutation copy numbers and determination of pre- and post-amplification events
We estimated mutation copy number (nmut) using the previously described formula71
In this formula, fs indicates variant allele fraction, ρ indicates tumour cellularity. nt locus and nn locus are absolute copy numbers in tumour and normal cells, respectively, which were derived from the following formula.
in which RDlocus indicates read depth of the locus of interest, and RDauto indicates average haploid autosomal coverage that was obtained from paired normal WGS.
A mutation was classified as a pre-amplification event, when nmut was larger than the major copy number of tumour multiplied by a factor of 0.75. If nmut was smaller than the above value but larger than 0.75, the mutation was assigned as post-amplification or minor allele mutations.
Molecular within-tumour timing of copy number gains
When a chromosomal segment is gained, it inherently co-amplifies all somatic mutations acquired within the segment up to that point in time, and thus the relative timing of genomic gains can be inferred by comparing frequencies of these co-amplified somatic mutations. To estimate relative event timing within individual tumours we utilized a relative timing measure, π, for every copy gain72,73, which represents the proportion of mutations per unit length of DNA that occurred before the event relative to the total number of mutations on the same DNA interval. Since mutations accumulate over time, this measure can be used to evaluate the timing of a copy number gain in a hypothetical molecular clock. To remove the effect of mutational processes that lead to a hypermutator phenotype (such as APOBEC mutagenesis, MSI and HRD), the number of mutations in each amplified segment was adjusted according to the proportion of SBS1 and SBS5, considering their clock-like nature74,75.
Breast cancer subtyping
We classified breast cancer samples into intrinsic subtypes using the prediction analysis of microarray 50 (PAM50) gene expression profiling method12. After loading gene expression data and removing duplicates and missing values, subtyping was conducted with the molecular.subtyping function from the genefu package76, applying the PAM50 model to classify samples into five categories: luminal A, luminal B, HER2-enriched, basal-like and normal-like.
To classify breast cancer samples into integrative clusters (IntClust) based on their copy number and expression profiles, we utilized the ic10 R package, a validated tool designed for the IntClust subtyping system. This classification method was originally derived from the METABRIC cohort and integrates both gene expression and segmented copy number variation data to define ten molecular subtypes of breast cancer52. The algorithm was run with default parameters, using log2 copy number ratios as input.
Scoring focally amplified genomics regions
To construct the landscape of focal amplifications across the whole genome, we calculated the F-score for each 5-Mb window. For each sample, we identified the segment with the maximum copy number within each window and computed the ratio of this copy number to the segment’s width. We then summed these ratios across all samples to define the F-score. The F-scores were subsequently plotted across the entire genome.
Survival analysis
All tumour samples used for survival analyses were collected prior to the initiation of targeted therapies, ensuring that the results were not influenced by treatment-induced genomic alterations. Survival analyses were conducted using the Kaplan–Meier method, and differences between groups were compared using the log-rank test.
PFS was defined as the time from treatment initiation to disease progression or death from any cause, whichever occurred first. Overall survival (OS) was measured from the time of diagnosis to death from any cause. Disease-free survival was defined as the time from adjuvant treatment initiation to the first documented recurrence or death from any cause, whichever occurred first.
In all survival analyses, both breast cancer-related and unrelated deaths were treated as events.
To evaluate the association between specific variables and survival outcomes, a Cox proportional hazards regression model was applied, with multivariate models incorporating relevant clinical and molecular covariates to adjust for potential confounders.
Given the mixed prospective and retrospective nature of this study, immortality bias (left truncation bias) was carefully addressed: (1) consistent survival definitions: the same survival time definitions were applied uniformly to both retrospective and prospective cohorts; (2) statistical adjustment for cohort type: cohort type (prospective versus retrospective) was included as a covariate in Cox regression models to correct for potential bias; (3) sensitivity analyses: we conducted additional sensitivity analyses, assessing the impact of cohort selection on survival estimates to ensure the robustness of our findings; and (4) external validation: where possible, independent external cohorts were used to validate survival analyses and confirm reproducibility.
These measures minimize potential survival biases, ensuring that our findings accurately reflect the prognostic and predictive significance of genomic alterations (Supplementary Discussion 6).
Statistics and reproducibility
Statistical tests or methods are described in the figure legends. We used R (v.3.4.0) for all data processing and secondary computational analysis.
Reporting summary
Further information on research design is available in the Nature Portfolio Reporting Summary linked to this article.
Data availability
Whole-genome and transcriptome sequencing data from this study are available in the European Genome–Phenome Archive (EGA; study ID EGAS50000001377). WGS CRAM files have been deposited under accession number EGAD50000001994, and RNA-seq data are available under accession number EGAD50000001993. Clinical information for the study patients is provided in Supplementary Table 12.
Code availability
In-house scripts for analyses are available on GitHub (https://github.com/RyulKim-Inocras/breast_cancer).
References
Siegel, R. L., Miller, K. D., Wagle, N. S. & Jemal, A. Cancer statistics, 2023. CA Cancer J. Clin. 73, 17–48 (2023).
Alexandrov, L. B. et al. The repertoire of mutational signatures in human cancer. Nature 578, 94–101 (2020).
Nik-Zainal, S. et al. Landscape of somatic mutations in 560 breast cancer whole-genome sequences. Nature 534, 47–54 (2016).
Mroz, E. A. & Rocco, J. W. MATH, a novel measure of intratumor genetic heterogeneity, is high in poor-outcome classes of head and neck squamous cell carcinoma. Oral Oncol. 49, 211–215 (2013).
Jallah, J. K., Dweh, T. J., Anjankar, A. & Palma, O. A review of the advancements in targeted therapies for breast cancer. Cureus 15, e47847 (2023).
Horak, P., Fröhling, S. & Glimm, H. Integrating next-generation sequencing into clinical oncology: strategies, promises and pitfalls. ESMO Open 1, e000094 (2016).
Abbasi, A. & Alexandrov, L. B. Significance and limitations of the use of next-generation sequencing technologies for detecting mutational signatures. DNA Repair 107, 103200 (2021).
ICGC/TCGA Pan-Cancer Analysis of Whole Genomes Consortium. Pan-cancer analysis of whole genomes. Nature 578, 82–93 (2020).
Sosinsky, A. et al. Insights for precision oncology from the integration of genomic and clinical data of 13,880 tumors from the 100,000 Genomes Cancer Programme. Nat. Med. 30, 279–289 (2024).
Priestley, P. et al. Pan-cancer whole-genome analyses of metastatic solid tumours. Nature 575, 210–216 (2019).
Kim, R. et al. Clinical application of whole-genome sequencing of solid tumors for precision oncology. Exp. Mol. Med. 56, 1856–1868 (2024).
Parker, J. S. et al. Supervised risk predictor of breast cancer based on intrinsic subtypes. J. Clin. Oncol. 27, 1160–1167 (2009).
Ahn, S. H. et al. Poor outcome of hormone receptor-positive breast cancer at very age is due to tamoxifen resistance: nationwide survival data in Korea-a report from the Korean Breast Cancer Society. J. Clin. Oncol. 25, 2360–2368 (2007).
Min, S. Y. et al. The basic facts of korean breast cancer in 2013: results of a nationwide survey and breast cancer registry database. J. Breast Cancer 19, 1–7 (2016).
Kan, Z. et al. Multi-omics profiling of younger Asian breast cancers reveals distinctive molecular signatures. Nat. Commun. 9, 1725 (2018).
Thomas, A. et al. Tumor mutational burden is a determinant of immune-mediated survival in breast cancer. Oncoimmunology 7, e1490854 (2018).
Martínez-Jiménez, F. et al. A compendium of mutational cancer driver genes. Nat. Rev. Cancer 20, 555–572 (2020).
Miller, D. H. et al. BCL11B drives human mammary stem cell self-renewal in vitro by inhibiting basal differentiation. Stem Cell Rep. 10, 1131–1145 (2018).
Przybylski, G. K., Przybylska, J. & Li, Y. Dual role of BCL11B in T-cell malignancies. Blood Sci. 6, e00204 (2024).
Nitz, M. D., Harding, M. A., Smith, S. C., Thomas, S. & Theodorescu, D. RREB1 transcription factor splice variants in urologic cancer. Am. J. Pathol. 179, 477–486 (2011).
Morgani, S. M., Su, J., Nichols, J., Massagué, J. & Hadjantonakis, A.-K. The transcription factor Rreb1 regulates epithelial architecture, invasiveness, and vasculogenesis in early mouse embryos. eLife 10, e64811 (2021).
Kent, O. A. et al. Repression of the miR-143/145 cluster by oncogenic Ras initiates a tumor-promoting feed-forward pathway. Genes Dev. 24, 2754–2759 (2010).
Rocca, A., Braga, L., Volpe, M. C., Maiocchi, S. & Generali, D. The predictive and prognostic role of RAS–RAF–MEK–ERK pathway alterations in breast cancer: revision of the literature and comparison with the analysis of cancer genomic datasets. Cancers 14, 5306 (2022).
Liu, D. et al. SPECC1 as a pan-cancer biomarker: unraveling its role in drug sensitivity and resistance mechanisms. Discov. Oncol. 15, 552 (2024).
Marvalim, C., Datta, A. & Lee, S. C. Role of p53 in breast cancer progression: An insight into p53 targeted therapy. Theranostics 13, 1421–1442 (2023).
Pereira, B. et al. The somatic mutation profiles of 2,433 breast cancers refines their genomic and transcriptomic landscapes. Nat. Commun. 7, 11479 (2016).
Davies, H. et al. HRDetect is a predictor of BRCA1 and BRCA2 deficiency based on mutational signatures. Nat. Med. 23, 517–525 (2017).
Sharma, P. et al. Impact of homologous recombination deficiency biomarkers on outcomes in patients with triple-negative breast cancer treated with adjuvant doxorubicin and cyclophosphamide (SWOG S9313). Ann. Oncol. 29, 654–660 (2018).
Nik-Zainal, S. et al. Association of a germline copy number polymorphism of APOBEC3A and APOBEC3B with burden of putative APOBEC-dependent mutations in breast cancer. Nat. Genet. 46, 487–491 (2014).
Long, J. et al. A common deletion in the APOBEC3 genes and breast cancer risk. J. Natl Cancer Inst. 105, 573–579 (2013).
Xuan, D. et al. APOBEC3 deletion polymorphism is associated with breast cancer risk among women of European ancestry. Carcinogenesis 34, 2240–2243 (2013).
Li, Y. et al. Patterns of somatic structural variation in human cancer genomes. Nature 578, 112–121 (2020).
Yang, Y., Lu, T., Li, Z. & Lu, S. FGFR1 regulates proliferation and metastasis by targeting CCND1 in FGFR1 amplified lung cancer. Cell Adh. Migr. 14, 82–95 (2020).
Aleksakhina, S. N. et al. CCND1 and FGFR1 gene amplifications are associated with reduced benefit from aromatase inhibitors in metastatic breast cancer. Clin. Transl. Oncol. 23, 874–881 (2021).
Jiang, Y. et al. SEdb: a comprehensive human super-enhancer database. Nucleic Acids Res. 47, D235–D243 (2019).
Dubois, F., Sidiropoulos, N., Weischenfeldt, J. & Beroukhim, R. Structural variations in cancer and the 3D genome. Nat. Rev. Cancer 22, 533–546 (2022).
Loo, S. K. et al. Fusion-associated carcinomas of the breast: diagnostic, prognostic, and therapeutic significance. Genes Chromosomes Cancer 61, 261–273 (2022).
Lei, J. T., Gou, X. & Ellis, M. J. ESR1 fusions drive endocrine therapy resistance and metastasis in breast cancer. Mol. Cell. Oncol. 5, e1526005 (2018).
Lee, S. et al. Landscape analysis of adjacent gene rearrangements reveals BCL2L14–ETV6 gene fusions in more aggressive triple-negative breast cancer. Proc. Natl Acad. Sci. USA 117, 9912–9921 (2020).
Howarth, K. D. et al. NRG1 fusions in breast cancer. Breast Cancer Res. 23, 3 (2021).
Jonna, S. et al. Detection of NRG1 gene fusions in solid tumors. Clin. Cancer Res. 25, 4966–4972 (2019).
Deshpande, V. et al. Exploring the landscape of focal amplifications in cancer using AmpliconArchitect. Nat. Commun. 10, 392 (2019).
Schwab, M. Amplification of oncogenes in human cancer cells. Bioessays 20, 473–479 (1998).
Turner, K. M. et al. Extrachromosomal oncogene amplification drives tumour evolution and genetic heterogeneity. Nature 543, 122–125 (2017).
Wolff, A. C. et al. Human epidermal growth factor receptor 2 testing in breast cancer: American Society of Clinical Oncology/College of American Pathologists clinical practice guideline focused update. J. Clin. Oncol. 36, 2105–2122 (2018).
Sammut, S.-J. et al. Multi-omic machine learning predictor of breast cancer therapy response. Nature 601, 623–629 (2022).
Bailey, C. et al. Origins and impact of extrachromosomal DNA. Nature 635, 193–200 (2024).
Cortés-Ciriano, I. et al. Comprehensive analysis of chromothripsis in 2,658 human cancers using whole-genome sequencing. Nat. Genet. 52, 331–341 (2020).
Lee, J. J.-K. et al. Tracing oncogene rearrangements in the mutational history of lung adenocarcinoma. Cell 177, 1842–1857.e21 (2019).
Nishimura, T. et al. Evolutionary histories of breast cancer and related clones. Nature 620, 607–614 (2023).
Xu, J., Chen, Y. & Olopade, O. I. MYC and breast cancer. Genes Cancer 1, 629–640 (2010).
Curtis, C. et al. The genomic and transcriptomic architecture of 2,000 breast tumours reveals novel subgroups. Nature 486, 346–352 (2012).
Singh, D. K. et al. PSIP1/p75 promotes tumorigenicity in breast cancer cells by promoting the transcription of cell cycle genes. Carcinogenesis 38, 966–975 (2017).
Im, S. A. et al. Overall survival with ribociclib plus endocrine therapy in breast cancer. N. Engl. J. Med. 381, 307–316 (2019).
Hodder, A. et al. Benefits for children with suspected cancer from routine whole-genome sequencing. Nat. Med. 30, 1905–1912 (2024).
Lau, L. M. S. et al. Precision-guided treatment in high-risk pediatric cancers. Nat. Med. 30, 1913–1922 (2024).
Rye et al. Intratumor heterogeneity defines treatment-resistant HER2+ breast tumors. Mol. Oncol. 12, 1838–1855 (2018).
Lee, S. et al. Target-enhanced whole-genome sequencing shows clinical validity equivalent to commercially available targeted oncology panel. Cancer Res. Treat. 57, 350–361 (2025).
Jung, Y. & Han, D. BWA-MEME: BWA-MEM emulated with a machine learning approach. Bioinformatics 38, 2404–2413 (2022).
Cibulskis, K. et al. Sensitive detection of somatic point mutations in impure and heterogeneous cancer samples. Nat. Biotechnol. 31, 213–219 (2013).
Kim, S. et al. Strelka2: fast and accurate calling of germline and somatic variants. Nat. Methods 15, 591–594 (2018).
Favero, F. et al. Sequenza: allele-specific copy number and mutation profiles from tumor sequencing data. Ann. Oncol. 26, 64–70 (2015).
Rausch, T. et al. DELLY: structural variant discovery by integrated paired-end and split-read analysis. Bioinformatics 28, i333–i339 (2012).
Mermel, C. H. et al. GISTIC2.0 facilitates sensitive and confident localization of the targets of focal somatic copy-number alteration in human cancers. Genome Biol. 12, R41 (2011).
McLaren, W. et al. The ensembl variant effect predictor. Genome Biol. 17, 122 (2016).
Tate, J. G. et al. COSMIC: the catalogue of somatic mutations in cancer. Nucleic Acids Res. 47, D941–D947 (2019).
Alexandrov, L. B. et al. Signatures of mutational processes in human cancer. Nature 500, 415–421 (2013).
Alexandrov, L. B., Nik-Zainal, S., Wedge, D. C., Campbell, P. J. & Stratton, M. R. Deciphering signatures of mutational processes operative in human cancer. Cell Rep. 3, 246–259 (2013).
Kasar, S. et al. Whole-genome sequencing reveals activation-induced cytidine deaminase signatures during indolent chronic lymphocytic leukaemia evolution. Nat. Commun. 6, 8866 (2015).
Niu, B. et al. MSIsensor: microsatellite instability detection using paired tumor-normal sequence data. Bioinformatics 30, 1015–1016 (2014).
Nik-Zainal, S. et al. The life history of 21 breast cancers. Cell 149, 994–1007 (2012).
Purdom, E. et al. Methods and challenges in timing chromosomal abnormalities within cancer samples. Bioinformatics 29, 3113–3120 (2013).
Leshchiner, I. et al. Comprehensive analysis of tumour initiation, spatial and temporal progression under multiple lines of treatment. Preprint at bioRxiv https://doi.org/10.1101/508127 (2018).
Alexandrov, L. B. et al. Clock-like mutational processes in human somatic cells. Nat. Genet. 47, 1402–1407 (2015).
Blokzijl, F. et al. Tissue-specific mutation accumulation in human adult stem cells during life. Nature 538, 260–264 (2016).
Gendoo, D. M. A. et al. Genefu: an R/Bioconductor package for computation of gene expression-based signatures in breast cancer. Bioinformatics 32, 1097–1099 (2016).
Acknowledgements
This study was conducted with internal funding from Inocras for collaboration with Samsung Medical Center and Saint Mary’s Hospital, with partial financial support from Bayer, Korea (KCT0006142 to J. Lee). We acknowledge the Korea Research Environment Open Network (KREONET) service and the usage of the Global Science Experimental Data Hub Center (GSDC) provided by Korea Institute of Science and Technology Information (KISTI). We thank J. Lee for invaluable guidance and insightful advice throughout the course of this research.
Author information
Authors and Affiliations
Contributions
Y.S.J., J. Lee and Y.H.P. conceived the study. J.Y., S.J.N., S.W.K., Jeong Eon Lee, B.J.C., J.-Y.K., G.E.P., B.J.K., P.S.P., S.Y.B., C.I.Y., Y.J.L., D.K., K.S., Ji Eun Lee, J. Kang, A.L., S.H.K., Y.-L.C., W.C.P. and J. Lee collected breast cancer samples. J. Kim, C.C. and J.Y.S. conducted genome sequencing. R.K. performed most genome and statistical analyses with contributions from J.Y., J. Lim, B.B.-L.O. and Y.S.J. H.L., M.K. and B.B.-L.O. collected clinical histories and contributed to data management with support from E.C.-S. and S.L. H.P., I.J., B.Y., W.-C.L., K.J.Y., Y.O.K., I.H.C. and J.P. developed the bioinformatics pipeline and conducted variant calling. B.R.L. and Y.L. participated in whole-genome interpretation and data curation. J.S.L. contributed to data integration and project coordination. R.K., J. Lee, Y.S.J. and Y.H.P. wrote the manuscript with input from all authors. Y.S.J. supervised the overall study.
Corresponding authors
Ethics declarations
Competing interests
Y.S.J. and J.S.L. are co-founders of Inocras, a San Diego-based precision medicine company. Y.H.P. has received grants from MSD, AstraZeneca, Pfizer, Gencurix, Roche, Inocras and Novartis, and consulting fees from AstraZeneca, MSD, Pfizer, Eisai, Lilly, Roche, Gilead, Daiichi-Sankyo, Menarini, Everest and Novartis. R.K., J. Lim, B.B.-L.O., E.C.-S., S.L., B.R.L., Y.L., K.J.Y., Y.O.K., I.H.C., J.P., J. Kim, C.C., J.Y.S., H.L., M.K., H.P., I.J., B.Y. and W.-C.L. are employees of Inocras. The other authors declare no competing interests.
Peer review
Peer review information
Nature thanks the anonymous reviewer(s) for their contribution to the peer review of this work. Peer reviewer reports are available.
Additional information
Publisher’s note Springer Nature remains neutral with regard to jurisdictional claims in published maps and institutional affiliations.
Extended data figures and tables
Extended Data Fig. 1 Comprehensive overview of the genomic and molecular characteristics of 1,364 breast cancer samples.
Columns are ordered to visualize mutual exclusivity between alterations across samples, highlighting potential co-occurrence and exclusivity patterns among key genomic events. Rows represent driver genes identified by seven different driver gene detection algorithms: SMRegions, OncodriveFML, OncodriveCLUSTL, MutPanning, HotMAPS, dNdScv, and CBaSE, providing a robust and integrative approach to detecting candidate driver mutations. Abbreviations: TMB, tumor mutational burden; ER, estrogen receptor; PR, progesterone receptor; HRD, homologous recombination deficiency; MATH, mutant-allele tumor heterogeneity; SBS, single base substitution; ID, indel; SV, structural variation.
Extended Data Fig. 2 Rare but putatively novel driver genes identified in this study.
Each lollipop plot represents the distribution of mutations along the protein-coding sequence of each gene: (a) BCL11B, (b) RREB1, (c) RAF1, and (d) SPECC1. The x-axis corresponds to the amino acid position, while the y-axis indicates the count of samples in which a given mutation was identified. Circles denote mutation types and their frequency (number of samples in which the mutation was observed). Colored rectangles on the coding sequence represent distinct functional domains of each protein.
Extended Data Fig. 3 Genomic instability associated with TP53 mutation.
a–c, Distribution of homologous recombination deficient (HRD) and proficient (HRP) tumors (a), ploidy (b), and mutant allele tumor heterogeneity (MATH) scores (c) according to TP53 mutation status (TP53wt, wild-type; TP53mut, mutant). P-values were calculated using a two-sided chi-square test (a) and two-sided Student’s t-test (b, c). d–f, Kaplan–Meier survival curves stratified by TP53 mutation status and MATH score in the CUBRICS cohort with multivariate Cox regression analysis (d,e), and in the METABRIC cohort (f). In CUBRICS, MATHhigh was defined as MATH ≥ 40 and MATHlow as MATH < 40, whereas in METABRIC, MATHhigh and MATHlow were defined by the upper and lower quartiles, respectively. Both cohorts showed consistent associations between MATH, TP53 mutation status, and overall survival. Error bars in panel e represent 95% confidence intervals, with the centre defined as the hazard ratio. Notes: Box plots show median (line), first and third quartiles (box edges), and 1.5× the interquartile range (whiskers). In all panels, “n” indicates the number of patients included in the analysis.
Extended Data Fig. 4 Impact of APOBEC3A/3B germline deletion on mutational signatures and APOBEC gene expression.
a, Detection of APOBEC3A/3B germline deletion. Germline deletion status was determined using the depth ratio method, where R1 (d0/d1) represents the ratio of sequencing depth between the upstream 30 kbp region and the deletion region, and R2 (d0/d2) represents the ratio between the downstream 30 kbp region and the deletion region. b, Distribution of R1 and R2 values. The density plot shows distinct clustering of samples based on APOBEC3A/3B germline deletion status (wild-type, heterozygous deletion, and homozygous deletion), confirming that these metrics effectively differentiate deletion groups. c, RNA expression differences in APOBEC family genes by germline deletion status. Violin plots display the transcriptional impact of APOBEC3A/3B germline deletion on APOBEC gene expression levels, highlighting significant differences where applicable. Sample sizes: homozygous deletion (n = 121), heterozygous deletion (n = 539), wild-type (n = 549). d, Differences in mutational signatures by germline deletion status. Violin plots illustrate the number of mutations assigned to each COSMIC mutational signature across samples stratified by APOBEC3A/3B germline deletion status. Sample sizes: deletion (n = 736), wild-type (n = 628). Note: P-values were calculated using a two-sided Student’s t-test without adjustment for multiple comparisons. Box plots indicate median (middle line), first and third quartiles (edges).
Extended Data Fig. 5 Transcriptomic impact of structural variations spanning chr8:35-40 Mb and chr11:65-70 Mb in luminal B breast cancer.
a, Volcano plot displaying differentially expressed genes between luminal B breast cancer cases with structural variations (SVs) spanning chr8:35-40 Mb and chr11:65-70 Mb (right) and those without these SVs (left). The x-axis represents log2 fold-change in gene expression, while the y-axis represents the -log10(q-value). b, Gene Set Enrichment Analysis results showing pathways enriched in luminal B breast cancer cases with these SVs. Positive normalized enrichment scores (NES) indicate upregulated pathways, including TNF-α signaling via NF-κB, TGF-β signaling, and epithelial-mesenchymal transition, which are known to contribute to tumor progression and metastasis. Conversely, downregulated pathways include oxidative phosphorylation, glycolysis, and fatty acid metabolism, suggesting a metabolic shift in tumors harboring these SVs.
Extended Data Fig. 6 Structural characterization of recurrent fusions identified in our cohort.
Illustrated are fusions involving TTC6/MIPOL1, BCL2L14/ETV6, PRKCA/CEP112, ESR1/CCDC170, AGO2/PTK2, GALNT17/AUTS2, and BRD4/NOTCH3.
Extended Data Fig. 7 Structural characterization of recurrent fusions identified in our cohort.
Illustrated are fusions involving TRAPPC9/PTK2, UHRF1BP1L/ANKS1B, FBXL20/IKZF3, PRKCA/RGS9, DLG2/TENM4, IL34/SF3B3, AGO2/TRAPPC9, IMMP2L/DOCK4, SLC39A11/SDK2, KAT6A/ANK1, and IKZF3/ERBB2.
Extended Data Fig. 8 Structural variations (SVs) affecting COSMIC cancer gene census genes.
The left panel shows the number of cases with SVs in each gene, categorized by PAM50 molecular subtype. The right panel displays the percentage distribution of different SV types. The data highlight genes recurrently affected by SVs in breast cancer, with tumor suppressor genes (e.g., PTEN, RB1, and RUNX1) and oncogenes (e.g., NRG1, ERBB4, and ESR1) prominently impacted. These results suggest that SVs may contribute to the dysregulation of key cancer-related genes across different breast cancer subtypes.
Extended Data Fig. 9 Focal amplification of key oncogenes and predictive role of ERBB2 focal amplification in neoadjuvant anti-HER2 therapy response.
a, Segment length (Mbp) and copy number (CN) gain of ERBB2, CCND1, ZNF703, and FGFR1, classified as focal amplification (≤3 Mbp, relative CN gain >3 compared to surrounding regions, absolute CN ≥ 7), broad amplification (CN gain ≥1 without focal), or none. Vertical and horizontal lines mark thresholds for focal amplification. b, Relationship between log10(CN) and log10(RNA expression; TPM) for the four oncogenes. Density shading (red = highest) and yellow dots (individual tumors) shown. c, Correlation matrix of RNA expression: lower = density plots, diagonal = TPM distribution, upper = Pearson correlation with significance (*P < 0.05, **P < 0.01, ***P < 0.001). d, Genome-wide structural plot (Yilong plot) showing focal ERBB2 amplification (CN = 68) in a HER2 IHC 0 tumor; structural analysis confirms extrachromosomal DNA. e, HER2 IHC 3+ case without focal ERBB2 amplification, with ERBB2 TPM of 43.5, lower than typical IHC 3+ tumors. f–h, Association of ERBB2 focal amplification with pathologic complete response (pCR) to neoadjuvant trastuzumab + pertuzumab (TransNEO cohort). f, Amplicon width vs. major allele CN in 168 patients. g, CN profiles in eight treated patients: pCR cases (brown) show higher focal amplification; non-pCR cases (grey) lack it. h, Sankey plot: all without focal amplification failed pCR; 75% (3/4) with focal amplification responded. i–k, ERBB2 CN as predictor of pCR in 75 HER2-positive breast cancers treated with neoadjuvant TCHP. i, ROC curve (AUC = 0.819). j, CN distribution in responders vs. non-responders. k, Sankey plot showing pCR vs. non-pCR outcomes stratified by ERBB2 copy number (≥33) and chromothripsis status in the CUBRICS cohort. “n” indicates the number of patients in each analysis.
Extended Data Fig. 10 Long-segmental copy number changes in breast cancer.
Relative molecular timing of recurrent copy number amplifications (CNAs). From top to bottom: number of patients harboring each CNA; percentage of PAM50; integrative clusters (IntClust) molecular subtypes among samples with the respective CNA; box plots indicating median (middle line), first and third quartiles (edges) and 1.5x the interquartile range (whiskers); hazard ratio estimates with 95% confidence intervals; violin plots displaying the distribution of relative CNA timing (black dots represent the mean timing); and the G-score from GISTIC algorithm.
Extended Data Fig. 11 Prognostic impact of 9p23 amplification and copy number amplification timing in breast cancer.
a,b, Impact of 9p23 amplification on overall survival (OS) in TNBC within the METABRIC cohort. a, Kaplan-Meier survival curves comparing OS between patients with (n = 102) and without (n = 228) 9p23 amplification, demonstrating a poorer prognosis in those with amplification. b, Multivariate Cox regression analysis for OS, displaying hazard ratios and 95% confidence intervals (CI) for 9p23 amplification, tumor size (>50 mm vs. ≤50 mm), and lymph node metastasis status. A two-sided Wald test was performed without adjustment for multiple comparisons. Error bars indicate 95% confidence intervals, with the centre defined as the hazard ratio. c, Differential gene expression analysis based on 9p23 amplification status in basal-like breast cancer. Significantly upregulated genes in 9p23-amplified samples are shown in red, while those upregulated in non-amplified samples are shown in yellow. The x-axis represents log2 fold-change in expression, and the y-axis shows the -log10(q-value), indicating statistical significance. d, Copy number amplification timing in homologous recombination-proficient (HRP) and homologous recombination-deficient (HRD) samples. Each row represents a sample, and the x-axis represents the relative timing of amplification events. The color intensity indicates the number of amplification segments at a given time point, with darker shades representing a higher number of amplification events. e, Distribution of amplification duration in HRP and HRD samples. The violin plot compares the duration of amplification events, defined as the difference between the earliest and latest amplification times within a sample. Box plots indicate median (middle line), first and third quartiles (edges). The p-value was estimated by a two-sided Student’s t-test. Note: In all panels, “n” refers to the number of patients included in the analysis.
Extended Data Fig. 12 Gene set enrichment analysis (GSEA) of RNA expression data in homologous recombination-deficient (HRD) vs. homologous recombination-proficient (HRP) hormone receptor-positive breast cancer patients treated with CDK4/6 inhibitors as first-line palliative treatment.
The x-axis represents the normalized enrichment score (NES), indicating whether a pathway is upregulated (positive NES) or downregulated (negative NES) in HRD patients (n = 13) compared to HRP patients (n = 44). The y-axis lists the significantly enriched pathways. The size of each dot corresponds to -log10(q-value), with larger dots indicating stronger statistical significance. Pathways on the right (positive NES) are enriched in HRD tumors, whereas pathways on the left (negative NES) are enriched in HRP tumors.
Supplementary information
Supplementary Information
Supplementary Methods, Supplementary Discussion 1–6, Supplementary Figs. 1–9, a guide to Supplementary Tables 1–12 and references.
Supplementary Tables
Supplementary Tables 1–12
Rights and permissions
Open Access This article is licensed under a Creative Commons Attribution-NonCommercial-NoDerivatives 4.0 International License, which permits any non-commercial use, sharing, distribution and reproduction in any medium or format, as long as you give appropriate credit to the original author(s) and the source, provide a link to the Creative Commons licence, and indicate if you modified the licensed material. You do not have permission under this licence to share adapted material derived from this article or parts of it. The images or other third party material in this article are included in the article’s Creative Commons licence, unless indicated otherwise in a credit line to the material. If material is not included in the article’s Creative Commons licence and your intended use is not permitted by statutory regulation or exceeds the permitted use, you will need to obtain permission directly from the copyright holder. To view a copy of this licence, visit http://creativecommons.org/licenses/by-nc-nd/4.0/.
About this article

Cite this article
Kim, R., Yu, J., Lim, J. et al. Whole-genome landscapes of 1,364 breast cancers. Nature 649, 1282–1291 (2026). https://doi.org/10.1038/s41586-025-09812-3
Received:
Accepted:
Published:
Version of record:
Issue date:
DOI: https://doi.org/10.1038/s41586-025-09812-3
