
Abstract
Revealing the underlying cell-state landscape from single-cell data requires overcoming the critical obstacles of batch integration, denoising and dimensionality reduction. Here we present CONCORD, a unified framework that simultaneously addresses these challenges within a single self-supervised model. At its core, CONCORD implements a probabilistic sampling strategy that corrects batch effects through dataset-aware sampling and enhances biological resolution through hard-negative sampling. Using only a minimalist neural network with a single hidden layer and contrastive learning, CONCORD surpasses state-of-the-art performance without relying on deep architectures, auxiliary losses or external supervision. It seamlessly integrates data across batches, technologies and even species to generate high-resolution cell atlases. The resulting latent representations are denoised and biologically meaningful, capturing gene coexpression programs, revealing detailed lineage trajectories and preserving both local geometric relationships and global topological structures. We demonstrate CONCORD’s broad applicability across diverse datasets, establishing it as a general-purpose framework for learning unified, high-fidelity representations of cellular identity and dynamics.
Main
Cells express thousands of genes to perform specialized functions and maintain homeostasis. Gene expression is highly correlated, orchestrated by intricate gene-regulatory networks and cell–cell interactions that constrain cells to a structured, low-dimensional ‘state landscape’ within the high-dimensional gene expression space1,2. Advances in single-cell technologies, particularly single-cell RNA sequencing (scRNA-seq), enable empirical mapping of this landscape. Emerging evidence suggests that such landscapes may contain diverse features—including discrete clusters, continuous trajectories, branching trees and cyclic transitions—reflecting the underlying organization of cellular states3,4. However, the presence and arrangement of these features are typically unknown a priori, underscoring the need for computational methods that can robustly capture their topology and geometry to illuminate the principles of development, homeostasis and disease progression.
Dimensionality reduction, a form of representation learning, is commonly used to uncover the structure of the cell-state landscape. By projecting high-dimensional data into a lower-dimensional space, key structural patterns become more tractable to visualize and analyze. However, conventional methods such as principal component analysis (PCA), non-negative matrix factorization (NMF)5 and factor analysis6 often overemphasize broad cell type distinctions at the expense of subtle states and can confound processes like differentiation with cell-cycle progression. These challenges are exacerbated by batch effects, poorly understood sources of technical variation that obscure or skew genuine biological signals. Although an array of batch-correction tools such as Harmony7, Scanorama8, Seurat9, single-cell variational inference (scVI)10, linked inference of genomic experimental relationships (LIGER)11 and mutual nearest neighbors (MNN)12 have been developed, they frequently make strong assumptions about the structure of technical variation, leading to distortions from overcorrecting or undercorrecting batch effects13. Furthermore, many face scalability issues when applied to massive atlas-level datasets.
Among emerging representation learning approaches, contrastive learning has recently shown promise for single-cell analysis14,15,16,17,18,19,20. Initially developed for domains such as image and natural language processing21,22,23, these methods learn informative cell representations by comparing similar (‘positive’) cells to dissimilar (‘negative’) ones within minibatches—small subsets of cells iteratively sampled during training. By differentiating each cell from others in the minibatch, the model learns features that distinguish distinct cellular states. Simultaneously, aligning augmented versions of the same cell (typically generated through random masking) encourages the model to capture robust gene coexpression patterns rather than relying on the expression of individual genes24. As a result, the learned representations are intrinsically robust to technical noise and dropout—pervasive artifacts in single-cell datasets25—thereby improving downstream tasks such as clustering and cell type classification15,16,17.
However, current contrastive methods face fundamental limitations: supervised approaches require extensive manual annotation and struggle to generalize to novel states or continuous trajectories19,20, whereas unsupervised methods typically form minibatches through uniform sampling14,15,16,17, leading to two major shortcomings. First, uniform sampling emphasizes broad differences (for example, major cell types) while underrepresenting rare subpopulations or subtle distinctions, resulting in poor resolution of fine-scale cellular states. Second, mixing cells from different datasets within the same minibatch amplifies dataset-specific technical differences—known as ‘batch effects’—causing the model to inadvertently encode these artifacts rather than capturing biologically meaningful variation. While strategies involving generative adversarial networks17,26,27, unsupervised domain adaptation through backpropagation28 and conditional variational autoencoders (VAEs)29 attempt to mitigate batch effects, their objective of minimizing dataset-specific differences inherently conflicts with contrastive learning’s goal of maximizing differences between dissimilar cells, frequently leading to incomplete batch-effect correction and potentially introducing distortions to the latent space. This dilemma raises the question of whether contrastive learning can fully capture cellular diversity while minimizing batch effects.
Here, we address this open question by transforming a limitation of contrastive learning—its sensitivity to minibatch composition—into a strength. Our central insight is that minibatch composition fundamentally determines the outcome of contrastive learning. We introduce CONCORD, a framework that redefines the contrastive learning process through a probabilistic minibatch sampling strategy combining dataset-aware sampling and hard-negative sampling. By strategically composing each minibatch primarily with cells from the same dataset, thereby preventing the model from learning technical differences among batches while focusing on biological differences among cells, CONCORD simultaneously enhances embedding resolution and mitigates batch-specific artifacts. In contrast to prior methods that rely on complex architectures or auxiliary losses for batch correction, CONCORD achieves dimensionality reduction, denoising and data integration solely through principled sampling. We demonstrate its effectiveness using a minimalist, single-hidden-layer neural network across simulated and real datasets spanning a range of biological and technical complexity. CONCORD consistently outperforms state-of-the-art methods, producing high-resolution, denoised encodings that robustly capture diverse structures—including clusters, loops, trajectories and trees—reflecting bona fide biological processes even when the data originate from multiple technologies, time points or species. This versatile framework scales from small to large datasets, generalizes to modalities beyond scRNA-seq and establishes a rigorous foundation for next-generation single-cell machine learning models to drive diverse downstream biological discoveries.
Results
The CONCORD framework
Analyses of single-cell sequencing data suggest that gene expression is not randomly sampled; rather, gene-regulatory mechanisms impose strong constraints, producing dynamically changing gene coexpression patterns reflected as intricate structures in the low-dimensional embedding of cells1,2,3,30. For example, at homeostasis, cells typically form discrete clusters corresponding to stable types or states, with adjacent clusters representing closely related states (Fig. 1a, left). In developmental or pathological contexts—such as early embryogenesis, tissue repair or tumorigenesis—cells often follow branching trajectories from progenitors to terminal fates, with semistable intermediate states forming denser clusters (Fig. 1a, middle). Cyclic gene expression programs, such as those regulating the cell cycle, give rise to loop-like structures3,31 (Fig. 1a, right).
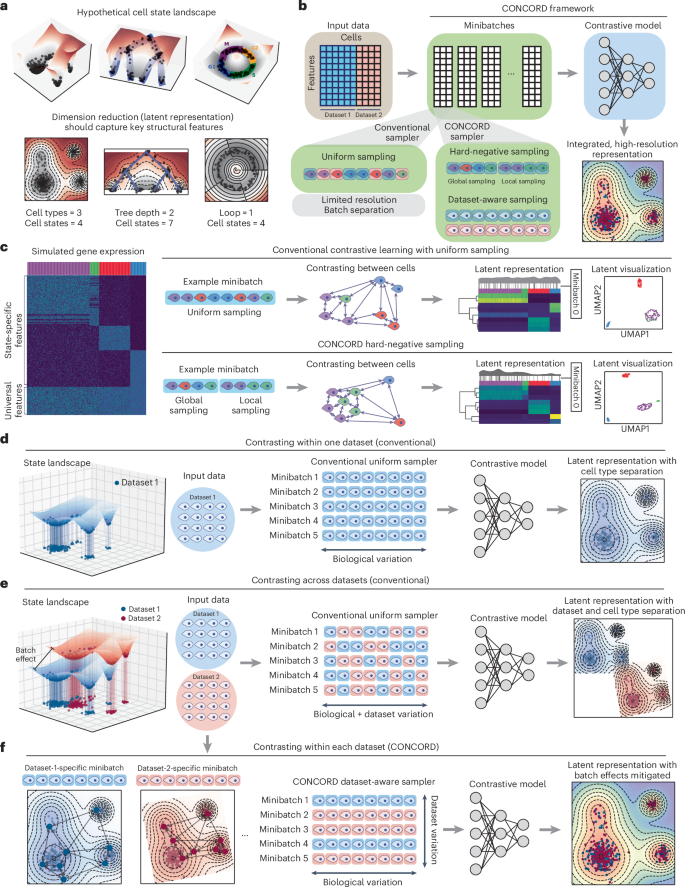
a, Schematic of hypothetical cell-state landscapes and corresponding low-dimensional representations that capture key structural features. b, Overview of the CONCORD framework, which replaces the conventional minibatch sampler with a joint hard-negative and dataset-aware sampling scheme, enabling integrated, high-resolution representation learning with a minimalist contrastive model. c, Uniform versus hard-negative sampling in a simulated four-state dataset. Heat maps show simulated expression and latent space, accompanied by density curves with black lines indicating the distribution of cells in an example minibatch under each scheme. Resulting UMAP embeddings are shown. d, Contrastive learning on a single dataset using the conventional uniform sampler, which draws cells uniformly from the entire dataset to form minibatches. e, Standard contrastive learning mixes cells from different datasets within minibatches, amplifying batch effects in the resulting latent embedding. f, CONCORD mitigates batch effects by predominantly contrasting cells within each dataset and randomly shuffling minibatches during training.
To capture these intricate structures, CONCORD uses contrastive learning with a minibatch sampling strategy that differs from conventional uniform sampling (Fig. 1b). First, to enhance resolution, we adopt hard-negative sampling32, where each minibatch is enriched with closely related cells (Fig. 1c), encouraging the model to extract features that distinguish these ‘hard negatives’. We implemented two variants of this approach: a k-nearest neighbor (kNN)-based sampler, inspired by and extending previous work33, and the hcl mode originally proposed by Robinson et al.32. The kNN-based sampler probabilistically draws cells from both their local neighborhoods and the global distribution. Local sampling—guided by a coarse graph approximation of the cellular state landscape—compels the model to contrast each cell with its neighbors, enabling detection of subtle differences between closely related states. Simultaneously, global sampling preserves a broad perspective of major cell types, ensuring robust encoding of large-scale distinctions. By iteratively presenting the model with local neighborhoods (for example, T cells in one minibatch and epithelial cells in another) alongside the global distribution, the model allocates capacity to represent both large-scale distinctions and nuanced local details, leading to improved resolution in the learned latent space (Fig. 1c). Following a similar principle, the hcl mode uses Monte Carlo importance sampling to approximate the expected loss of hard-negative sampling without explicit neighborhood-based sampling (Methods).
When applied to a single dataset, contrastive learning effectively captures biological variation in the latent space (Fig. 1d). However, with uniform sampling across multiple datasets, both biological and dataset-specific variations are encoded, yielding a latent space that separates by dataset and cell type (Fig. 1e). To address this, we introduce a dataset-aware sampler that restricts each minibatch to cells from a single dataset, ensuring contrasts reflect only biological differences—as in the single-dataset setting (Fig. 1f). Dataset-specific biases are further diminished through random minibatch shuffling; if such signals are encoded in one batch, they are disrupted and overwritten by subsequent minibatches from other datasets. Consequently, only biologically meaningful signals, such as gene coexpression patterns, persist throughout training, producing a latent space that reflects biological variation with minimal batch effects (Fig. 1f). In cases where datasets have minimal or no shared cell states, a leaky dataset-aware sampler enables soft alignment without imposing artificial harmonization, supporting flexible integration that respects dataset-specific signals (Extended Data Fig. 1a). Notably, this approach does not perform any explicit modeling of batch effects; instead, it selectively captures and encodes biological programs shared across datasets. Unlike prior batch-correction strategies that struggle in contrastive settings because of competing objectives, CONCORD integrates batch correction directly into the contrastive learning process through its sampling design, producing latent representations inherently robust to batch effects.
Both the hard-negative and the dataset-aware samplers follow a unified principle: probabilistically structuring minibatches to balance global biological diversity with local and dataset-specific variation. We integrate both samplers into a joint sampling framework, where the likelihood of selecting a cell satisfies both sampling schemes (Extended Data Fig. 1a,b and Methods). This generalized sampling strategy fundamentally reconfigures contrastive learning, enabling high-resolution representation learning and robust dataset integration within a single contrastive objective, and forms the core of the CONCORD framework (Extended Data Fig. 1c). With this simple innovation, CONCORD outperforms state-of-the-art methods using only a minimalist encoder with a single hidden layer, demonstrating that sampling design alone can transform contrastive learning performance on single-cell data—even without deep or complex architectures. This simplicity reduces training data requirements, enhances robustness and increases interpretability of the learned latent space.
CONCORD learns denoised latent representations that preserve underlying structures
Recovering biologically meaningful insights from single-cell data requires preserving the underlying geometric and topological structure of the gene expression space. To evaluate whether CONCORD meets this criterion, we benchmarked its performance on a suite of simulated datasets. As existing simulators often fail to generate complex biological structures like branching or loops, we developed a custom workflow to create realistic structures with flexible control over noise and batch effects (Fig. 2a).

a, Schematic of the simulation pipeline, which first produces a noise-free gene expression matrix based on a user-defined data structure, then introduces noise following a specified noise model and finally applies batch effects. b, Schematic of the benchmarking pipeline. Latent representations from each method are compared with the noise-free ground truth to assess preservation of topological and geometric features. The scIB metrics34 and probing classifiers are used to evaluate biological label conservation and batch harmonization. c, Performance of CONCORD and competing methods on a three-cluster simulation with dimensions listed. UMAP embeddings, cosine distance matrices and persistent homology analysis (persistence diagram and Betti curves) are shown for each method. The H0 point at infinity was excluded from the persistence diagram and curve. d, Performance on a complex trajectory with three loops, highlighting the same diagnostic plots as in c. e,f, Summary of key geometric and topological performance metrics for the cluster simulation (e) and the complex trajectory simulation (f). g, kNN graph visualization of the latent spaces from a complex-tree simulation, with zoomed-in views of the highlighted branch.
To assess the quality of learned representations, we established a comprehensive evaluation pipeline. While standard benchmarks like the single-cell integration benchmarking (scIB) framework34 effectively measure label preservation and batch mixing, they are often insufficient for evaluating the preservation of complex biological structures35,36. We, therefore, supplemented them with probing classifiers37,38—a standard approach for evaluating representation learning—to assess the conservation of biological labels in the latent space. Additionally, to quantify structure fidelity, we incorporated geometric metrics such as trustworthiness and global distance correlation, as well as topological data analysis (TDA) based on persistent homology and Betti numbers (Fig. 2b). These metrics evaluate embedding at complementary scales: trustworthiness quantifies local neighborhood preservation, while persistent homology captures global topological features—such as clusters (Betti-0), loops (Betti-1) and voids (Betti-2). These features are visualized in persistence diagrams and Betti curves, where stable structures appear as long-lived features in the persistence diagram and extended plateaus in the Betti curve, whereas transient, noise-induced features vanish quickly.
We evaluated both CONCORD variants on a simple, single-batch simulation consisting of three well-separated clusters corrupted by cluster-specific Gaussian noise (Fig. 2c and Extended Data Fig. 2a). Compared to a broad set of dimensionality-reduction methods—including diffusion map39, NMF5, factor analysis6, FastICA40, latent Dirichlet allocation41, zero-inflated factor analysis (ZIFA)42, scVI10 and potential of heat diffusion for affinity-based trajectory embedding (PHATE)43—CONCORD cleanly separated clusters, as reflected in both the latent space and pairwise distance matrices. In contrast, many methods failed to fully resolve the clusters or introduced spurious structures, such as trajectory-like artifacts (Fig. 2c). Persistent homology confirmed these observations; CONCORD’s Betti-0 plateau accurately reflected the expected three-cluster topology and closely matched the noise-free reference, highlighting its strength in both denoising and structure preservation.
On a more complex simulation with three loops and multiple branching points (Fig. 2d and Extended Data Fig. 2b), CONCORD faithfully recovered the complete topology. By contrast, other methods either distorted the structure or failed to detect the correct number of loops in Betti analysis, likely because of excessive noise retention. Although PHATE produced a visually similar embedding, its Betti curve identified only a single persistent loop, indicating that critical topological features were obscured in its latent space.
Quantitative evaluation of geometric and topological metrics confirmed that CONCORD consistently outperformed competing methods (Fig. 2e,f). Notably, CONCORD maintained high trustworthiness across a wide range of neighborhood sizes, underscoring its ability to preserve local geometry at multiple scales (Extended Data Fig. 2c,d). In contrast, other methods exhibit considerable declines in trustworthiness, indicating a loss of fine-scale geometric relationships.
To assess the impact of hard-negative sampling, we simulated a hierarchical branching tree (Fig. 2g and Extended Data Fig. 2e–g). Without hard-negative sampling, subbranches were unresolved. Moderate enrichment of hard negatives substantially improved resolution for both CONCORD variants, with the kNN mode being more susceptible to excessive local focus, which obscured global distinctions (Extended Data Fig. 2f,g).
CONCORD learns a coherent, batch-effect-mitigated latent representation
Batch effects often appear as dataset-specific global signals that can obscure biological variation. In CONCORD, these signals rapidly diminish during training when minibatches are restricted to single datasets (Fig. 1f). Unlike conventional batch-correction methods that rely on explicit alignment models, CONCORD makes minimal assumptions about the source or form of batch effects and instead prioritizes learning coherent, biologically meaningful gene covariation patterns. This leads to more accurate preservation of biological structure while mitigating technical artifacts.
We first evaluated CONCORD on a simulated five-cluster dataset with varying noise, batch effects and batch size imbalance (Fig. 3a and Extended Data Fig. 3a). Across these conditions, CONCORD was the only method to robustly recover all five clusters. This success is attributable to its dataset-aware sampler, as using a conventional uniform sampler (that is, the naive contrastive approach) resulted in pronounced batch effects. In more challenging scenarios with more batches and greater imbalance, CONCORD and Harmony were the only methods that consistently separated the underlying clusters (Extended Data Fig. 3b).

a, Two-batch, five-cluster simulation with imbalanced batch sizes. Heat maps show the noise-free ground truth and the input data with noise and batch effects. Latent spaces from each method are visualized by UMAPs, colored by batch. Full cluster simulation results are in Extended Data Fig. 3a,b. ‘Contrastive’ refers to naïve contrastive learning that uses the same encoder architecture and objective as CONCORD but with uniform sampling. b, Trajectory simulation with varying degrees of state overlap between batches. The input structure is shown by a heat map and PCA. For each method, the latent space is visualized by a kNN graph (k = 15) colored by simulated time to assess cross-batch integration along the trajectory. c, Loop simulation with varying degrees of state overlap between batches. kNN graphs are shown for the ground truth (edges omitted) and for CONCORD and selected methods. Full results are in Extended Data Fig. 3c. d, Tree simulation with varying degrees of state overlap between batches. kNN graphs are shown for the ground truth, CONCORD and selected methods. Full results are in Extended Data Fig. 3d. e, Trajectory simulation with 16 batches, each with a different batch effect, as shown by the heat map. kNN graphs (k = 15) colored by batch are shown for each method’s latent embedding. For scVI and both CONCORD modes (hcl and kNN), kNN graphs colored by simulated time are also shown. A table displaying detailed benchmarking metrics is provided (metric definitions in Methods). f, Trustworthiness across neighborhood sizes for the multibatch simulation in e. g, Prediction with limited training data for scVI and CONCORD. A specified number of batches were held out during training. We ran 5 replicates with random batch withholding and quantified batch mixing using the kNN-based batch classification error (k = 30). Means and 95% confidence intervals are plotted. h, Ranking of integration methods across simulated data, showing ranks for batch correction, biological label conservation, topological and geometric metrics, and overall score. For cluster simulations, Betti curves became noisy when the number of clusters exceeded three and we did not find a robust way to infer Betti numbers; therefore, topology scores were excluded for these datasets.
Single-cell studies often involve continuous state transitions sampled across different conditions, where cell states may only partially overlap. Methods that make explicit assumptions about the data structure—such as requiring matched clusters—often fail in these scenarios and produce distorted embeddings. We systematically tested this by simulating batch effects on trajectories, loops and trees with varying degrees of state overlap (Fig. 3b–d and Extended Data Fig. 3c,d). Many competing methods exhibited poor alignment and introduced artificial structures. In contrast, both CONCORD variants consistently recovered the correct topology with reduced noise, even when the overlap between batches was minimal.
We further tested performance on a trajectory with 16 distinct batch effects (Fig. 3e). While scVI and CONCORD both aligned the batches, scVI showed incomplete alignment at fine resolution. In contrast, CONCORD—particularly the kNN variant—achieved superior alignment and noise reduction. Quantitative metrics confirmed these observations; CONCORD preserved local geometry, evidenced by high trustworthiness (Fig. 3e,f), while exhibiting lower global distance correlation—a common trade-off in manifold learning44,45. Robustness was further demonstrated in a stress test where models were trained on a few randomly selected batches and used to predict the remaining ones (Fig. 3g). CONCORD maintained strong alignment, whereas scVI’s performance degraded markedly as the number of training batches decreased. This suggests CONCORD’s robustness stems from learning gene coexpression programs rather than explicitly modeling and correcting batch effects.
Across all simulations, CONCORD achieved high biological label conservation (Fig. 3h and Supplementary Table 1), with slightly lower batch-correction scores because it does not explicitly merge batches. By contrast, although scVI achieved high batch-mixing scores, it often produced overmixed embeddings that obscured underlying structure (Extended Data Fig. 3). The aggregate geometric score for CONCORD was reduced by its lower global distance correlation despite consistently strong trustworthiness; however, for data with manifold structures—such as single-cell data—global distances are often not reflective of true distance relationships between cell states43. Therefore, preserving local neighborhood fidelity is typically prioritized in single-cell analysis43,46. Nevertheless, CONCORD consistently ranks among the top methods for topological preservation, biological label conservation and overall performance. These results demonstrate that CONCORD provides a reliable and generalizable framework for dimensionality reduction and batch correction, even when the data structure is unknown or batch overlap is limited.
CONCORD aligns whole-organism developmental atlases and resolves high-resolution lineage trajectories
To assess whether CONCORD captures biologically meaningful structures, we benchmarked it against popular integration methods on Caenorhabditis elegans embryogenesis—a well-characterized system with a nearly invariant lineage tree47 that is also conserved in the related species Caenorhabditis briggsae48. Packer et al. initially generated a lineage-resolved atlas of C. elegans49, which was recently expanded by Large et al. to include over 200,000 C. elegans cells and 190,000 C. briggsae cells48. With expert-curated annotations generated through iterative, labor-intensive zoom-in analyses and validated by fluorescence imaging, these datasets provide an ideal benchmark for evaluating whether integration methods can accurately reconstruct and align developmental trajectories across species.
We first tested CONCORD on the original C. elegans atlas49 (>90,000 cells) (Extended Data Fig. 4a). The resulting embedding revealed disconnected trajectories among early-stage cells, which we hypothesized reflected missing states. These gaps persisted even after including C. elegans cells from the expanded Large et al. dataset. We, therefore, collected a new C. elegans dataset enriched for early embryos; adding this dataset resolved the gaps and yielded a continuous trajectory from zygote to terminal fates (Extended Data Fig. 4a). Using the extensive cell type and lineage annotations, we benchmarked CONCORD against other methods for batch correction and label conservation and assessed its sensitivity to key hyperparameters (Extended Data Fig. 4b–e). CONCORD greatly outperformed existing methods, with stable performance across the recommended hyperparameter range. Notably, the effect of hard-negative sampling mirrored trends observed in simulations; moderate local enrichment improved resolution, whereas excessive local sampling disrupted global structure (Extended Data Fig. 4f).
When applied to over 410,000 cells from the combined cross-species dataset and our new early-embryo collection, CONCORD generated a unified developmental atlas that closely matched the expert annotations, achieving cross-species alignment and resolving lineages at ultrahigh resolution (Fig. 4a,b). Both the hcl and kNN modes yielded similar, high-quality embeddings (Fig. 4a and Extended Data Fig. 5a). Because scIB34 could not scale to this dataset, we quantified integration performance using probing classifiers to assess batch mixing, cell type and lineage label preservation (Fig. 4c). CONCORD excelled on these metrics, whereas other methods either failed to fully align the species or lost resolution, consistent with visual inspection of the uniform manifold approximation and projection (UMAP) embeddings. As the complexity of the learned structure exceeded the capacity of two-dimensional (2D) UMAP, we encourage readers to explore the interactive three-dimensional (3D) visualizations (https://qinzhu.github.io/Concord_documentation/galleries/cbce_show/#__tabbed_1_1).

a, UMAPs from CONCORD and other integration methods, colored by inferred embryo time and species. Zoomed-in UMAPs for scVI and CONCORD (hcl) show approximately matched regions, colored by lineage and species. b, Global 2D and 3D CONCORD (hcl) embeddings colored by cell type and inferred embryo time. c, Overlap between expert-curated cell type and lineage annotations. A histogram shows lineage annotations concentrated in early-stage cells and cell type annotations predominantly in late-stage cells. Integration performance was evaluated separately for early-stage cells (lineage labels) and late-stage cells (cell type labels) using probing classifiers. d, Global 3D UMAPs of CONCORD, scVI and Harmony, highlighting cells mapped to the lineage subtree that give rise to ASE, ASJ and AUA neurons. For each method, the most representative view was selected. e, Heat map showing the top 50 most variable latent dimensions in the ASE, ASJ and AUA neuron subset for scVI, Harmony and CONCORD (hcl). Expression of gcy-5 and gcy-14 is overlaid on a zoomed UMAP recomputed from the CONCORD latent space. f, Lineage purity and average lineage distance computed across 2,000 randomly selected kNN neighborhoods for each method. For each randomly sampled anchor cell, we retrieve its k-nearest neighbors in the embedding and compare their lineage relationships to the lineage graph. Purity is the fraction of neighbors assigned to the same lineage as the anchor; average lineage distance is the mean hop distance on the lineage tree from the anchor to its neighbors. Box plots show the median (center line), quartiles (box limits), 1.5× the interquartile range (whiskers) and outliers (points). g, Zoomed-in UMAPs for mesoderm (excluding pharynx), highlighting major input lineages and cell types. Each lineage is represented by its cluster medoid; edges connect parental lineages to daughters following the lineage tree. h, Zoomed-in UMAPs for pharynx, annotated by cell type and broad input lineages. Selected lineage paths to pm1/2, pm3–pm5 and pm7 are highlighted. i, scVI and CONCORD were trained on the combined C. elegans data from Packer et al.49 and our newly collected batch and then used to project the full atlas including C. elegans and C. briggsae data from Large et al.48. Resulting UMAPs are colored by species and integration performance was evaluated with probing classifiers. Acc., accuracy; annot., annotation; avg., average.
Projecting the lineage tree onto CONCORD’s embedding revealed strong concordance with established lineage and fate relationships (Extended Data Fig. 5b). For example, the ASE, ASJ and AUA neurons—derived from AB progenitors—formed branching trajectories that mirrored their true lineage structure (Fig. 4d). In contrast, other methods introduced discontinuities, failed to resolve key bifurcations or generated artificial structures. Strikingly, CONCORD’s latent space resolved ASE-left and ASE-right neurons, characterized by differential expression of GCY receptors (Fig. 4e). Although morphologically symmetric, these neurons exhibit functional asymmetry in salt-sensing responses50,51.
To systematically assess preservation of lineage structure in the latent space, we evaluated lineage purity and average lineage distance within randomly selected kNN neighborhoods, with k ranging from 30 to 300 (Fig. 4f). We reasoned that if a latent representation reflects lineage structure, each cell’s neighbors should belong predominantly to the same lineage or an immediate relative—captured by high purity and low average lineage distance. CONCORD maintained high lineage purity even at large values of k. Furthermore, neighboring cells from different lineages were often close relatives, as reflected by a low average lineage distance. In contrast, other methods produced embeddings with substantially more mixed-lineage neighborhoods. Collectively, these findings indicate that the CONCORD latent space preserves genuine lineage structures, enabling refinement of existing annotations (Extended Data Fig. 5c) and highlighting its broader utility for inferring bona fide differentiation trajectories in developmental studies52,53.
In addition to fate bifurcation in neuronal development, fate convergence from different lineages is a common pattern in C. elegans organogenesis. In the context of muscle formation, CONCORD accurately resolved how the MS, C and D lineages converge into well-resolved subbranches of body wall muscle, as well as rare convergence events such as the integration of ABplp/ABprp-derived and MS-derived cells into intestinal muscle (mu_int) (Fig. 4g). Pharyngeal development—featuring complex branching and convergence of AB-derived and MS-derived cells—was likewise resolved in detail by CONCORD (for example, pm3–pm5 deriving from both AB and MS lineages, and pm1–pm2 and pm6–pm8 specific to AB/MS lineages), whereas other methods recovered fewer fine-grained details (Fig. 4h). Crucially, all analyses were performed directly in CONCORD’s global latent space, without subset-specific highly variable gene (HVG) selection or realignment—steps that are often necessary for other methods.
Lastly, to test model generalizability, we trained CONCORD and scVI on a subset of C. elegans batches and projected them onto unseen C. elegans and all C. briggsae data (Fig. 4i). CONCORD successfully integrated the held-out batches, aligned the two species and resolved the majority of cell types. In contrast, scVI produced a markedly lower-quality projection, with poor cross-species alignment and diminished cell type resolution.
CONCORD captures cell cycle and differentiation trajectories in mammalian intestinal development
Unlike C. elegans, where early divisions are largely driven by maternal transcripts54, mammalian development involves extensive proliferation coupled with ongoing differentiation. To assess whether CONCORD can resolve these intertwined processes, we applied it to a single-cell atlas of embryonic mouse intestinal development55, which spans multiple developmental stages, batches, spatial segments and enriched cell populations—posing a challenging integration task because of incomplete batch coverage.
CONCORD effectively integrated the data and resolved fine-grained substructures across diverse cell types (Fig. 5a and Extended Data Fig. 6a). Both hcl and kNN modes revealed loop-like patterns within many cell types—as evidenced by persistent homology—and often missed by other methods (Fig. 5b–d and Extended Data Fig. 6b). The majority of these loops correspond to cell-cycle progression, supported by progressive expression of cell-cycle gene programs along the loops (Extended Data Fig. 6b). For example, in intestinal epithelial cells, CONCORD not only resolved rare subtypes such as enteroendocrine cells but also revealed two parallel trajectories—each encompassing both a cell-cycle loop and a differentiation path—corresponding to stem cell proliferation and differentiation in spatially distinct regions (Fig. 5b). These structures were not captured by other methods and were supported by adult zonation markers such as Bex4 and Onecut2 (ref. 56), suggesting that CONCORD can detect epithelial zonation as early as embryonic day 13.5.

a, The 2D and 3D UMAP visualizations of CONCORD (kNN mode) latent space, colored by cell type and cell-cycle phase, with UMAPs from scVI and Seurat (colored by cell type) for comparison. b, Zoomed-in views of epithelial cells in the 3D global UMAP, colored by cell subtype, zonation and expression of zonation-specific markers (Bex4 and Onecut2). A red marker and arrow indicate the viewing angle within the 3D global UMAP. Persistence diagrams are shown for scVI and CONCORD. c, Zoomed-in view of ENS cells, colored by cell-cycle phase and cell state or branch annotations, based on Morarach et al.57, along with state-specific marker expression. A red marker and arrow indicate the viewing angle. Persistence diagrams are shown for CONCORD and scVI. d, Zoomed-in view of Pdgfra− mesenchymal cells and smooth muscle cells, colored by cell-cycle phase, subtype annotation and selected subtype-specific markers. A red marker and arrow indicate the viewing angle. e, Heat map of latent representations generated by CONCORD (kNN), Seurat and scVI. f, Interpretation of the CONCORD latent space using gradient-based attribution techniques. Activation of Z46 in epithelial and ENS cells is attributed to the coexpression of epithelial-specific and neuron-specific gene sets in their respective contexts. Gene Ontology (GO) enrichment analysis of these gene sets is shown. FDR, false discovery rate.
In the enteric nervous system (ENS), CONCORD captured the cell cycle of Sox10⁺ progenitor cells and identified two distinct branches of neuronal development marked by Etv1 and Bnc2, matching previous observations57 (Fig. 5c). These branches appear to converge through shared expression of neuronal maturation genes broadly active at late stages of both branches (Extended Data Fig. 6c).
In mesenchymal cells—which comprise a major fraction of this dataset—CONCORD uncovered extensive heterogeneity within the Pdgfra− and smooth muscle populations (Fig. 5d). These included four consecutive cell-cycle loops marked by the expression of Ebf1, Slit2, Kit and Acta2, with gradual transitions between the loops. Notably, Ebf1 and Slit2 have been linked to mesenchymal multipotency58,59, while Kit marks interstitial cells of Cajal and their progenitors60. Unlike traditional approaches where cell cycle often confounds cell type annotation, CONCORD preserves both proliferation and differentiation structure, enabling the identification of previously uncharacterized subpopulations. The complexity of these structures necessitates 3D visualization and we encourage readers to explore the interactive embeddings (https://qinzhu.github.io/Concord_documentation/galleries/huycke_show/).
Unlike Seurat and scVI, which left many latent dimensions underused, CONCORD produced a dense and interpretable latent space that reflects rich biological structure and makes full use of its representational capacity (Fig. 5e). Each latent dimension typically encapsulates multiple gene coexpression programs, which can be interpreted at either single-cell or cell-state resolution using gradient-based attribution methods61 in a context-dependent manner (Fig. 5f). For instance, latent neuron 46 (Z46) is activated in both epithelial cells and ENS cells but attribution analysis revealed that it is driven by two distinct sets of highly coexpressed genes depending on the cellular context (Fig. 5f and Extended Data Fig. 6c). In epithelial cells, Z46 activation is linked to goblet-cell-specific genes enriched in glycosylation pathways, whereas, in ENS cells, it reflects neuronal maturation genes expressed in late-stage neurons. Notably, neither gene set shows strong expression outside its respective context, demonstrating that the CONCORD latent space captures biologically meaningful, context-specific gene coexpression programs.
CONCORD generalizes across modalities and scales
CONCORD’s domain-agnostic design allows it to be applied to diverse data modalities beyond scRNA-seq. We tested this on a challenging single-cell ATAC-seq benchmark dataset comprising peripheral blood mononuclear cells (PBMCs) from two donors profiled across eight different technologies62 (Fig. 6a). On both quantitative metrics and visual inspection of the embeddings, CONCORD yielded much better batch correction and biological label conservation than other methods, including the original study’s Harmony-based analysis (Fig. 6b,c and Extended Data Fig. 7a,b).

a, Schematic of the PBMC scATAC-seq benchmarking experiment spanning multiple technologies and experimental batches62. b, Summary scores for all integration methods on the PBMC scATAC-seq data; detailed metric values are provided in Extended Data Fig. 7b. c, The t-distributed stochastic neighbor embeddings from the original publication (Harmony integration) and embeddings produced by scVI and CONCORD, colored by batch and original cell type annotations. To refine annotations, we analyzed paired scRNA-seq datasets with CONCORD and projected the refined labels onto the scATAC-seq embedding through shared scMultiome cells. d, Schematic of the experimental design for the breast cancer tumor microenvironment sample, where a single formalin-fixed paraffin-embedded tissue block was analyzed with multiple technologies63. UMAP embeddings derived from the CONCORD and scVI latent spaces are colored by batch and original cell type annotations. Full results for all integration methods are shown in Extended Data Fig. 7c. e, Hematoxylin and eosin image and overlay of cell type annotations based on Xenium data, reproduced under the Creative Commons Attribution 4.0 International License from the original publication63 without modification. The experiment was performed in replicate on two serial sections and one representative section is shown here. f, Ranking of integration method performance across all real-world benchmarking datasets, excluding datasets where scIB metrics could not be robustly computed. Each method was scored on both batch correction and biological label conservation metrics, and the overall rank was computed on the basis of the average score. Missing values indicate methods that failed to run because of excessive resource demands or violated model assumptions. g, Runtime of integration methods across all real-world benchmarking datasets. *Harmony was run using a reduced-dimensional PCA projection, whereas all other methods were applied to gene expression matrices with 5,000–10,000 variable features.
The CONCORD embedding revealed fine-grained immune subtypes not present in the original annotations. To validate these, we refined the cell type labels using paired scRNA-seq and scMultiome data and projected them back onto the scATAC-seq embedding through shared scMultiome cells (Fig. 6c). Strikingly, refined clusters in scRNA-seq (for example, naive and memory B cells) corresponded precisely to clusters uncovered by CONCORD in scATAC-seq. This validation also uncovered a misannotation in the original study, where CD8⁺ naive T cells were incorrectly labeled as CD4⁺ T cells. Therefore, CONCORD greatly improved analysis on existing scATAC datasets. Notably, CONCORD achieved this high-resolution result using only simple log normalization, forgoing the complex, modality-specific data transformations often required for scATAC-seq analysis.
When applied to a breast cancer tumor microenvironment sample profiled with Xenium, 3′ and 5′ scRNA-seq and fixed RNA profiling technologies63—sharing only 307 genes—CONCORD in hcl mode achieved markedly better integration and cell type resolution than other approaches (Fig. 6d and Extended Data Fig. 7c). A key finding of the original study was that two DCIS (ductal carcinoma in situ) subtypes exhibit distinct adjacent microenvironments; DCIS-1 is bordered by both KRT15⁺ and ACTA2⁺ myoepithelial cells, whereas DCIS-2 is encircled exclusively by ACTA2⁺ myoepithelial cells (Fig. 6e). Notably, without access to spatial coordinates, CONCORD recapitulated these adjacency patterns by revealing differential connectivity between DCIS and myoepithelial clusters—consistent with signal bleed or segmentation-related transcript carryover commonly observed in spatial single-cell assays64.
Lastly, we benchmarked CONCORD on six additional scRNA-seq datasets curated by the Open Problems in single-cell analysis initiative65, including Tabula Sapiens (>1 million cells)66. CONCORD consistently achieved top performance across these datasets (Fig. 6f and Supplementary Table 2) while running substantially faster and with modest RAM/VRAM requirements (Fig. 6g and Extended Data Fig. 7d). By contrast, several methods—including LIGER, Scanorama and Seurat—failed to run at atlas scale because of heavy resource demands or violations of method assumptions. CONCORD-derived 2D UMAP embeddings for these datasets are provided in Extended Data Fig. 8 and additional examples, tutorials and resources are available on the CONCORD documentation website (https://qinzhu.github.io/Concord_documentation/).
Discussion
Minibatch gradient descent underpins modern machine learning, including large language models, foundation models and diffusion models. Growing evidence suggests that the composition of these minibatches can influence model performance67,68. In contrastive learning, where each sample is contrasted against others within a minibatch, this effect is amplified, especially in biological datasets spanning multiple batches, where naive sampling can exacerbate batch effects and distort learned representations. Yet, in contrastive learning for single-cell data, uniform random sampling remains the norm, limiting the method’s ability to capture biologically meaningful structure.
Our central insight is that, in contrastive learning, minibatch composition not only influences but fundamentally shapes the outcome. By rethinking how minibatches are assembled, we turn contrastive learning’s sensitivity to minibatch composition into a strength.
At the core of CONCORD is a unified probabilistic sampler that integrates hard-negative sampling with dataset-aware sampling. Hard-negative sampling markedly enhances the representational power of the contrastive model, enabling it to capture intricate gene coexpression programs that separate closely related cell states. The dataset-aware sampler enriches each minibatch with cells from a single dataset, allowing the model to learn biological variation without entangling batch effects. Unlike traditional methods that rely on matched clusters or explicit batch-effect models, CONCORD mitigates batch effects solely through principled sampling and training. As a result, it aligns cells based on shared covarying features—a hallmark of single-cell data69,70,71—making it especially robust when datasets have minimal overlap or unusual geometric and topological structures. The dataset-aware strategy integrates seamlessly with either the hcl or kNN hard-negative sampling variants, with both configurations yielding robust batch correction and faithful structure preservation across diverse benchmarks.
CONCORD achieves state-of-the-art performance using a minimalistic encoder architecture, demonstrating that substantial gains can be achieved through rational sampling and training alone, without relying on deep architectures, complex objectives or supervision. Across both simulated and real datasets of varying scales and modalities, CONCORD consistently learns latent spaces that are denoised, interpretable and topologically faithful. In whole-organism embryogenesis atlases, it accurately reconstructs fate bifurcations and lineage convergences, enabling detailed tracing from progenitor cells to terminal states. In contrast, existing methods often misalign these datasets, lose resolution or fragment continuous trajectories. In mammalian intestinal development, CONCORD captures complex hierarchies, spatial zonation and cell-cycle loops—all within a single integrated analysis. Unlike traditional workflows that regress out cell-cycle effects, CONCORD preserves and resolves both proliferative and differentiation programs, facilitating investigations into their interplay. Its interpretable latent space further enables gradient-based attribution analyses, allowing gene-level mechanistic insights at single-cell or cell type resolution.
CONCORD features a speed-optimized, memory-efficient design. Key components including a vectorized sampling algorithm, native sparse matrix support and out-of-core data loading enable it to readily analyze million-cell atlases that may exceed available system memory. While the current implementation emphasizes simplicity, the framework is fully extensible to more complex architectures such as deeper neural networks or transformers72 to support more intricate data modalities or biological contexts. This minimalist design reduces the number of tunable parameters, although several hyperparameters, such as PkNN in the kNN mode and β in the hcl mode that control the degree of hard-negative sampling, remain critical for optimal performance. Our benchmarking provides practical guidance for their tuning, showing that balanced local and global sampling—achieved with moderate PkNN or β—ensures robust performance across datasets. We currently adopt the hcl mode as the default because of its robust performance across real-world datasets and lower parameter complexity but will continue to explore additional sampling strategies and maintain best-practice guidelines on the CONCORD documentation website.
Beyond the core contrastive encoder, CONCORD supports optional decoder and classifier modules for gene-level batch correction, label transfer and annotation-guided representation learning. Preliminary results suggest that these built-in utilities benefit from the model’s robust latent space, although further validation is ongoing. In addition, the batch-aligned, information-rich latent space can be readily leveraged by established downstream methods—for example, through gradient-based attribution to uncover context-specific gene coexpression programs or through tools such as CellANOVA13 to recover subtle biological signals and batch-corrected gene expression after integration.
As CONCORD aligns datasets by leveraging shared gene coexpression structures, its performance may be compromised when these structures are substantially distorted by batch effects. For example, we observed suboptimal alignment between single-nucleus and whole-cell scRNA-seq data, likely reflecting systematic differences in gene covariance structure caused by transcript localization. Similarly, feature selection strategies and the biological context of the input can influence alignment outcomes. For instance, when integrating tumor microenvironment datasets across individuals, using only tumor cells may yield different alignment patterns compared to integrating all cell types in the tumor microenvironment, as HVG selection and the resulting coexpression structure depend on the cellular context.
Importantly, the principles underlying CONCORD are not limited to single-cell sequencing. The fundamental challenge of disentangling technical artifacts from meaningful biological heterogeneity is shared across many high-dimensional data modalities, including spatial proteomics and high-content imaging. These data types are also characterized by rich covarying features. Thus, the joint dataset-aware and hard-negative sampling framework presented here provides a powerful and generalizable strategy for learning robust representations from diverse and complex biological datasets, paving the way for deeper, integrated analyses across experiments and technologies.
Methods
Self-supervised contrastive learning and sparse coding
We implemented CONCORD in PyTorch, building on a self-supervised contrastive learning framework inspired by SimCLR21 and SimCSE22, but with a unique dataset-aware and hard-negative sampling design. The core training objective is the normalized temperature-scaled cross-entropy (NT-Xent)21, applied to cell representations generated through random masking.
Theoretically, contrastive learning with ReLU networks and random masking augmentation can provably recover underlying sparse features from data approximated as follows:
where Mz represents the sparse signal with \({{||z||}}_{0}=\widetilde{O}(1)\) and ε denotes noise24. CONCORD adopts similar conditions, using LeakyReLU activations and independent random masking augmentations to capture gene coexpression patterns while suppressing noise.
This sparse coding approach generalizes beyond traditional dimensionality-reduction methods such as NMF, PCA, factor analysis and VAEs. Unlike these methods, it does not enforce orthogonality on M (as in PCA), require non-negativity constraints (as in NMF), assume a probabilistic generative model (as in factor analysis and VAEs) or impose Gaussian priors on the latent space (as in standard VAEs). Instead, it assumes an intrinsic low-rank structure shaped by gene coexpression programs, as supported by single-cell studies69,70,71. By relaxing constraints on orthogonality, non-negativity and Gaussian priors, the contrastive learning framework is better positioned to capture diverse gene-regulatory programs that deviate from conventional assumptions. Moreover, random masking enhances robustness to scRNA-seq dropout and improves biological interpretability, allowing the latent space to more faithfully encode diverse cell states.
Model architecture
CONCORD emphasizes architectural flexibility and minimalism. For all benchmarking analyses presented in this study, we used a single-hidden-layer encoder to demonstrate performance gains attributable to sampling and training alone. However, the architecture is fully extensible; users may substitute the encoder with more advanced models—such as deeper neural networks or transformers—to accommodate different data modalities or capture higher-order biological structures.
-
(1)
Data augmentation
Input gene expression values are normalized by total count and log-transformed. Two complementary augmentation strategies are applied to each minibatch.
-
Feature-wise masking randomly sets the expression of a specific gene to zero across all cells in the minibatch with a user-defined probability, simulating systematic gene dropout.
-
Element-wise masking randomly sets the expression of specific genes to zero in individual cells with a user-defined probability, mimicking localized noise or missing data.
Both strategies encourage the encoder to reply on gene coexpression patterns rather than individual gene signals, improving generalization and robustness to noise.
-
(2)
Encoder
The encoder maps masked gene expression vectors to low-dimensional embeddings. By default, it is implemented as a fully connected network with one hidden layer, although the number of layers or neurons can be adjusted. An optional learnable feature-weighting module may precede the encoder to assign sparse, interpretable weights to genes.
-
(3)
Normalization and activation
Each linear layer is followed by layer normalization and a user-configurable activation function (default: LeakyReLU). Layer normalization operates across features within each sample, providing robustness to variation across minibatches; therefore, it is preferable to batch normalization73, although the latter is also supported.
-
(4)
Optional decoder and classifier
A decoder can be appended to the latent embeddings to reconstruct batch-corrected gene expression profiles. It can be trained jointly with the encoder or after encoder pretraining. To prevent reintroduction of batch effects into the latent space, a distinct, learnable dataset embedding is appended during decoding, preserving the batch-effect-free nature of the representation.
A classification head, implemented as a multilayer perceptron with a cross-entropy loss, can optionally be attached to the encoder for supervised tasks such as cell type annotation or doublet detection. The classifier may be trained on a pretrained encoder or jointly with it to enhance cell type separation in the latent space. While joint training improves class separation, it may impose strong priors that disrupt trajectory continuity. To mitigate overfitting, a training–validation split with early stopping is recommended during classifier training.
Contrastive objective
We adopt the noise-contrastive estimation framework with the NT-Xent loss21. Given a minibatch of B cells, two augmented views are generated for each sample, producing embeddings zk and \({z}_{{k}^{+}}\) from the encoder. The NT-Xent loss encourages the model to pull positive pairs (different views of the same sample) closer while pushing negative pairs (views from different samples) apart.
For a concatenated minibatch of 2B embeddings \(z=\left[{z}_{k};{z}_{{k}^{+}}\right]\), the loss is computed as follows:
where \(s\left({z}_{k},{z}_{{k}^{+}}\right)=\frac{{z}_{k}^{T}{z}_{{k}^{+}}}{{||}{z}_{k}{||||}{z}_{{k}^{+}}{||}}\) denotes the cosine similarity and T is a temperature hyperparameter that controls the trade-off between local separation and global uniformity of the embeddings74. The denominator sums over all other embeddings in the minibatch, approximating negatives sampled from the empirical data distribution P.
The loss is efficiently implemented using matrix operations: the logit matrix \(L=z{z}^{T}/T\) is computed, diagonal entries are set to −∞ to exclude self-similarities and the cross-entropy loss is applied with positive indices corresponding to \({z}_{{k}^{+}}\) for each zk.
Dataset and neighborhood-aware probabilistic sampler
At the core of CONCORD is a probabilistic minibatch sampler that determines how cells are grouped and contrasted during training. Unlike conventional contrastive learning frameworks that rely on uniform random sampling, CONCORD introduces a unified, generalizable sampling strategy that simultaneously (1) performs hard-negative sampling in either kNN or hcl mode and (2) restricts each minibatch primarily to cells from a single dataset. This principled design reshapes the outcome of contrastive learning, enabling the model to produce a coherent, high-resolution and batch-effect-mitigated representation of the cell-state landscape.
-
(1)
kNN mode
We begin by coarsely approximating the global data manifold using a kNN graph, where k is a user-defined parameter (typically moderately large). The graph can be initialized from normalized gene expression values, a PCA projection or a CONCORD batch-corrected embedding generated with the dataset-aware sampler. By default, we run CONCORD with the dataset-aware sampler for two epochs, followed by the remaining epochs with joint sampling. For scalability, we use the Faiss library75 for efficient neighbor retrieval in large datasets. The kNN graph then guides neighborhood-aware sampling, modulated by a user-defined neighborhood enrichment probability PkNN. To construct minibatches that are both dataset and neighborhood enriched, we partition each minibatch into four subsets—in-dataset neighbors, in-dataset global samples, out-of-dataset neighbors and out-of-dataset global samples (Extended Data Fig. 1b). A ‘core sample’ is randomly selected from one dataset to anchor both neighborhood and dataset-aware sampling. The four subsets are then sampled according to Pd (probability of sampling within the same dataset) and PkNN as follows:
-
In-dataset neighbors: PdPkNNB cells from the same dataset and within the core cell’s kNN neighborhood.
-
In-dataset global samples: \({P}_{{\rm{d}}} \left(1-{P}_{\mathrm{kNN}}\right) B\) uniformly sampled cells from the same dataset, outside the neighborhood.
-
Out-of-dataset neighbors: \((1-{P}_{{\rm{d}}}) {P}_{\mathrm{kNN}} B\) cells from other datasets that fall within the core cell’s kNN neighborhood.
-
Out-of-dataset global samples: \((1-{P}_{{\rm{d}}}) ({1-P}_{\mathrm{kNN}}){B}\) uniformly sampled cells from all other datasets.
-
(2)
hcl mode
Unlike kNN mode, which explicitly samples cells from a precomputed neighborhood graph, hcl mode reweights the contribution of negative samples directly in the contrastive loss according to their similarity to the anchor. This effectively emphasizes hard negatives—cells whose embeddings lie close to the anchor— enabling the model to better resolve subtle differences between closely related states without explicitly altering the minibatch sampling procedure.
Formally, hcl mode implements the hard-negative sampling algorithm from Robinson et al.32, using importance sampling to approximate the expected hard-negative loss directly within the contrastive objective. Given an anchor embedding zk, negative samples zm are drawn from a mixed hard-negative distribution:
where the similarity \(s\left({z}_{k},{z}_{m}\right)={z}_{k}^{T}{z}_{m}\) (with embeddings \({{\mathcal{l}}}_{2}\)-normalized) and β > 0 is a concentration parameter. The exponential term acts as a von Mises–Fisher kernel; larger β concentrates probability mass on points closer to the anchor (harder negatives), while β = 0 recovers the uniform sampler over the data distribution P.
Because sampling directly from qβ is computationally inefficient, we apply importance weights within the contrastive loss to approximate the expected contribution under qβ. Specifically, the contrastive loss under hcl mode is:
This omits the optional debiasing term from Equation 4 in Robinson et al.32, which uses the class prior τ+ to correct for false negatives. We set τ+ = 0, as the high heterogeneity of single-cell data makes sampling identical molecular states within a minibatch unlikely.
The expectation is computed using Monte Carlo importance sampling:
where
is the partition function, estimated empirically as
Let
denote the original negative logits. The reweighted logits are then
which replaces lm in the NT-Xent denominator.
To integrate the hcl hard-negative sampler with the dataset-aware sampler, we apply the hcl contrastive loss to minibatches constructed under the dataset-aware probability distribution (determined by Pd) rather than the uniform distribution P, thereby enabling simultaneous batch correction by focusing contrasts primarily within datasets. In practice, hcl is more sensitive to Pd, performing best under strict intra-dataset sampling (Pd = 1.0). This likely occurs because strong weighting of nearby neighbors can penalize correct alignments when cross-batch neighbors represent the same biological state.
Both CONCORD sampling variants are implemented using vectorized operations in PyTorch and NumPy, optimizing memory efficiency and minimizing computational overhead. This ensures scalability to large datasets and enables rapid training.
Model training
Mini-batches are constructed using the probabilistic sampler, shuffled and optimized with the NT-Xent loss using the Adam optimizer76. Interestingly and in contrast to trends commonly observed in computer vision, CONCORD’s performance did not improve with very large minibatch sizes (relative to the total number of cells). For example, in the C. elegans dataset (>90,000 cells), performance peaked at moderate sizes (256–512) and declined when the batch size exceeded 1,000 (Extended Data Fig. 4e). We hypothesize that this behavior arises because the benefits of hard-negative sampling are diluted in excessively large batches. As batch size increases, the minibatch distribution approaches the global data distribution, diminishing the effect of hard-negative sampling. Accordingly, for all benchmarking analyses, we adopted a moderate batch size of 256, which consistently achieved top performance across diverse datasets while maintaining high computational efficiency. This configuration also minimizes VRAM requirements (Extended Data Fig. 7d), allowing CONCORD to run efficiently on widely available GPUs.
In addition to the core contrastive objective, optional loss terms, including mean-squared error for reconstruction, cross-entropy loss for classification and L1 or L2 regularization for feature-weighting modules, can be incorporated with user-defined weights. A learning-rate scheduler is applied to gradually reduce the learning rate over time, promoting stable convergence.
Simulation pipeline
We developed a versatile simulation pipeline to generate synthetic single-cell gene expression data with diverse underlying structures. Unlike conventional simulators that primarily produce discrete clusters, our pipeline accommodates a broad range of topologies, including linear trajectories, branching trees, loops and intersecting paths, frequently observed in real single-cell datasets.
The pipeline proceeds in three sequential stages, as illustrated in Fig. 2a.
-
(1)
Ground-truth data model
In the first stage, the state simulator constructs a noise-free data matrix \([N\times D]\), where N is the number of cells and D is the number of genes, according to a user-defined structure:
-
Clusters: Cells form discrete groups characterized by unique gene programs, optionally including shared or ubiquitously expressed genes.
-
Trajectories: Cells exhibit gradual shifts in gene expression, emulating cell differentiation processes.
-
Loops and intersecting paths: Continuous trajectories that close into loops or intersect, representing cyclic or convergent biological processes.
-
Trees: Hierarchical, branching lineages representing progenitor-to-terminal fate differentiation, configurable by branching factor and depth.
-
(2)
Noise model
Expression values are then sampled from user-selected distributions (for example, Gaussian, Poisson, log-normal or negative binomial), introducing realistic variability and dropout patterns. Users can control parameters such as baseline expression, dispersion (noise level) and dropout probability and may optionally enforce non-negativity or integer rounding to yield a noisy data matrix \([N\times D]\).
-
(3)
Batch model
In the final stage, an optional batch simulator introduces dataset-specific technical variability to mimic batch effects. For each batch, a user-specified effect type is applied, enabling simulation of various technical artifacts. Supported effect types include the following:
-
Variance inflation: Multiplies each entry by \(1+N\left(0,{\sigma }^{2}\right)\), where σ is the dispersion parameter.
-
Batch-specific distribution: Adds noise sampled from a specified distribution (for example, normal, Poisson, negative binomial or log-normal) with configurable mean and dispersion.
-
Uniform dropout: Randomly sets a fixed fraction of values to zero.
-
Value-dependent dropout: Drops values with probability \(\exp \left(-{\rm{\lambda }} {x}^{2}\right)\), where λ is the level parameter and x is the expression value.
-
Down-sampling: Subsamples unique molecular identifier counts to a specified ratio, simulating reduced sequencing depth.
-
Scaling factor: Multiplies the entire matrix by a scalar to shift overall expression levels.
-
Batch-specific expression: Adds distribution-based noise to a random subset of genes.
-
Batch-specific features: Appends new genes unique to each batch, with expression sampled from a specified distribution.
Multiple simulated batches are then concatenated into a single dataset, with adjustable degrees of batch overlap to mimic realistic sampling scenarios, producing the final data matrix \([N\times D]\) with noise and batch effects.
By combining diverse gene expression structures with configurable noise and batch models, this simulation pipeline can approximate a broad spectrum of biological and technical scenarios. It, thus, serves as a powerful testbed for benchmarking data integration, dimensionality-reduction and trajectory-inference methods under controlled yet biologically realistic conditions.
Benchmarking pipeline
We developed a comprehensive benchmarking pipeline to evaluate the performance of CONCORD and competing dimensionality-reduction and data-integration methods. This framework integrates geometric, topological, biological label conservation and batch-correction metrics to provide a multifaceted assessment of embedding quality.
-
(1)
Topological assessments: To quantify preservation of topological structure, we performed persistent homology analysis using Giotto-TDA (version 0.5.1)77. Persistent homology captures structural features across multiple scales by constructing Vietoris–Rips complexes over increasing radii, yielding persistence diagrams and corresponding Betti curves. Persistence diagrams encode the lifespan of topological features, such as connected components (Betti-0), loops (Betti-1) and voids (Betti-2). Betti curves were derived from these diagrams and interpolated onto a common filtration grid (100 bins) to ensure comparability across methods.
For each homology dimension, we computed the mode of the Betti curve (representing the most persistent Betti number across scales) and compared it to the ground-truth topology using the L1 distance, defining the Betti number accuracy as
$$\mathrm{Accuracy}=1/\left(1+{L}_{{1}}\right).$$We also quantified Betti curve stability as
$${\rm{Stability}}=1/\left(1+{\rm{Var}}\right),$$where Var denotes the variance of Betti values across the filtration grid. Stability scores were averaged across homology dimensions to measure overall topological robustness (ranging from 0 for highly variable to 1 for perfectly stable curves). The final topology score was defined as a weighted average:
$${\mathrm{Score}}_{\mathrm{topo}}=0.8\times \mathrm{Betti}\;\mathrm{number}\;\mathrm{accuracy}+0.2\times \mathrm{Betti}\;\mathrm{curve}\;\mathrm{stability}.$$ -
(2)
Geometric assessments: To evaluate geometric fidelity, we computed Pearson correlations between pairwise distances in the latent space and those in the corresponding noise-free reference data, quantifying global structure preservation.
For local structure, we used trustworthiness78, a measure of how well neighborhood relationships are preserved after dimensionality reduction. Trustworthiness values range from 0 (poor preservation) to 1 (perfect preservation). We averaged across neighborhood sizes (k = 10–100, step 10) and plotted trustworthiness as a function of k to visualize performance across scales.
-
(3)
Batch-correction metrics: We adopted established metrics from the scIB metrics package (version 0.5.2)34 to assess batch-correction performance.
-
Graph connectivity: Evaluates whether cells with the same biological label form a connected component in the integrated kNN graph (range 0–1; higher is better).
-
Integration local inverse Simpson’s index (iLISI): Estimates the effective number of batches within local neighborhoods (range 0–1; higher indicates better mixing).
-
kNN batch-effect test (KBET): Tests whether the batch composition within a cell’s neighborhood matches the global expectation. The average rejection rate is subtracted from 1 (range 0–1; higher indicate better batch mixing).
-
PCR comparison (principal component regression): Quantifies the variance contribution of batch effects by regressing principal components on batch labels, comparing before and after integration (rescaled to 0–1).
-
Silhouette batch (batch average silhouette width (ASW)): Computes the ASW using batch labels, taking the absolute value per cell before subtracting from 1. The score is averaged within each cell type and then across types (range 0 (strong separation) to 1 (ideal integration)).
-
(4)
Biological label conservation: To assess preservation of biological variation and cell type separation, we used a series of scIB metrics.
-
Isolated labels: Assesses handling of rare or batch-specific labels using F1 score and ASW, scaled to 0–1 (higher scores indicate better separation of isolated labels).
-
Leiden ARI (adjusted Rand index): Measures agreement between true biological labels and Leiden clusters, ranging from 0 (random) to 1 (perfect match).
-
Leiden NMI (normalized mutual information): Quantifies shared information between true labels and Leiden clusters, ranging from 0 (no overlap) to 1 (perfect correspondence).
-
Silhouette label (cell type ASW): Evaluates cell type separation using average silhouette width on true labels, scaled to 0–1 (higher values indicate well-separated, cohesive cell type clusters).
-
Cell type local inverse Simpson’s index (cLISI): Estimates cell type purity in local neighborhoods, rescaled to 0–1 (higher scores indicate better separation).
Because scIB primarily assumes discrete labels, it does not fully capture hierarchical or continuous systems. For simulations involving trajectories or loops, we first applied Leiden clustering to the noise-free data to define ‘clusters’ as ground truth or used ‘branch’ labels in tree simulations. Under these conditions, scIB metrics were applied in a coarse-grained manner to provide approximate evaluations.
-
(5)
Probing classifiers: To further assess embedding quality, we implemented probing classifiers, a standard approach in evaluating representation learning methods. Two probes were implemented: a KNN probe and a linear probe. The KNN probe trains a kNN classifier on 80% of the data and evaluates on the held-out 20%. The linear probe trains a single fully connected layer on the fixed embeddings using AdamW optimization, with cross-entropy loss for classification. Training follows an 80:20 training–validation split with early stopping (default patience: five epochs) to prevent overfitting.
We applied these probes to evaluate both biological label conservation and batch mixing. For biological label conservation, probe performance was quantified using classification accuracy. For batch mixing, the classification error (1 − accuracy) was used, as higher error indicates stronger batch mixing. However, on datasets with imbalanced batch composition or coverage, high classification error can sometimes reflect overcorrection. Therefore, batch classification error was only used to assess batch mixing when scIB metrics could not be computed (for example, C. elegans and C. briggsae atlas). Label classification accuracy was included under biological label conservation metrics for all evaluations.
All datasets underwent total count normalization, log transformation and selection of highly variable features (5,000 for all Open Problems datasets; 10,000 for the C. elegans/C. briggsae datasets, intestine atlas and PBMC scATAC-seq data). The resulting matrices were used as input for all integration algorithms except Harmony, which requires PCA-projected coordinates.
CONCORD (version 1.0.8) was used for data integration, dimensionality reduction, simulation and benchmarking. Additional dimensionality-reduction analyses were performed using scikit-learn (version 1.5.1), PHATE (version 1.0.11) and ZIFA (https://github.com/epierson9/ZIFA). Comparative data-integration analyses were conducted using scVI (version 1.2.2.post2), Scanorama (version 1.7.4), Harmony-pytorch (version 0.1.8), PyLiger (version 0.2.4), Seurat (version 5.3.0) and Scanpy (version 1.10.1).
All methods were benchmarked using latent spaces of equal dimensionality: 30 for simulated datasets, 50 for most real-world datasets and 300 for complex datasets—such as the C. elegans/C. briggsae atlas and Tabula Sapiens—to capture the full diversity of cell states. To ensure fair comparison, all methods were executed on the same Amazon EC2 environment equipped with an NVIDIA Tesla T4 GPU.
For analyses and visualization, we additionally used AnnData (version 0.10.6), SciPy (version 1.15.2), FAISS (version 1.8.0), PyTorch (version 2.2.1), NumPy (version 1.26.4), UMAP-learn (version 0.5.7), pandas (version 2.2.3), seaborn (version 0.13.2), gseapy (version 1.1.4), plottable (version 0.1.5) and matplotlib (version 3.10.1).
Transcriptomic profiling of early C. elegans embryos by scRNA-seq
Wild-type Bristol N2 strain of the nematode C. elegans (hermaphrodite; source: Caenorhabditis Genetics Center, University of Minnesota) was used in this study. Worms were grown on nematode growth medium plates and synchronized by bleaching. Eggs were hatched on 10-cm plates and were grown until the L3 or L4 stage. To enrich for early embryos, plates were incubated at 12 °C for 48 h. Adult worms were lysed by bleaching and embryos were dissociated into single cells as previously described79. Cells were loaded onto a Chromium GEM-X single-cell 3′ Chip kit v4 with GEM-X Universal 3′ gene expression v4 reagents (10x Genomics, 1000686). Libraries were prepared following the 10x Genomics protocol, sequenced on NovaSeq X and processed with CellRanger (version 9.0.1) using the WBcel235 transcriptome. A total of 12,899 cells were recovered, with a median of approximately 69,000 reads per cell.
Reporting summary
Further information on research design is available in the Nature Portfolio Reporting Summary linked to this article.
Data availability
Single-cell RNA-seq data of C. elegans early embryos were deposited to the Gene Expression Omnibus (GEO) under accession number GSE305031. Public datasets analyzed in this study include the Human Lung Atlas compiled by Luecken et al.34 and obtained from the scIB metrics website (https://scib-metrics.readthedocs.io/en/stable/notebooks/lung_example.html), GTEX (version 9)80, HypoMap81, Immune Cell Atlas82, mouse pancreatic islet83, Tabula Sapiens66 sourced from the Open Problems in Single-Cell Analysis website (https://openproblems.bio/benchmarks/batch_integration?version=v2.0.0), the C. elegans embryogenesis atlas49 downloaded from the GEO under accession number GSE126954, the joint C. elegans and C. briggsae dataset48 available from the GEO under accession number GSE292756, and the mouse intestinal developmental atlas55 acquired from the GEO under accession number GSE233407.
Code availability
CONCORD is available from GitHub (https://github.com/Gartner-Lab/Concord) under the MIT License. All benchmarking codes used to generate results in this paper were also deposited to GitHub (https://github.com/Gartner-Lab/Concord_benchmark). Full documentation of CONCORD can be found online (https://qinzhu.github.io/Concord_documentation/).
References
Wagner, D. E. & Klein, A. M. Lineage tracing meets single-cell omics: opportunities and challenges. Nat. Rev. Genet. 21, 410–427 (2020).
Tanay, A. & Regev, A. Scaling single-cell genomics from phenomenology to mechanism. Nature 541, 331–338 (2017).
Flores-Bautista, E. & Thomson, M. Unraveling cell differentiation mechanisms through topological exploration of single-cell developmental trajectories. Preprint at bioRxiv https://doi.org/10.1101/2023.07.28.551057 (2023).
Weinreb, C., Rodriguez-Fraticelli, A., Camargo, F. D. & Klein, A. M. Lineage tracing on transcriptional landscapes links state to fate during differentiation. Science 367, eaaw3381 (2020).
Lee, D. D. & Seung, H. S. Learning the parts of objects by non-negative matrix factorization. Nature 401, 788–791 (1999).
Barber, D. Bayesian Reasoning and Machine Learning (Cambridge Univ. Press, 2012).
Korsunsky, I. et al. Fast, sensitive and accurate integration of single-cell data with Harmony. Nat. Methods 16, 1289–1296 (2019).
Hie, B., Bryson, B. & Berger, B. Efficient integration of heterogeneous single-cell transcriptomes using Scanorama. Nat. Biotechnol. 37, 685–691 (2019).
Stuart, T. et al. Comprehensive integration of single-cell data. Cell 177, 1888–1902 (2019).
Lopez, R., Regier, J., Cole, M. B., Jordan, M. I. & Yosef, N. Deep generative modeling for single-cell transcriptomics. Nat. Methods 15, 1053–1058 (2018).
Welch, J. D. et al. Single-cell multi-omic integration compares and contrasts features of brain cell identity. Cell 177, 1873–1887 (2019).
Haghverdi, L., Lun, A. T., Morgan, M. D. & Marioni, J. C. Batch effects in single-cell RNA-sequencing data are corrected by matching mutual nearest neighbors. Nat. Biotechnol. 36, 421–427 (2018).
Zhang, Z. et al. Recovery of biological signals lost in single-cell batch integration with CellANOVA. Nat. Biotechnol. 43, 1861–1877 (2025).
Richter, T., Bahrami, M., Xia, Y., Fischer, D. S. & Theis, F. J. Delineating the effective use of self-supervised learning in single-cell genomics. Nat. Mach. Intell. 7, 68–78 (2025).
Ciortan, M. & Defrance, M. Contrastive self-supervised clustering of scRNA-seq data. BMC Bioinformatics 22, 280 (2021).
Wang, J., Xia, J., Wang, H., Su, Y. & Zheng, C.-H. scDCCA: deep contrastive clustering for single-cell RNA-seq data based on auto-encoder network. Brief. Bioinform. 24, bbac625 (2023).
Zhao, B., Song, K., Wei, D.-Q., Xiong, Y. & Ding, J. scCobra allows contrastive cell embedding learning with domain adaptation for single cell data integration and harmonization. Commun. Biol. 8, 233 (2025).
Yang, M. et al. Contrastive learning enables rapid mapping to multimodal single-cell atlas of multimillion scale. Nat. Mach. Intell. 4, 696–709 (2022).
Heimberg, G. et al. A cell atlas foundation model for scalable search of similar human cells. Nature 638, 1085–1094 (2024).
Heryanto, Y. D., Zhang, Y.-z. & Imoto, S. Predicting cell types with supervised contrastive learning on cells and their types. Sci. Rep. 14, 430 (2024).
Chen, T., Kornblith, S., Norouzi, M. & Hinton, G. A simple framework for contrastive learning of visual representations. In Proc. 37th International Conference on Machine Learning (eds Daumé, H. & Singh, A.) (PMLR, 2020).
Gao, T., Yao, X. & Chen, D. SimCSE: Simple Contrastive Learning of Sentence Embeddings. In Proc. 2021 Conference on Empirical Methods in Natural Language Processing (eds Moens, M.-F. et al.) (Association for Computational Linguistics, 2021).
He, K., Fan, H., Wu, Y., Xie, S. & Girshick, R. Momentum contrast for unsupervised visual representation learning. In Proc. IEEE/CVF Conference on Computer Vision and Pattern Recognition (ed. O’Conner, L.) (IEEE, 2020).
Wen, Z. & Li, Y. Toward understanding the feature learning process of self-supervised contrastive learning. In Proc. 38th International Conference on Machine Learning (eds Meila, M. & Zhang, T.) (PMLR, 2021).
Alaqeeli, O. A comparison of dropout rate of three commonly used single cell RNA-sequencing protocols. Biotechnol. Biotechnol. Equip. 38, 2379837 (2024).
Goodfellow, I. et al. Generative adversarial networks. Commun. ACM 63, 139–144 (2020).
Lotfollahi, M., Wolf, F. A. & Theis, F. J. scGen predicts single-cell perturbation responses. Nat. Methods 16, 715–721 (2019).
Ganin, Y. & Lempitsky, V. Unsupervised domain adaptation by backpropagation. In Proc. 32nd International Conference on Machine Learning (eds Bach, F. & Blei, D.) (PMLR, 2015).
Hrovatin, K. et al. Integrating single-cell RNA-seq datasets with substantial batch effects. BMC Genomics 26, 974 (2025).
Heimberg, G., Bhatnagar, R., El-Samad, H. & Thomson, M. Low dimensionality in gene expression data enables the accurate extraction of transcriptional programs from shallow sequencing. Cell Syst. 2, 239–250 (2016).
Riba, A. et al. Cell cycle gene regulation dynamics revealed by RNA velocity and deep-learning. Nat. Commun. 13, 2865 (2022).
Robinson, J., Chuang, C.-Y., Sra, S. & Jegelka, S. Contrastive learning with hard negative samples. In Proc. International Conference on Learning Representations (ICLR, 2021).
Yang, Z. et al. Batchsampler: sampling mini-batches for contrastive learning in vision, language and graphs. In Proc. 29th ACM SIGKDD Conference on Knowledge Discovery and Data Mining (eds Singh, A. & Sun, Y.) (ACM, 2023).
Luecken, M. D. et al. Benchmarking atlas-level data integration in single-cell genomics. Nat. Methods 19, 41–50 (2022).
Wang, H., Leskovec, J. & Regev, A. Limitations of cell embedding metrics assessed using drifting islands. Nat. Biotechnol. https://doi.org/10.1038/s41587-025-02702-z (2025).
Rautenstrauch, P. & Ohler, U. Shortcomings of silhouette in single-cell integration benchmarking. Nat. Biotechnol. https://doi.org/10.1038/s41587-025-02743-4 (2025).
Belinkov, Y. Probing classifiers: promises, shortcomings, and advances. Computat. Linguist. 48, 207–219 (2022).
Marks, M. et al. A closer look at benchmarking self-supervised pre-training with image classification. Int. J. Comput. Vis. 133, 5013–5025 (2025).
Coifman, R. R. & Lafon, S. Diffusion maps. Appl. Comput. Harmon. Anal. 21, 5–30 (2006).
Hyvarinen, A. Fast and robust fixed-point algorithms for independent component analysis. IEEE Trans. Neural Netw. 10, 626–634 (1999).
Blei, D. M., Ng, A. Y. & Jordan, M. I. Latent Dirichlet allocation. J. Mach. Learn. Res. 3, 993–1022 (2003).
Pierson, E. & Yau, C. ZIFA: dimensionality reduction for zero-inflated single-cell gene expression analysis. Genome Biol. 16, 241 (2015).
Moon, K. R. et al. Visualizing structure and transitions in high-dimensional biological data. Nat. Biotechnol. 37, 1482–1492 (2019).
van der Maaten, L. & Hinton, G. Visualizing data using t-SNE. J. Mach. Learn. Res. 9, 2579–2605 (2008).
Tenenbaum, J. B., Silva, V. D. & Langford, J. C. A global geometric framework for nonlinear dimensionality reduction. Science 290, 2319–2323 (2000).
Becht, E. et al. Dimensionality reduction for visualizing single-cell data using UMAP. Nat. Biotechnol. 37, 38–44 (2019).
Sulston, J. E., Schierenberg, E., White, J. G. & Thomson, J. N. The embryonic cell lineage of the nematode Caenorhabditis elegans. Dev. Biol. 100, 64–119 (1983).
Large, C. R. et al. Lineage-resolved analysis of embryonic gene expression evolution in C. elegans and C. briggsae. Science 388, eadu8249 (2025).
Packer, J. S. et al. A lineage-resolved molecular atlas of C. elegans embryogenesis at single-cell resolution. Science 365, eaax1971 (2019).
Ortiz, C. O. et al. Searching for neuronal left/right asymmetry: genomewide analysis of nematode receptor-type guanylyl cyclases. Genetics 173, 131–149 (2006).
Yu, S., Avery, L., Baude, E. & Garbers, D. L. Guanylyl cyclase expression in specific sensory neurons: a new family of chemosensory receptors. Proc. Natl Acad. Sci. USA 94, 3384–3387 (1997).
Saelens, W., Cannoodt, R., Todorov, H. & Saeys, Y. A comparison of single-cell trajectory inference methods. Nat. Biotechnol. 37, 547–554 (2019).
Kuang, D., Qiu, G. & Kim, J. Reconstructing cell lineage trees from phenotypic features with metric learning. In Proc. 42nd International Conference on Machine Learning (ICML, 2025).
Koreth, J. & van den Heuvel, S. Cell-cycle control in Caenorhabditis elegans: how the worm moves from G1 to S. Oncogene 24, 2756–2764 (2005).
Huycke, T. R. et al. Patterning and folding of intestinal villi by active mesenchymal dewetting. Cell 187, 3072–3089 (2024).
Zwick, R. K. et al. Epithelial zonation along the mouse and human small intestine defines five discrete metabolic domains. Nat. Cell Biol. 26, 250–262 (2024).
Morarach, K. et al. Diversification of molecularly defined myenteric neuron classes revealed by single-cell RNA sequencing. Nat. Neurosci. 24, 34–46 (2021).
Derecka, M. et al. EBF1-deficient bone marrow stroma elicits persistent changes in HSC potential. Nat. Immunol. 21, 261–273 (2020).
Chen, C.-P., Wang, L.-K., Chen, C.-Y., Chen, C.-Y. & Wu, Y.-H. Placental multipotent mesenchymal stromal cell-derived Slit2 may regulate macrophage motility during placental infection. Mol. Hum. Reprod. 27, gaaa076 (2021).
Al-Shboul, O. A. The importance of interstitial cells of cajal in the gastrointestinal tract. Saudi J. Gastroenterol. 19, 3–15 (2013).
Ancona, M., Ceolini, E., Öztireli, C. & Gross, M. in Explainable AI: Interpreting, Explaining and Visualizing Deep Learning (eds Samek, W. et al.) (Springer, 2019).
De Rop, F. V. et al. Systematic benchmarking of single-cell ATAC-sequencing protocols. Nat. Biotechnol. 42, 916–926 (2024).
Janesick, A. et al. High resolution mapping of the tumor microenvironment using integrated single-cell, spatial and in situ analysis. Nat. Commun. 14, 8353 (2023).
Petukhov, V. et al. Cell segmentation in imaging-based spatial transcriptomics. Nat. Biotechnol. 40, 345–354 (2022).
Luecken, M. D. et al. Defining and benchmarking open problems in single-cell analysis. Nat. Biotechnol. 43, 1035–1040 (2025).
The Tabula Sapiens Consortium The Tabula Sapiens: a multiple-organ, single-cell transcriptomic atlas of humans. Science 376, eabl4896 (2022).
Smirnov, E. et al. Face representation learning using composite mini-batches. In Proc. IEEE/CVF International Conference on Computer Vision Workshops (ed. O’Conner, L.) (IEEE, 2019).
Joseph, K. J., R., V. T., Singh, K. & Balasubramanian, V. N. Submodular batch selection for training deep neural networks. In Proc. 28th International Joint Conference on Artificial Intelligence (AAAI Press, 2019).
Jiang, J. et al. D-SPIN constructs gene regulatory network models from multiplexed scRNA-seq data revealing organizing principles of cellular perturbation response. Preprint at bioRxiv https://doi.org/10.1101/2023.04.19.537364 (2024).
Kotliar, D. et al. Identifying gene expression programs of cell-type identity and cellular activity with single-cell RNA-seq. eLife 8, e43803 (2019).
Kunes, R. Z., Walle, T., Land, M., Nawy, T. & Pe’er, D. Supervised discovery of interpretable gene programs from single-cell data. Nat. Biotechnol. 42, 1084–1095 (2024).
Vaswani, A. et al. Attention is all you need. In Proc. 31st International Conference on Neural Information Processing Systems (eds von Luxburg, U. et al.) (ACM, 2017).
Lei Ba, J., Kiros, J. R. & Hinton, G. E. Layer normalization. Preprint at https://doi.org/10.48550/arxiv.1607.06450 (2016).
Wang, F. & Liu, H. Understanding the behaviour of contrastive loss. In Proc. IEEE/CVF Conference on Computer Vision and Pattern Recognition (ed. O’Conner, L.) (IEEE, 2021).
Douze, M. et al. The Faiss library. IEEE Trans. Big Data https://doi.org/10.1109/TBDATA.2025.3618474 (2025).
Kingma, D. P. & Ba, J. Adam: a method for stochastic optimization. In Proc. International Conference on Learning Representations (ICLR, 2015).
Tauzin, G. et al. giotto-tda: a topological data analysis toolkit for machine learning and data exploration. J. Mach. Learn. Res. 22, 1–6 (2021).
Venna, J. & Kaski, S. Neighborhood preservation in nonlinear projection methods: an experimental study. In Proc. International Conference on Artificial Neural Networks (eds Dorffner, G. et al.) (Springer, 2001).
Williams, R. T., Nishimura, E. O., Zuckerman, B. & Weinberger, L. S. Embryo stage C. elegans dissociation for FACS isolation and RNA-seq analysis. protocols.io https://doi.org/10.17504/protocols.io.kxygx3d4wg8j/v1 (2025).
Eraslan, G. et al. Single-nucleus cross-tissue molecular reference maps toward understanding disease gene function. Science 376, eabl4290 (2022).
Steuernagel, L. et al. HypoMap—a unified single-cell gene expression atlas of the murine hypothalamus. Nat. Metab. 4, 1402–1419 (2022).
Domínguez Conde, C. et al. Cross-tissue immune cell analysis reveals tissue-specific features in humans. Science 376, eabl5197 (2022).
Hrovatin, K. et al. Delineating mouse β-cell identity during lifetime and in diabetes with a single cell atlas. Nat. Metab. 5, 1615–1637 (2023).
Acknowledgements
We thank the reviewers for their constructive feedback, which was instrumental in driving major enhancements to CONCORD and strengthening the paper. We thank J. Kim, J. Murray and H. Kim for valuable feedback on the paper. We also thank the authors of Large et al.48 for sharing the C. elegans and C. briggsae dataset, with special acknowledgement to C. R. L. Large for facilitating data access. We are grateful to authors of De Rop et al.62 for providing key metadata for the benchmarking analysis. Additionally, we thank members of the Z.J.G. Lab for critical discussions, support and assistance in testing early versions of CONCORD. We used large language models (ChatGPT, Grok and Gemini) to assist in code annotation and refinement. This work was supported by grants from the National Institutes of Health (NIH; R01DK126376, R33CA247744 and U01CA199315 to Z.J.G.; R37AI109593 to L.W.), the Chan Zuckerberg Initiative (to Z.J.G. and M.T.) and the University of California, San Francisco (UCSF) Center for Cellular Construction, a National Science Foundation Science and Technology Center (DBI-1548297 to Z.J.G.). Q.Z. is supported by a Cancer Research Institute Immuno-Informatics Postdoctoral Fellowship (CRI5054). Z.J.G. is a Chan Zuckerberg BioHub San Francisco Investigator. Sequencing was performed at the UCSF Center for Advanced Technology, supported by UCSF Program in Breakthrough Biomedical Research, UCSF Institutional Matching Instrumentation Award and NIH 1S10OD028511-01 grant.
Author information
Authors and Affiliations
Contributions
Q.Z. and Z.J.G. conceptualized the project. Q.Z. designed and implemented the method. Q.Z. and Z.J. conducted the benchmarking analyses. B.Z. collected the new C. elegans dataset under the supervision of L.W. and Z.J.G. M.T. provided critical feedback and methods for TDA. Z.J.G. supervised the project. Q.Z. and Z.J.G. wrote the paper. All authors reviewed and edited the paper.
Corresponding authors
Ethics declarations
Competing interests
Z.J.G. is an author on patents associated with sample multiplexing and Z.J.G. is an equity holder and advisor to Provenance Bio. The other authors declare no competing interests.
Peer review
Peer review information
Nature Biotechnology thanks Allon Klein, Nancy Zhang and the other, anonymous, reviewer(s) for their contribution to the peer review of this work.
Additional information
Publisher’s note Springer Nature remains neutral with regard to jurisdictional claims in published maps and institutional affiliations.
Extended data
Extended Data Fig. 1 The CONCORD framework.
a, Schematic of the CONCORD mini-batch sampling framework. A dataset-aware sampler enriches each mini-batch with cells from a single dataset and is combined with a hard-negative sampler to support both data integration and enhanced resolution. Two hard-negative variants can be paired with the dataset-aware sampler: the kNN mode, which performs explicit local and global sampling based on a kNN graph of cells; and the hcl mode, which computes the expected hard-negative loss directly within the contrastive objective (see Methods). b, Joint probabilistic sampler (kNN mode). A probabilistic mini-batch sampler is constructed in which the likelihood of selecting a cell reflects the combined probabilities of dataset-aware (Pd) and neighborhood-aware sampling (PkNN). c, During training, each cell is augmented twice through random feature-wise and element-wise masking, and the contrastive loss is computed on latent encodings of mini-batches drawn by the joint probabilistic sampler. The model architecture used in this study is a minimalist neural network with a single hidden layer, though the framework supports more complex designs. Optional modules include a decoder with a learnable dataset embedding for batch-free gene-expression reconstruction, and a classifier for cell-type classification or annotation-guided representation learning.
Extended Data Fig. 2 Benchmarking CONCORD and other dimensionality reduction methods across diverse structures.
a, Heatmaps of simulated expression for the three-cluster structure and the corresponding CONCORD latent encoding in hcl or kNN modes. b, Heatmaps of simulated expression for the trajectory-loop structure and the corresponding CONCORD latent encoding in hcl or kNN modes. c, Trustworthiness measured across neighborhood sizes (k) in the three-cluster simulation. In the noise-free reference, within-cluster neighbors are assigned at random, so trustworthiness is < 1. CONCORD (h, k) denotes the hcl and kNN modes, respectively. d, Trustworthiness measured across neighborhood sizes in the complex trajectory-loop simulation. e, Heatmaps of simulated expression for the complex-tree structure shown in Fig. 2g, alongside the corresponding CONCORD latent encodings under a moderate degree of hard-negative enrichment in hcl and kNN modes. f, kNN-graph visualizations of latent spaces from the complex tree simulation, generated using naïve contrastive learning and the hcl and kNN modes of CONCORD with varying degrees of hard-negative enrichment. Zoomed-in views highlight improved resolution of a representative branch achieved through hard-negative sampling. g, Trustworthiness across neighborhood sizes for hcl and kNN modes in the complex-tree simulation, evaluated under varying degrees of hard-negative sampling. An inset for k < 20 highlights improved local neighborhood preservation with hard-negative sampling.
Extended Data Fig. 3 Benchmarking CONCORD and other data-integration methods across diverse structures.
a, Two-batch, five-cluster simulations with increasing batch-size imbalance and complete overlap of cell states. Heatmaps of the input data (dimensions indicated) and UMAPs of the ground truth and each method’s latent space are shown, with cells colored by batch. b, Cluster simulations with increased batch number and imbalance, with partial overlap of cell states across batches. Heatmaps of the input data and UMAPs of the ground truth and each method’s latent space are shown, with cells colored by batch. LIGER failed on the third simulation due to violated model assumptions. c, Loop simulations with varying degrees of state overlap between batches. kNN graphs (k = 15; edges omitted) colored by batch are shown for the ground truth and each method. d, Tree simulations with varying degrees of state overlap between batches. kNN graphs (k = 30; edges omitted) colored by batch are shown for the ground truth and each method.
Extended Data Fig. 4 Performance of CONCORD on C. elegans atlas.
a, UMAPs of the C. elegans atlas from Packer et al.49 generated from the CONCORD latent space. Gaps among early-stage cells are apparent; adding our newly collected C. elegans dataset enriched for early embryos fills these gaps, yielding continuous trajectories. The combined UMAP is colored by inferred embryo time and batch. b, Overlap between expert-curated cell-type and lineage annotations. A histogram shows that lineage annotations are concentrated in early-stage cells, whereas cell-type annotations are predominantly in late-stage cells. c, Integration performance of CONCORD and other methods, evaluated separately for early-stage cells with lineage annotations and late-stage cells with cell-type annotations. See Methods for metric definitions. d, Performance of the two CONCORD modes (hcl and kNN) across combinations of element- and feature-masking ratios, assessed by average classification accuracy using linear and kNN probes. e, Performance of both modes across key hyperparameters, quantified by the average of label-classification accuracy and batch-classification error. Each run varies one hyperparameter while fixing the rest (default value indicated on plot). Scores from other methods are included for comparison. f, UMAPs illustrating results with the dataset-aware sampler alone (no hard negatives) and with moderate versus excessive hard-negative sampling for hcl and kNN modes. Moderate local sampling improves cell-type and lineage resolution, whereas excessive local sampling without balanced global sampling disrupts global structure.
Extended Data Fig. 5 CONCORD analysis of C. elegans/C.briggsae embryogenesis atlas.
a, 2D and 3D UMAPs of the CONCORD latent space (kNN mode), colored by cell type and inferred embryo time. b, C. elegans lineage tree and its projection onto the CONCORD (hcl) embedding. Lineage annotations from Large et al. were mapped to the C. elegans lineage tree (with some ambiguous mappings due to symmetry). Each lineage is represented by its cluster medoid on the UMAP; lines connect each parent lineage to its daughters following the lineage tree. Subtrees for major lineage groups are shown separately. c, Label refinement in the CONCORD latent space via kNN majority vote. For each cell, we examine its k = 30 nearest neighbors; if ≥50% of neighbors carry expert-curated lineage/cell-type labels, we assign the neighborhood’s majority label to unlabeled cells (and relabel when the majority disagrees). We iterate this procedure twice so newly assigned labels can vote. This recovers labels for many unlabeled cells and flags likely mis-annotations.
Extended Data Fig. 6 Benchmarking CONCORD on mammalian intestine development.
a, UMAP embeddings derived from the latent spaces of CONCORD and other integration methods for the mouse intestinal developmental atlas55, colored by broad cell type, batch, cell-cycle phase, developmental stage, and zonation. b, For epithelial and smooth-muscle cells, loop-like trajectories were identified and pseudotime was assigned along each circular path. Heatmaps show top differentially expressed genes (DEGs) along each loop, as well as DEGs distinguishing the two zonation-specific epithelial loops. Persistence diagrams derived from each method’s latent representations are shown for both cell types. c, Expression patterns of the top-ranked genes contributing to Neuron 46 activation in the ENS context (top) and epithelial context (bottom), as determined by gradient-based attribution. Expression values were capped at the 99th percentile for visualization.
Extended Data Fig. 7 Performance of CONCORD across modalities and scales.
a, UMAPs of PBMC scATAC-seq data before and after integration by CONCORD and other methods, colored by original cell-type annotations and by batch. b, Full benchmarking statistics for the PBMC scATAC-seq dataset. c, UMAPs of breast cancer tumor microenvironment data generated from the latent spaces of CONCORD and other integration methods, colored by cell type and technology/batch. d, RAM and VRAM usage of different integration methods. For all methods except Seurat, we report ΔRAM (end–start RSS) because Python does not support resetting peak RSS mid-process. For Seurat, peak RAM was measured using the peakRAM R package (version 1.0.2). VRAM usage is shown only for GPU-enabled methods. Missing values indicate methods that failed due to excessive resource demands or violated model assumptions.
Extended Data Fig. 8 Performance of CONCORD on public human and mouse scRNA-seq datasets.
UMAP embeddings derived from each method’s latent space are shown for all datasets and colored by batch and cell type. a, Lung atlas spanning multiple spatial regions, donors, and two scRNA-seq protocols34. b, GTEX v9: human single-nucleus RNA-seq data from eight tissue types across 16 individuals80. c, HypoMap: single-cell atlas of the murine hypothalamus ( ~ 380k cells) across four assays81. d, Immune cell atlas: human immune cells from 16 tissues and 12 donors82. e, Mouse pancreatic islet: scRNA-seq atlas comprising 56 samples across sex, age, and diabetes models83. f, Tabula Sapiens: human cell atlas of over 1.1 M cells from 28 organs of 24 normal human donors66. Missing plots indicate runs that failed due to excessive resource demands or violated model assumptions.
Supplementary information
Supplementary Information
Supplementary Tables 1 and 2.
Rights and permissions
Open Access This article is licensed under a Creative Commons Attribution 4.0 International License, which permits use, sharing, adaptation, distribution and reproduction in any medium or format, as long as you give appropriate credit to the original author(s) and the source, provide a link to the Creative Commons licence, and indicate if changes were made. The images or other third party material in this article are included in the article’s Creative Commons licence, unless indicated otherwise in a credit line to the material. If material is not included in the article’s Creative Commons licence and your intended use is not permitted by statutory regulation or exceeds the permitted use, you will need to obtain permission directly from the copyright holder. To view a copy of this licence, visit http://creativecommons.org/licenses/by/4.0/.
About this article

Cite this article
Zhu, Q., Jiang, Z., Zuckerman, B. et al. Revealing a coherent cell-state landscape across single-cell datasets with CONCORD. Nat Biotechnol (2026). https://doi.org/10.1038/s41587-025-02950-z
Received:
Accepted:
Published:
Version of record:
DOI: https://doi.org/10.1038/s41587-025-02950-z
