
Abstract
The scientific understanding of the complex dynamics of global history – from the rise and spread of states to their declines and falls, from their peaceful interactions with economic or diplomatic exchanges to violent confrontations – requires, at its core, a consistent and explicit encoding of historical political entities, their locations, extents and durations. Numerous attempts have been made to produce digital geographical compendia of polities with different time depths and resolutions. Most have been limited in scope and many of the more comprehensive geospatial datasets must either be licensed or are stored in proprietary formats, making access for scholarly analysis difficult. To address these issues we have developed Cliopatria, a comprehensive open-source geospatial dataset of worldwide states from 3400BCE to 2024CE. Presently it comprises over 1600 political entities sampled at varying timesteps and spatial scales. Here, we discuss its construction, its scope, and its current limitations.
Background & Summary
With the advent of extensive on-line databases1,2,3 of curated historical information about productivity, population, trade, warfare, technology, etc., the scientific understanding of world-wide historical dynamics of states has made significant progress. For example, recent work has identified important causal regularities in the rise, spread, and fall of complex societies utilizing spatially-explicit models and exploring empirical evidence that incorporated geospatial and temporal information4,5,6,7. More traditional historical investigations have also engaged geospatial information, often concentrating on highly localized maps of particular cultures, or regional maps to highlight the spread of languages8 or growth in inter-regional exchange9,10. Similar efforts in economic history have utilized geo-spatial boundaries to explore the historical rise and spread of critical productive technologies and institutional packages argued as fundamental in the development of economic growth11,12. In lieu of good historical boundary data, however, these later efforts often use contemporary geo-spatial borders, which can mask important political developments in the past and can lead to measurement errors.
As these examples suggest, a wide range of studies across numerous disciplines depend upon and would benefit from a more comprehensive digital encoding of world-wide historical political geographies in time. Facilitating comparative analysis across social, spatial, and temporal bounds, including developing correspondences between different disparate geographical datasets, requires that the underlying geo-referenced data be represented as points, lines, and polygons in industry-standard digital encodings, such as shape or GeoJSON files.
Various attempts to construct such digital datasets have focused on a particular period or region of the world, digitizing maps at differing resolutions and sampling intervals13,14,15,16. However, these datasets are not comprehensive, even taken together17. Other efforts have sought to compile point-based data, which tend to be somewhat broader in scope but represent only one particular type of spatial information18,19,20,21. Yet other efforts22 catalog geo-referenced images of historical maps for visual inspection and summary but that limit automated computation of, for example, relative changes in political areas.
Several efforts, such as GeaCron23 or Running Reality24, have created more comprehensive world-wide digital representations of political entities over time. However, at present, their underlying data are not easily available to scholars. As of this writing they either require a license23,25,26, or they are encoded in a proprietary database scheme with limited options for exporting the data in other formats more amendable to computational analysis19. Further, to our knowledge, the references used in their construction are not available.
Here we describe Cliopatria, a comprehensive open-source geospatial digital dataset of worldwide polities — namely political units independent of higher authority which can range from city-states to empires, centralized or not1 — from 3400BCE to 2024CE. We describe the construction and contents of the initial version of the database, describe its validation, discuss how it compares to other digital databases, and note limitations and important considerations in its use. Subsequent versions of Cliopatria, which address these limitations (and any inaccuracies), will follow the established review procedures of the Seshat: Global Historical Databank project1.
Methods
We initially created Cliopatria from a set of composite digital illustrations (map images) originally developed by one of us (AT) in 201427. An extensive record was maintained of the documents used in the image set’s construction; these references, organized by modern state region, are listed in Table 1. The final image set consisted of 508 individual images, each associated with a specific year. An example map image, with its associated legend, is shown in Fig. 1. The complete map image set is available as part of the Cliopatria repository28.

Example image for 1727CE. A partial legend of polities and their associated color is visible in the upper left corner. Modern interior land boundaries are shown in blue. Colored historical political regions are not aligned with those boundaries.
To create these images the political boundaries for a given year found in the original source maps, typically in bound volumes, were redrawn by hand, as accurately as possible, onto a common, digital base map used by all images. Beginning with the Sumerian city states in 3400BCE, subsequent images were copied from the immediately preceding image and modified by hand to reflect documented incremental changes, additions, and deletions of polities in different geographical regions during a subsequent year as the literature suggested. Although various general world atlases29,30,31,32 suggested where political change occurred, more specialized regional sources (cited in Table 1) were consulted to confirm or resolve the detailed changes and to identify plausible and mutually consistent borders of abutting polities. Polities were included in an image when one or more written sources attested to its existence and provided an indication of its location and extent in particular years. As a consequence certain potential pre-historical polities (e.g., the ‘Xia Dynasty’ prior to 1600BCE) are not included. With rare exceptions (e.g., the Vatican, Singapore, various island states) polities occupy at least 5000 km2 and have a duration of at least 50 years.
The image set began in 3400BCE and ended in 2014CE but we extended the dataset to 2024CE. The images depict the intervening years irregularly depending on the information in the original sources and the number of events and major border changes that occurred in the year. Figure 2 shows the time difference (in years) between each image. Initially the images change information every few hundred years but the pace of change accelerates, sometimes changing on a yearly basis. Figure 2 thus provides a qualitative picture of periods of relatively stability of political boundaries compared with those with more frequent changes.

Original image sampling intervals. The time difference, in years, between images. Century moving average depicted in red. Note log scale.
Most boundaries not associated with explicit treaties (e.g., the Peace of Westphalia in 1648) are necessarily approximate and subject to differing interpretations, even between text sources and digital repositories. In sparsely populated areas (e.g., nomadic confederations), boundaries were drawn conservatively in an attempt to reflect actual settlement patterns outlined in the sources. Further, political boundaries can change within a polity’s lifetime, typically as the result of documented occupation or treaties, and these are reflected in changes in images in the appropriate year (e.g., the widely-attested expansion of the Roman Republic under Julius Caesar into Hispania and Transalpine Gaul circa 50BCE is documented in images for this and preceding years29). The dataset does not currently encode possible border uncertainty and territorial disputes; this is discussed below.
To create the initial GIS dataset from these images, we developed Python code that converted the hand-colored regions on the images into polygons associated with the names in the accompanying legend. Then, with the generous assistance of researchers at the Seshat Databank project1, we extensively reviewed and hand-edited both the names and polygons and their associations to other datasets, notably Seshat, to form the Cliopatria database.
The original images have several unique advantages permitting the automated conversion to labelled polygons. First, each image uses an identical background image of the world. Land is marked in a grey; ocean and lakes in a light blue. The background map indicates coastal boundaries in black and modern internal land borders in blue and some currently disputed borders in red. The separately colored areas of historical polities, however, are not aligned with these modern interior boundaries. The map uses a (somewhat distorted but corrected) spherical Robinson projection (ESRI:53030), which permitted recovery of the approximate latitude and longitude of each image pixel. The dimensions of the image (2400 × 4800 pixels) provide a resolution of approximately 40 km2 at the equator.
Second, all text is restricted to the legend region in the upper left corner of the image and is not embedded in the world map itself. As a rule, the introduction of a new entity is announced in the legend, associated with a small rectangle of its color.
The uniformity of the background image permitted automated expansion of the entity color into adjacent inner border pixels. Initial polygons of uniform colors not associated with the background map were retrieved from the modified raster image. Certain small artifacts (of different colors) resulting from the original illustration process were identified and either associated with a related color (and hence entity) or were removed from the image.
Although the initial automated production of polygons from raster images yielded serviceable results, the distortions of the background image and the relatively coarse resolution provided by the images sometimes yielded polygons that are not always aligned with coastal and land region datasets. Further, to eliminate border artifacts from the raster-based images we automatically smoothed the resulting polygons and their shared borders to a 0.07° resolution. Subsequent releases will improve these alignment and resolution issues.
To associate an initial set of entity names with their accompanying colored polygon, we parsed the legend region using optical-character recognition (OCR) using the Tesseract library33, retrieving the text associated with each colored rectangle. The OCR process was largely successful but required detailed review and hand-editing to correct parsing artifacts (as when letters were distorted if they overlapped map boundaries) or when special characters were required. The legend area itself is constrained and did not always permit the listing of all the name or color changes in an image. Thus, the initial OCR legend data structure was subsequently edited by hand to add missing polities or disambiguate the names of polities in different regions.
The legend organized the world (and the polities) into four broad regions: Western Eurasia, Eastern Eurasia, Africa, and North/South America. While the location and extent of the latter two regions was clear, there was no clear boundary between Western and Eastern Eurasia. This led to some initial automated mis-assignment of names to polygons largely in Eastern Europe and in the Transcaucasian region. These were reviewed and corrected by hand.
Each polity was assigned one of 1194 unique colors, with images infrequently reusing the same color for different polities that existed at the same time in different regions of the world or at different times. Because colors were reused at different times and different regions of the world, it was possible for the initial automated process to mislabel polygons. For example, both the Chinese Jin and the Near-Eastern Neo-Assyrian polygons share the same color in the 750BCE image. However, the Neo-Assyrian polygons are partially in the Eastern Eurasia region, which led to automatically (mis)labeling these polygons as ‘Jin’ (or vice versa). To identify these issues we projected each Eurasian polity’s polygons individually (‘by name’) inspecting whether their extent over all their image years was consistent with the historical record; in the example above we would have found that the ‘Jin’ had an erroneous Near-Eastern presence, which was then corrected.
Certain polity names are reused in history at different times, e.g., ‘Jin’ refers to several Chinese states and dynasties over several millennia. Where possible we used known historical names utilized by experts in the relevant historical field to distinguish the different polities (e.g., ‘Western Jin’ from ‘Former Jin’).
In addition to polities the original images captured the occupation of territories by various leaders (e.g., Julius Caesar, Tokugawa Ieyasu), armies (e.g., the New Model Army, the Red Army), groups (e.g., the English Royalists and Parliamentarians) and the location of certain events (e.g., the Taiping Rebellion, the Sepoy Rebellion). We were often able to associate these entities with a particular polity (e.g., associating Harald Fairhair as the leader of the Old Kingdom of Norway from 866CE to 870CE). If this was the case we included the territory as part of the associated polity, otherwise it was not included in the current release of Cliopatria, pending further review.
Figure 3 shows the number of polities recorded per image. Substantial changes in the number of polities over a short period of time reflects both sampling choices and the dynamics of empires absorbing and then releasing independent polities over their lifetimes.

Number of entities depicted in each dataset year. Data reflects both the overall historical increase in number of polities but also a varying sampling choice about the scale of polities to be included. A substantial drop in polities typically reflects the expansion and occupation of states by a larger empire; a jump in polities reflects the creation or independence of states after the collapse of an empire. Notable examples of these dynamics are included (red lettering and arrows).
For the initial release we have confined the database to the years recorded in the original image set and have largely respected the original choice of spatial and temporal resolution of political entities, which varies by region and the availability of original maps. Upon review, we improved the names of political entities and we sought to improve the representation of entities of certain areas, notably the Indian subcontinent. These improvements were based on expert historical knowledge provided by Seshat researchers. Subsequent releases will relax these constraints as additional suggestions, reviews, and investigations reflect, in accordance with standard Seshat review procedures1, modifications that increase historical accuracy and capture disputes and uncertainty.
Data Records
The Cliopatria dataset is publicly available in a Zenodo repository28.
Cliopatria is distributed as a single data file, ‘cliopatria.geojson’. This file currently consists of approximately 15 K records structured as shown in Table 2. Data for each entity (e.g., ‘Roman Empire’) is contained in one or more rows, depending on how the associated data about the entity changes. Each row reports the Name of the entity, its polygons (geometry, projection EPSG:4326), and that geometry’s Area (in km2 using equal-area projection EPSG:6933).
Each row indicates a range of years between FromYear to ToYear to which the associated row data applies. Years are recorded as integers, negative for BCE, positive for CE. Data, including polygons, for any entity for any year (not just original image years) between 3400BCE and 2024CE can be obtained finding the row (if any) containing the Name of the entity where the year of interest is between the row’s FromYear and ToYear, inclusive.
Each row also records an associated Wikipedia page (phrase) describing the entity in those years; the latter URL can be composed by embedding the phrase in “http://en.wikipedia.org/<phrase>”. For certain polities in particular years, an associated Seshat polity id (SeshatID) may be provided; access to the structured data about that polity can be found via the URL “http://seshat-db.org/core/polity/<polity_id>”.
In addition to associating an entity with a Seshat polity, some polities were parts of a larger political entity (e.g., the British Raj in India from 1859CE to 1947CE was part of the British Empire); thus polities can also have an associated (supra-) polity. Information about these associated entities are used to form composite polities, which are denoted in the database by enclosing their name in parentheses, e.g., “(Roman Empire)”. In addition, Seshat records some intra-polity relations, such as personal unions and political allegiances, which are also represented in the database as composites. Each entity, for a range of years, will list the composite entries it contributes to, if any, under the MemberOf column; each composite entity will list the member entities that contribute to it under Components. Polygons in geometry for composite entities duplicate those of its members. Examples of associated polity information and some resulting composites are shown in Table 2.
As noted, rows for an entity are added whenever any associated data for the entity changes; typically this happens because the spatial extent of the entity changes over time. There are, however, occasions when a (typically small) polity (e.g., the County of Navarre) is temporarily incorporated into a larger polity (e.g., the Kingdom of France) only for that larger polity to then shrink or collapse and expose the original polity once again. Thus there may be multiple rows for an entity with substantial gaps between the years recorded.
Technical Validation
We validated the database largely by visual inspection and comparison against both the original and additional map images. We reviewed the image start and stop years for different entities with the original sources and with other databases, notably Seshat1. We also prepared various statistical summaries of the Cliopatria dataset to compare against previous such computations.
For example, in 1978 Taagepera34 prepared several extensive tables and figures based on his hand measurements of polity area from physical maps. We prepared equivalent tables and figures from our dataset; see Fig. 4, Tables 3–5. Our results are similar to Taagepera’s except that our database lists more steppe nomadic empires and those tend to replace his candidates for the largest empires during the Medieval period.

Size of polities versus time. The lower curve represents the area of the single largest polity. The upper curve is the sum of the areas of the three largest polities. Compare data to Taagepera34 Figs. 1 and 2. There is no essential difference. Maximum land area of the Earth is 133 M km2, excluding Antarctica; note log scale.
Bennett7 observed that the dramatic increase of polity size after 500BCE (also identified by Taagepera34) was not associated with an increase in polity duration. This pattern is confirmed by our more extensive database. Figure 5 shows the size and duration distribution of nearly 700 large-scale, long-duration polities over the 5400 years between 3400BCE and 2024CE. The very large polities exceeding 20 M km2 that arose after 1500CE (e.g., the British Empire) can clearly be seen but, again, the duration of most polities, including the largest, are just a few centuries.

The distribution of the size and duration of polities from 3400BCE to 2024CE. Size in millions of km2; duration in centuries. Includes only polities that reach at least 100 K km2 and last for at least 50 years. Compare to Bennett7, their Fig. 5(A).
For those Cliopatria polities with associated Seshat database entries, we compared the area of Cliopatria’s entity polygons with Seshat polity territory data, if any, for the specific image years. The Seshat data comprise previously-collected, independent estimates of polities verified by historians and thus can serve as an indication of the variance in sizes present in Cliopatria. (Of course this comparison does not address the specific location and boundary extents for a polity; see below). The results of the comparison are shown in Fig. 6. The match is very good with a nearly 1:1 linear fit explaining nearly 90% of the variance, increasing our confidence in both datasets. We expect this value to increase as discrepancies are investigated. Indeed, performing this comparison identified several recent mis-coded entities in Seshat which had not yet been as thoroughly checked as older data and which are now corrected in Seshat. This demonstrates that Cliopatria, even in its early stages, is able to draw attention to discrepancies between databases leading to resolution. Further, research35 using the Seshat data has demonstrated that polity territory is a key proxy for social scale. The increased quantity and quality of the Cliopatria area data and its higher temporal resolution will permit more comprehensive investigations into the historical dynamics of social scale.

Comparison of unique paired Cliopatria and Seshat territory size estimates. Note log scales on both axes. Linear fit is shown in orange.
We also selectively compared Cliopatria’s entity polygons against several other available historical geospatial databases, both as a validation check of the Cliopatria records against previously-released resources as well as an indication of discrepancies between Cliopatria and different sources. Overall we find that while Cliopatria is at least comparable in data quality and coverage as other available databases, and often surpasses them in scope and comprehensiveness, there are gaps and disagreements between encodings in certain regions, especially in the existence and extent of Eurasian nomadic steppe empires.
For example, Fig. 7 shows the polygons associated with the Avar Khaganate around 600CE for three different databases, including Cliopatria. While they all agree the Avars in this period occupied much of modern Romania and Hungary, their extent into modern Ukraine and Poland varies widely. This example shows that disagreements between databases can be substantial owing, no doubt, to the underlying procedures and sources referenced in their construction. The prevalence and magnitude of uncertain border locations of historical entities tends to increase into the past. Further, the apparent stability of borders of ancient polities over hundreds of years (as with Old, Middle, and New Kingdom Egypt) may reflect limited historical records rather than the actual stability of the state itself. This is typical of working with historical data, which is often fundamentally uncertain based on the simple paucity of records in addition to differing underlying concepts of border and control.

Comparison of the Avar Khaganate around 600CE. Putative extent of the Avars according to three different datasets. Background image from Google Earth showing modern state boundaries.
Many of the original source maps, which are themselves drawn by hand, employ different cartographic display techniques (e.g., stipple patterns, blurred edges, etc.) to suggest both the uncertain extent and location of some (but not all) borders. However, every known digital encoding of historical polity data, including Cliopatria, use industry-standard digital graphical primitives (raster encodings or polygons formed by latitude and longitude pairs) that are unable, by themselves, to capture this uncertainty which could then be used to inform display techniques or analytic computations. Further there is neither consistent discourse among historians about specific historical border uncertainties nor clear estimates of their location or rough magnitudes over time.
In spite of our attempts to reflect the most current historical knowledge, we acknowledge that Cliopatria’s representation of world history reflects only one version of the territories held by past polities. Thus, we warn users that currently unquantified uncertainty exists and they may need to account for it somehow in their analyses. We hope the availability and improvement of Cliopatria by the scholarly community will yield both improved borders based on documented input from historians and some broadly acceptable encodings of any residual uncertainty or disputes suitable for different computations, even if they are simply explicit alternative representations of the same polities. Indeed, one of the primary motivations of compiling the Cliopatria dataset and providing it as open-source material is to foster such productive, collaborative dialogue with other users and makers of historical geo-spatial information.
Code availability
Code to visualize the Cliopatria data in a Jupiter notebook is included in the Zenodo repository28.
References
Turchin, P. et al. An Introduction to Seshat: Global History Databank. J. Cogn. Hist. 5, 115–123 (2018).
Kaplan, J. O. et al. Holocene carbon emissions as a result of anthropogenic land cover change. The Holocene 21, 775–791 (2011).
Bolt, J. & Zanden, J. L. The Maddison Project: collaborative research on historical national accounts. Econ. Hist. Rev. 67, 627–651 (2014).
Turchin, P. et al. Disentangling the evolutionary drivers of social complexity: A comprehensive test of hypotheses. Sci. Adv. 8, eabn3517 (2022).
Kondor, D. et al. Explaining population booms and busts in Mid-Holocene Europe. Sci. Rep. 13, 1–15 (2023).
Turchin, P. et al. Explaining the rise of moralizing religions: a test of competing hypotheses using the Seshat Databank. Relig. Brain Behav. 1–28 https://doi.org/10.1080/2153599X.2022.2065345 (2022).
Bennett, J. S. Retrodicting the rise, spread, and fall of large-scale states in the Old World. PLOS ONE 17, e0261816 (2022).
Bouckaert, R. et al. Mapping the origins and expansion of the Indo-European language family. Science 337, 957–960 (2012).
Beckwith, C. I. Empires of the Silk Road: A History of Central Eurasia from the Bronze Age to the Present. (Princeton University Press, Princeton, 2009).
Frankopan, P. The Silk Roads: A New History of the World. (Bloomsbury Publishing, 2015).
Spolaore, E. & Wacziarg, R. How Deep Are the Roots of Economic Development? J. Econ. Lit. 51, 325–69 (2013).
Koyama, M. & Rubin, J. How the World Became Rich: The Historical Origins of Economic Growth. (John Wiley & Sons, 2022).
Weidmann, N. B., Kuse, D. & Gleditsch, K. S. The Geography of the International System: The CShapes Dataset. Int. Interact. 36, 86–106 (2010).
ThinkQuest Historical Maps 2000BCE-1994CE. https://web.archive.org/web/20080328104539/ (2006).
Ourednik, A. Historical Basemaps. https://github.com/aourednik/historical-basemaps (2020).
Runivers. https://map.runivers.ru/ (2024).
World Historical Maps. https://worldhist.org/ (2024).
Reba, M., Reitsma, F. & Seto, K. C. Spatializing 6,000 years of global urbanization from 3700 BC to AD 2000. Sci. Data 3, 160034 (2016).
Miller, C. & Bakar, K. S. Conflict Events Worldwide Since 1468BC: Introducing the Historical Conflict Event Dataset. J. Confl. Resolut. 00220027221119085 https://doi.org/10.1177/00220027221119085 (2022).
Isaksen, L., Simon, R., Barker, E. T. & de Soto Cañamares, P. Pelagios and the emerging graph of ancient world data. in 197–201 (ACM, 2014).
Manning, P. & Mostern, R. World-historical gazetteer. (2015).
Old Maps Online. https://www.oldmapsonline.org/ (2024).
GeaCron. http://geacron.com (2024).
Running Reality. https://www.runningreality.org (2024).
Mathematica: Historical Countries. https://reference.wolfram.com/language/ref/entity/HistoricalCountry.html (2024).
The CENTENNIA Historical Atlas. https://historicalatlas.com/ (2024).
Tollefson, A. 508 World Maps. https://www.youtube.com/watch?v=VHG9uSOwx2A (2014).
Bennett, J., Mutch, E. & Chalstrey, E. Cliopatria - A geospatial database of world-wide political entities from 3400BCE to 2024CE. Zenodo https://doi.org/10.5281/zenodo.14714684 (2024).
Kinder, H. & Hilgemann, W. The Penguin Atlas of World History. (Penguin Books, 1977).
Shepherd, W. R. Historical Atlas. (Henry Holt and Company, New York, 1926).
Haywood, J. Cassell’s Atlas of World History. (Cassell, 2001).
The Times Atlas Of World History - A New Edition. (Ted Smart - Times Books, 2000).
Tesseract OCR Software. https://github.com/tesseract-ocr/tesseract.
Taagepera, R. Size and duration of empires: Systematics of size. Soc. Sci. Res. 7, 108–127 (1978).
Turchin, P. et al. Quantitative historical analysis uncovers a single dimension of complexity that structures global variation in human social organization. Proc. Natl. Acad. Sci. 115, E144–E151 (2018).
BC Geographical Names Information System. https://www2.gov.bc.ca/gov/content/governments/celebrating-british-columbia/historic-places/geographical-names.
Canadian Register of Historic Places. https://www.historicplaces.ca/en/pages/register-repertoire.aspx.
Directory of Federal Heritage Designations. https://parks.canada.ca/culture/dfhd.
Society, M. H. Collections of the Maine Historical Society. (The Society, 1890).
McManamon, F. P., Cordell, L. S., Lightfoot, K. G. & Milner, G. R. Archaeology in America: An Encyclopedia. (Greenwood Press, 2009).
Bingham, H. A Residence of Twenty-One Years in the Sandwich Islands: Or, The Civil, Religious, and Political History of Those Islands: Comprising a Particular View of the Missionary Operations Connected with the Introduction and Progress of Christianity and Civilization Among the Hawaiian People. (H. Huntington, 1848).
El Camino Map. ELCA_map.jpg (802×785) https://www.nps.gov/elca/planyourvisit/upload/ELCA_map.jpg.
Hayes, D. Historical Atlas of the Pacific Northwest: Maps of Exploration and Discovery: British Columbia, Washington, Oregon, Alaska, Yukon. (Sasquatch Books, 1999).
National Park Service: El Camino Real de Tierra Adentro historic map. https://www.nps.gov/elca/planyourvisit/maps.htm.
National Register of Historic Places. https://www.nps.gov/subjects/nationalregister/database-research.htm.
Relations des Jésuites contenant ce qui s’est passé de plus remarquable dans les missions des Pères de la Compagnie de Jésus dans la Nouvelle-France. (Augustin Coté, Québec, 1858).
Giggette. Republic of the Rio Grande. (2013).
The 1997–2014 Edition of The National Atlas of the United States. https://www.usgs.gov/centers/eros/science/usgs-eros-archive-digital-maps-national-atlas.
U.S. Statutes at Large, Volume 7. Treaties Between the United States and the Indian Tribes (1789–1845). Library of Congress, Washington, D.C. 20540 USA https://www.loc.gov/item/llsl-v7/.
West Point Digital History Center - Atlases. https://www.westpoint.edu/research/centers-and-institutes/digital-history-center/digital-history-center-atlases.
Mapa Historico de la Trocha Jucaro-Moron Construida por Orden del Conde Valmaseda - Guerra de los 10 Anos 1871. 1.898: El fin de un imperio http://www.eldesastredel98.com/capitulos/trocha.htm.
Solanes Carraro, M. del C. & Vela Ramírez, E. Atlas del México prehispánico: mapas de periodos, regiones y culturas. (Editorial Raíces: Instituto Nacional de Antropología e Historia, México, D.F., 2000).
Coe, M. D., Benson, E. P. & Snow, D. R. Atlas of Ancient America. (Facts on File, 1986).
Atlas: nuevo atlas Porrúa de la República Mexicana. (Editorial Porrúa, México, 1972).
Colman, A. Construction of Complex A at La Venta, Tabasco, Mexico: A History of Buildings, Burials, Offerings, and Stone Monuments. Theses Diss. (2010).
Saturno, W. A., Stuart, D. & Beltrán, B. Early Maya writing at San Bartolo, Guatemala. Science 311, 1281–1283 (2006).
Script Delivery: New World writing takes disputed turn. https://www.sciencenews.org/article/script-delivery-new-world-writing-takes-disputed-turn (2002).
Powell, P. W. Soldiers, Indians and Silver: The Northward Advance of New Spain, 1550–1600. (University of California Press, 1969).
Cowgill, G. L. State and Society at Teotihuacan, Mexico. Annu. Rev. Anthropol. 26, 129–161 (1997).
Sharer, R. J. & Traxler, L. P. The Ancient Maya, 6th Edition. (Stanford University Press, Stanford, Calif, 2005).
Pohl, J. The Legend of Lord Eight Deer: An Epic of Ancient Mexico. (Oxford University Press, 2002).
Engelhardt, Z. The Missions and Missionaries of California. (The James H. Barry company, San Francisco, Cal., 1916).
Flannery, K. & Marcus, J. Zapotec Civilization: How Urban Society Evolved in Mexico’s Oaxaca Valley. (Thames and Hudson, 1996).
Wilkerson, S. J. K. El Tajín: A Guide for Visitors. (Universidad Veracruzana, 1987).
Jones, G. D. The Conquest of the Last Maya Kingdom. (Stanford University Press, Stanford, 1998).
Chamberlain, R. S. The Conquest and Colonization of Honduras: 1502–1550. (Carnegie Institution of Washington, 1953).
Duncan, D. E. Hernando de Soto: A Savage Quest in the Americas. (Crown Publishers, New York, 1995).
Squier, E. G. The States of Central America: Their Geography, Topography, Climate, Population, Resources, Productions, Commerce, Political Organization, Aborigines, Etc., Etc., Comprising Chapters on Honduras, San Salvador, Nicaragua, Costa Rica, Guatemala, Belize, the Bay Islands, the Mosquito Shore, and the Honduras Inter-Oceanic Railway. (Harper & brothers, 1858).
The National Map Small-Scale Collection (USGS). https://www.usgs.gov/programs/national-geospatial-program/small-scale-data.
Aguilera Peña, M. & Borja Gómez, J. H. Atlas Básico de Historia de Colombia. (Revista credencial Historia, Bogotà, 1993).
File:Boundary lines of British Guiana 1896.jpg - Wikipedia. https://commons.wikimedia.org/wiki/File:Boundary_lines_of_British_Guiana_1896.jpg.
Moseley, M. E. The Incas and Their Ancestors: The Archaeology of Peru. (Thames and Hudson, 1992).
Hudson, R. A. & Hanratty, D. M. Bolivia, a Country Study. (Headquarters, Department of the Army, 1991).
Osvaldo, S. G. Atlas de historia de Chile. (Editorial Universitaria, 2005).
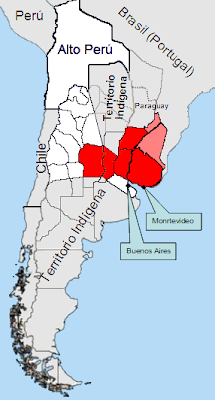
Federico, R., Rosas, Namuncurá Calfucurá, Miles, Yajati, Alan Glagovsky, Eric Moron, Daniel Feldman, Ariel Husni. La Campaña Al Desierto Trabajo de Investigación y Análisis realizado por Yajati, Alan Glagovsky, Eric Moron, Daniel Feldman, Ariel Husni, Federico. - ppt descargar. https://slideplayer.es/slide/12770930/.
Ratto, S. Una experiencia fronteriza exitosa: el negocio pacífico de indios en la provincia de Buenos Aires (1829–1852). Rev. Indias 63, 191–222 (2003).
Liga_Federal_1815.png (215×400). https://3.bp.blogspot.com/_bpt5AxEHutc/Stc8FJihCPI/AAAAAAAAAn0/GKH6RCf4Naw/s400/Liga_Federal_1815.png.
La Liga Federal. Del Sistema de los Pueblos Libres o Protectorado a la derrota de Artigas. - ppt descargar. https://slideplayer.es/slide/1671119/.
Questões do Pirara. https://web.archive.org/web/20070618054818/ (2007).
Droysen, G. Professor G. Droysens Allgemeiner historischer Handatlas: in sechsundneunzig Karten mit erlaüterndem Text, ausgeführt von der geographischen Anstalt von Velhagen & Klasing in Leipzig unter Leitung von Dr. Richard Andree. (Velhagen & Klasing, 1886).
Frere, S. A HISTORY OF ENGLAND ~ Britannia: A History of Roman Britain. (The Folio Society, 1999).
Mattingly, D. J. The olive boom. Oil surpluses, wealth and power in Roman Tripolitania. Libyan Stud. 19, 21–41 (1988).
Encyclopedia Britannica | Britannica. https://www.britannica.com/.
McDonald, R. A. Manx Kingship in Its Irish Sea Setting, 1187–1229: King Rǫgnvaldr and the Crovan Dynasty. (Four Courts Press, 2007).
The Oxford Companion to Scottish History. (Oxford University Press, Oxford, 2001).
Vidal de La Blache, P. Atlas général Vidal-Lablache 1894: Histoire et géographie. (Armand Colin, 2016).
Elégoët, L. Bretagne Une Histoire. (CRDP de Bretagne, 2000).
The Hundred Years War after 1400. https://www.historyonmaps.com/ColourSamples/Hundred_YearsPlus.html.
García de Cortázar Ruiz de Aguirre, F. Atlas de historia de España/Fernando García de Cortázar. (Barcelona: Planeta, 2005., 2009).
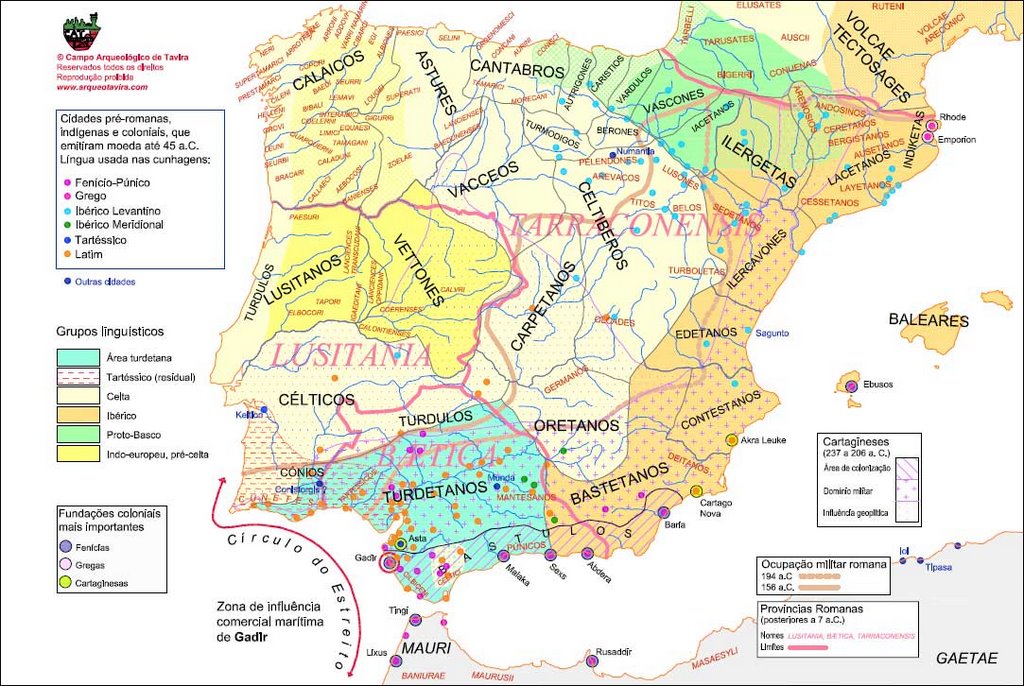
Campo Arqueológico de Tavira. Cídades pré-romanas, indígenas e coloniais, que emitiram moeda até 45 a.C. https://photos1.blogger.com/blogger/2121/1119/1600/populi.jpg.
Expansión peninsular de la Corona de Aragón.svg - Wikipedia, la enciclopedia libre. https://commons.wikimedia.org/wiki/File:Expansi%C3%B3n_peninsular_de_la_Corona_de_Arag%C3%B3n.svg (2008).
de Abreu Galindo, J. Historia de la conquista de las siete islas canarias. (Goya, Santa Cruz de Tenerife, 1977).
Harck, O. & Lübke, C. Zwischen Reric und Bornhöved: die Beziehungen zwischen den Dänen und ihren slawischen Nachbarn vom 9. bis ins 13. Jahrhundert: Beiträge einer internationalen Konferenz, Leipzig, 4.-6. Dezember 1997. (Franz Steiner Verlag, 2001).
Barford, P. M. The Early Slavs: Culture and Society in Early Medieval Eastern Europe. (Cornell University Press, 2001).
Looijenga, T. Texts and Contexts of the Oldest Runic Inscriptions. (BRILL, 2003).
Jansson, S. B. F. Runinskrifter i Sverige. (AWE/Geber, Stockholm, 1984).
Ekerwald, C.-G. Jämtarnas historia intill 1319. (Jengel, 2004).
Krag, C. Vikingtid og rikssamling: 800–1130. (Aschehoug, 1995).
Uino, P. Ancient Karelia: Archaeological Studies = Muinais-Karjala: Arkeologisia Tutkimuksia. (Suomen muinaismuistoyhdistys, Helsinki, 1997).
Gasser, A. & Keller, E. Die territoriale Entwicklung der Schweizerischen Eidgenossenschaft, 1291–1797: mit einer historischen Karte (Masstab 1:500,000). (H.R. Sauerländer, 1932).
Wolfram, H., Daim, F. & Symposion, Ö. A. der W. K. für F. Die Völker an der mittleren und unteren Donau im fünften und sechsten Jahrhundert: Berichte des Symposions der Kommission für Frühmittelalterforschung, 24. bis 27. Oktober 1978, Stift Zwettl, Niederösterreich. (Verlag der Österreichischen Akademie der Wissenschaften, 1980).
Šavli, J. Slovenija, podoba evropskega naroda. (Studio Ro, Založba Humar, Bilje, 1995).
Špiesz, A., Čaplovič, D. & Bolchazy, L. J. Illustrated Slovak History: A Struggle for Sovereignty in Central Europe. (Bolchazy-Carducci Publishers, 2006).
Bartl, J. Slovak History: Chronology & Lexicon. (Bolchazy-Carducci Publishers, 2002).
Fine, J. V. A. The Early Medieval Balkans: A Critical Survey from the Sixth to the Late Twelfth Century. (University of Michigan Press, 1991).
Mapy Uhorska a Slovenska: Nitrianske kniežatstvo r. 800 až 860. Mapy Uhorska a Slovenska https://mapyuhorskaslovenska.blogspot.com/2007/03/nitrianske-knieatstvo-r-800-860.html (2007).
Štih, P. Regnum Carantanum. Zgod. Cas. 40, 215–231 (1986).
Štih, P. Studien zur Geschichte der Grafen von Görz: die Ministerialen und Milites der Grafen von Görz in Istrien und Krain. (Oldenbourg, Wien, 1996).
Bury, J. B. History of the Later Roman Empire, Volume 1: From the Death of Theodosius I to the Death of Justinian. (Dover Publications, 2011).
Benvenuti, G. Le repubbliche marinare. Amalfi, Pisa, Genova, Venezia. (Newton Compton, 1989).
Diacono, P. Storia Dei Longobardi. (Lorenzo Valla; Mondadori, Milan, 1992).
Lazenby, J. F. The First Punic War: A Military History. (Stanford University Press, 1996).
Scarre, C. The Penguin Historical Atlas of Ancient Rome. (London; New York: Penguin Books, 1995).
Hammond, N. G. L. A History of Greece to 322 B.C. (Clarendon Press, 1986).
Hammond, N. G. L. & Walbank, F. W. A History of Macedonia: 336-167 B.C. (Clarendon Press, 1988).
Felczak, W. & Wasilewski, T. Historia Jugosławii. (Zakład Narodowy im. Ossolińskich, 1985).
Nicol, D. M. The Despotate of Epiros 1267–1479: A Contribution to the History of Greece in the Middle Ages. (Cambridge University Press, 1984).
Gudea, N. Der dakische Limes. Materialien zu seiner Geschichte. Jahrb. Röm.-Ger. Zentralmuseums Mainz 44, *1–*113 (1997).
Ostrogorski, G. History of the Byzantine State. (Rutgers University Press, 1969).
The Cambridge Ancient History. vol. 7 (Cambridge University Press, Cambridge, 1984).
Khachikíań, A. & Hewsen, R. H. History of Armenia: A Brief Review. (Edit Print, Yerevan, Armenia, 2010).
Greatrex, G. & Lieu, S. N. C. The Roman Eastern Frontier and the Persian Wars AD 363–628: Ad 363–630, a Narrative Sourcebook. (Routledge, London, 2007).
Tsvetkov, L. & Andreev, K. Atlas of History and Civilization for the 11th Grade. (Картография, Sofia, 2007).
Victorovich, M. Ethnic Components of Chernyakhov Culture. (Stratum Plus, 2000).
Zbiorowa, P. Wielki Atlas Historyczny. (Demart, Warsaw, 2008).
Kaliff, A. Gothic Connections: Contacts between Eastern Scandinavia and the Southern Baltic Coast 1000 BC-500 AD. (Department of archaeology and ancient history, 2001).
Sienkiewicz, W. Ilustrowany atlas historii Polski. (Demart, 2006).
Dubov, I. Cities, Majesties Shining. (Leningrad University Press, 1985).
Expansion of Russia in Asia. https://web.archive.org/web/20170703195123/ (2017).
Alexandrov, B. A. & Tishkov, B. A. The Beginning of Russian History. (Institute of Ethnology and Anthropology of the Russian Academy of Sciences; Наука, 1999).
History of the Political Map of the World. https://lena-dvorkina.narod.ru/.
Хумусwrote, ХH. Карта земель Донского казачьего войска [Map of the lands of the Don Cossack Host]. Атлас земель иррегулярных войск 1858 года [The Atlas of the Land of the Irregular Forces of 1858] https://humus.livejournal.com/4348485.html.
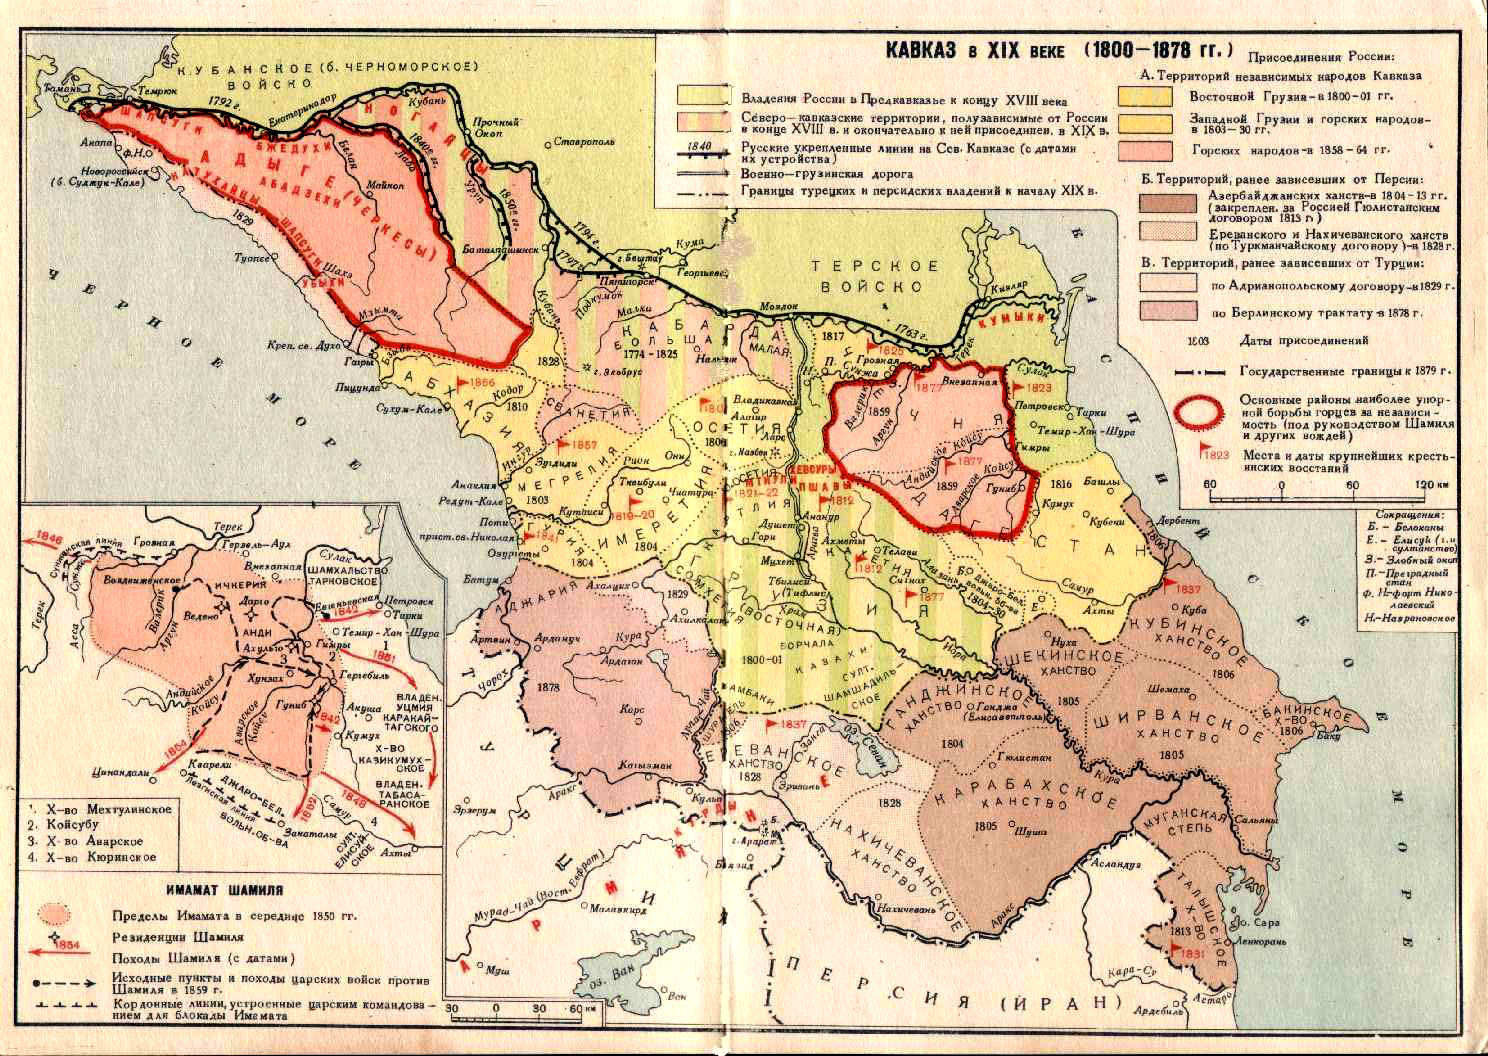
The Caucausus in the 19th Century (1800–1878). http://www.conflicts.rem33.com/images/abkhazia/KARTEN/kaukaz%2019%20rus.JPG.
Fähnrich, H. Putzger Historischer Weltatlas: Geschichte Georgiens von Den Anfängen Bis Zur Mongolenherrschaft. (Shaker, Aachen, 1993).
Misr, F. Farouk of Egypt. R. Artill. Mag. (1949).
Roaf, M. Cultural Atlas of Mesopotamia and the Ancient Near East. (Facts on File, New York, 1990).
Busse, H. Iran under the Būyids. in The Cambridge History of Iran. Volume 4. The period from the Arab Invasion to the Saljuq’s (ed. Frye, R. N.) (Cambridge University Press, 1975).
The Report: Oman 2007. (Oxford Business Group).
Fattovich, R. Akkälä Guzay. Encyclopaedia Aethiopica: A-C 169 (2003).
De Maigret, A. Arabia Felix: An Exploration of the Archaeological History of Yemen. (Stacey International, London, 2002).
Petry, C. F. The Cambridge History of Egypt. vol. 1 (Cambridge University Press, 2008).
The New Cambridge Medieval History: Volume 4: C.1024-c.1198. vol. 4 (Cambridge University Press, Cambridge, 2004).
Duby, G. L’Atlas Historique Mondial. (Larousse, Paris, 1997).
Lewicki, T. The Role of the Sahara and Saharians in relationships between north and south. in General History of Africa, III: Africa from the Seventh to the Eleventh Century (ed. El Fasi, M.) 276–313 (UNESCO, Paris, 1988).
O’Fahey, R. S. The Darfur Sultanate: A History. (Hurst, 2008).
Shinnie, P. L. The Nilotic Sudan and Ethiopia, c. 660 bc to c.ad 600. in The Cambridge History of Africa: Volume 2: From c.500 BC to AD 1050 (ed. Fage, J. D.) vol. 2 210–271 (Cambridge University Press, Cambridge, 1979).
Delessa, T. & Alemayehu, G. Ethiopian History - From Early Axumite Period to the Downfall of Emperor Haile Selassie I. (Aster Nega, 2005).
Issa-Salwe, A. M. & Ciisa-Salwe, C. M. The Collapse of the Somali State: The Impact of the Colonial Legacy. (HAAN, 1996).
Ade Ajayi, J. F. General History of Africa VI: Africa in the Nineteenth Century Until the 1880s. (University of California Press, Berkeley, 1998).
Lattre, J. Atlas Moderne Ou Collection de Cartes Sur Toutes Les Parties Du Globe Terrestre. (1775).
Thornton, J. K. Warfare in Atlantic Africa, 1500–1800. (Psychology Press, 1999).
Chad: A Country Study. (Federal Research Division, Library of Congress: For sale by the Supt. of Docs., U.S. G.P.O, Washington, D.C, 1990).
Curtin, P. D. African History: From Earliest Times to Independence. (Longman, 1995).
Levitzon, N. Ancient Ghana and Mali. (Methuen & Co Ltd, 1973).
Smith, R. S. Warfare & Diplomacy in Pre-Colonial West Africa. (Univ of Wisconsin Press, 1989).
Biran, M. The Empire of the Qara Khitai in Eurasian History: Between China and the Islamic World. (Cambridge University Press, 2005).
Bosworth, C. E. The Tahirids and Saffarids. in The Cambridge History of Iran, Volume 4: From the Arab Invasion to the Saljuqs (ed. Frye, R. N.) 90–135 (Cambridge University Press, Cambridge, 1976).
Bai, S. A History of Chinese Muslims. (Zhonghua Book Company, Beijing, 2003).
Soucek, S. A History of Inner Asia. (Cambridge University Press, Cambridge; New York, 2000).
Sima, Q. Records of the Grand Historian of China. (Columbia University Press, 1961).
Grenet, F. Regional interaction in Central Asia and Northwest India in the Kidarite and Hephthalite periods. in Indo-Iranian Languages and Peoples (ed. Sims-Williams, N.) 0 https://doi.org/10.5871/bacad/9780197262856.003.0010 (British Academy, 2003).
Tarn, W. W. The Greeks in Bactria and India. (Cambridge University Press, 2010).
Bosworth, C. E. The New Islamic Dynasties: A Chronological and Genealogical Manual. (Edinburgh University Press, Edinburgh, 1996).
Shahi Family. Encyclopaedia Britannica.
Chadurah, H. M. History of Kashmir. (Bhavna Prakashan, 1991).
Kenoyer, J. Ancient Cities of the Indus Civilization. (Oxford University Press, Karachi, 1998).
Chandra, S. Medieval India: From Sultanat to the Mughals-Delhi Sultanat (1206–1526) - Part One. (Har-Anand Publications, 2004).
McIntosh, J. Ancient Mesopotamia: New Perspective. (ABC-CLIO, Santa Barbara, 2005).
Kamath, S. U. A Concise History of Karnataka: (From Pre-Historic Times to the Present). (Jupiter Books, 2001).
Schwartzberg, J. E. & Bajpai, S. G. A Historical Atlas of South Asia. (Oxford University Press, Oxford, 1992).
Sims-Williams, N. Bactrian Historical Inscriptions of the Kushan Period. Silk Road 10, 76–80 (2012).
Allan, J. Catalogue of the Coins of Ancient India. (order of the Trustees, 1936).
Singh, P. Federalism, Nationalism and Development: India and the Punjab Economy. (Routledge, 2008).
Singh, M. R. Geographical Data in the Early Purāṇas: A Critical Study. (Punthi Pustak, 1972).
Jayaswal, K. P. & Banerji, R. D. Hathigumpha Inscription of Kharavela of Kalinga. Epigr. Indica Rec. Archaeol. Surv. India 20, 71–89 (1983).
Quintanilla, S. R. History of Early Stone Sculpture at Mathura, ca. 150 BCE-100 CE. (Brill, Leiden, 2007).
Nilakanta, K. A. History of South India: From Prehistoric Times to the Fall of Vijayanagar. (Oxford University Press, 1958).
THE HUNTINGTON ARCHIVE of Buddhist and Asian Art. https://huntingtonarchive.org/resources/historicalMaps.php.
A Military History of China. (University Press of Kentucky, 2012).
China, 1900–1949: The Long March 1934–1935. https://web.archive.org/web/20170629205820/ (2017).
img.xixik.net/custom/topic/xixik_7a995145fffabca0.png. https://web.archive.org/web/20181002140916/ (2018).
Mote, F. W. Imperial China, 900–1800. (Harvard University Press, 2003).
Indian, Chinese, & Japanese Emperors. https://friesian.com/sangoku.htm#china.
Dreyer, E. L. Military Origins of Ming China. in The Cambridge History of China: Volume 7: The Ming Dynasty, 1368–1644 (eds. Twitchett, D. & Mote, F. W.) vol. 7 58–106 (Cambridge University Press, Cambridge, 1988).
Shang Map. map-shang-no-date-2.jpg (720×650) https://www.globalsecurity.org/military/world/china/images/map-shang-no-date-2.jpg.
Drompp, M. R. Tang China And The Collapse Of The Uighur Empire: A Documentary History. (BRILL, 2005).
Taylor, K. W. The Birth of Vietnam. (University of California Press, 1983).
Grousset, R. The Empire of the Steppes: A History of Central Asia. (Rutgers University Press, New Jersey, 1970).
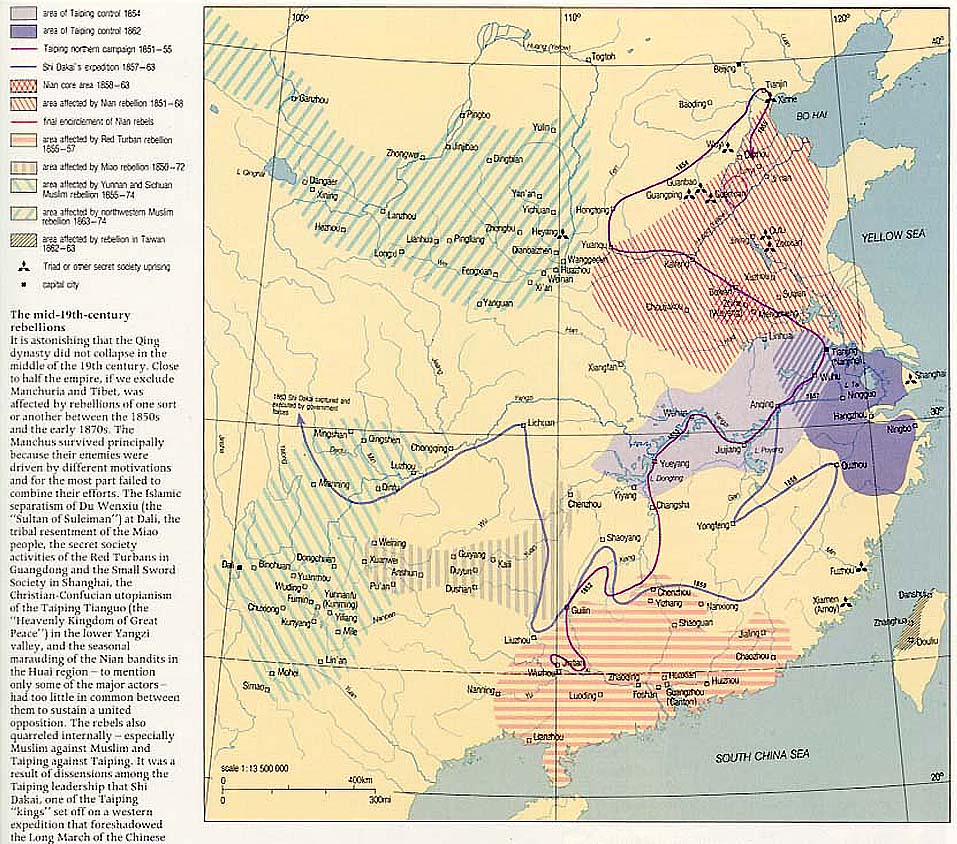
The Mid-19th Century Rebellions. rebelmap.jpg (957×844) https://oook.info/anth230/rebelmap.jpg.
Dotson, B. The Old Tibetan Annals: An Annotated Translation of Tibet’s First History. (Verlag der osterreichischen Akademie der Wissenschaften, 2009).
Blackmore, M. The Rise of Nan-Chao in Yunnan. J. Southeast Asian Hist. 1, 47–61 (1960).
Forbes, A. D. W. Warlords and Muslims in Chinese Central Asia: A Political History of Republican Sinkiang 1911-1949. (Cambridge University Press, Cambridge [Cambridgeshire], 1986).
Sima, G. Zizhi Tongjian: Warring States and Qin Volume 1 To 8. (CreateSpace Independent Publishing Platform, 2016).
Ishjamts, N. Nomads in Eastern Central Asia. in History of civilizations of Central Asia, Volume II. The development of sedentary and nomadic civilizations: 700 B.C. to A.D. 250 (eds. Harmatta, J., Puri, B. N. & Etemadi, G. F.) 146–164 (UNESCO, 1994).
Yi, K. A New History of Korea. (Harvard University Press, 1984).
Korea National University of Education. Atlas of Korean History. (Stallion Press, Singapore, 2004).
Barnes, G. L. State Formation in Korea: Historical and Archaeological Perspectives. (Curzon, Richmond, 2001).
Howell, D. L. Capitalism from Within: Economy, Society, and the State in a Japanese Fishery. (University of California Press, 1995).
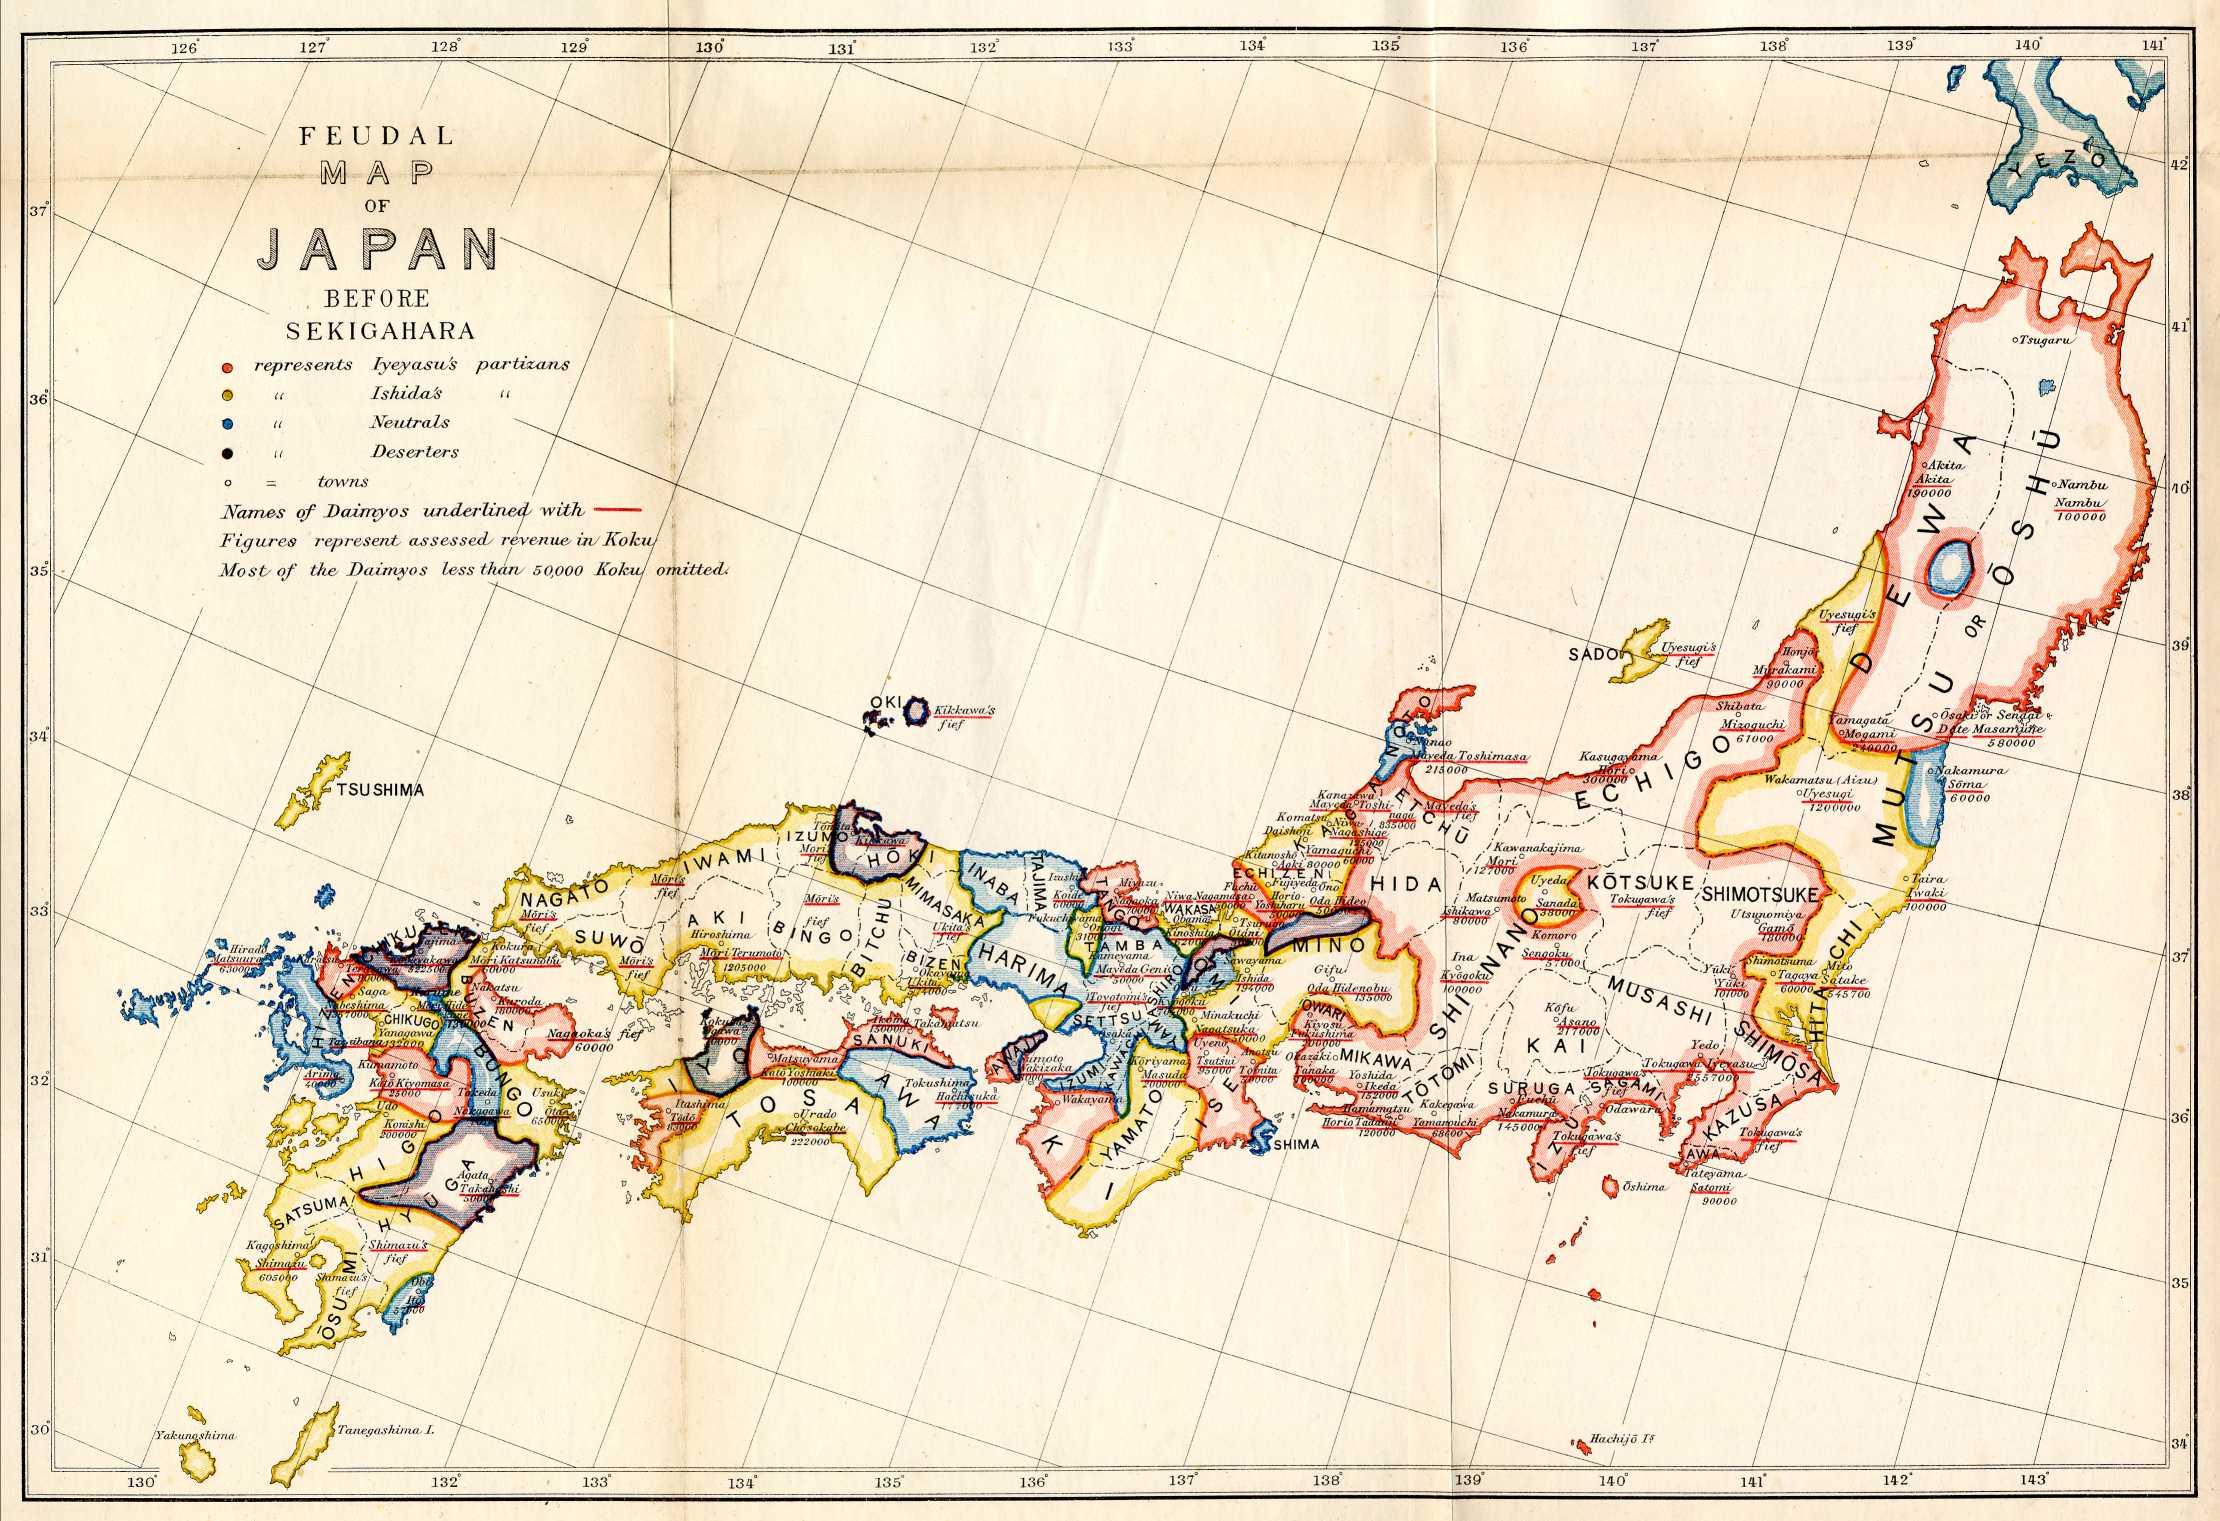
Feudal Map of Japan Before Sekigahara. 0005.jpg (2220×1521) http://www.maproom.org/00/05/0005.jpg.
Sekigahara Campaign 1600. https://web.archive.org/web/20200223223845/ (2020).
Sengoku Daimyo 1525. https://web.archive.org/web/20200219191035/ (2020).
Sengoku Daimyo 1545. https://web.archive.org/web/20200219190939/ (2020).
Sengoku Daimyo 1550. https://web.archive.org/web/20200128054712/ (2020).
Sengoku Daimyo 1560. https://web.archive.org/web/20200225221016/ (2020).
Sengoku Daimyo 1572. https://web.archive.org/web/20190919153342/ (2019).
Turnbull, S. The Samurai Sourcebook. (Arms and Armour Press, 1998).
The Unification of Japan. https://web.archive.org/web/20200131011743/ (2020).
West, B. A. Encyclopedia of the Peoples of Asia and Oceania. (Facts On File, New York, 2009).
Lafont, P.-B. Les Frontières du Vietnam: histoire des frontières de la péninsule indochinoise. (L’Harmattan, 1989).
Maspero, G. The Champa Kingdom: The History of an Extinct Vietnamese Culture. (White Lotus Press, 2002).
Whitmore, J. K. The Development of Le Government in Fifteenth Century Vietnam. (Cornell University, 1968).
Higham, C. The Civilization of Angkor. (University of California Press, 2004).
Cœdès, G. The Indianized States of Southeast Asia. (Australian National University Press, Canberra, 1975).
Wyatt, D. K. Thailand: A Short History. (Yale University Press, 2003).
Saraya, D. Lavo — A Coastal State of the 11th Century. Muang Boran 11, 35–51 (1985).
Jumsai, M. Popular History of Thailand. (Chalermnit Press, Bangkok, 1976).
Harvey, G. E. History Of Burma. (Laurier Books Ltd, 1925).
Baruah, S. L. Last Days of Ahom Monarchy: A History of Assam from 1769–1826. (Munshiram Manoharlal Publishers, 1993).
Beckwith, C. Medieval Tibeto-Burman Languages. (Brill, 2002).
Sandamala Linkara, A. Rakhine Yazawinthit Kyan. (Tetlan Sarpay, Yangon, 1931).
O’Reilly, D. J. Early Civilizations of Southeast Asia. (Rowman Altamira, Lanham, 2007).
Syukri, I. History of the Malay Kingdom of Patani. (Ohio University, Center for International Studies, 1985).
Sabah and the Sulu claims | The Brunei Times. https://web.archive.org/web/20140617035533/ (2014).
Karim, S. Tatabahasa Dewan. (Dewan Bahasa dan Pustaka, Kuala Lumpur, 2011).
Sidhu, J. S. Historical Dictionary of Brunei Darussalam. (Scarecrow Press, 2009).
Careri, G. F. G. Giro del mondo del dottor d. Gio. Francesco Gemelli Careri… Parte prima (-sesta): Parte quinta contenente le cose piu ragguardevoli vedute nell’Isole Filippine. (presso Domenico-Ant. e Nicola Parrino, 1721).
Majul, C. A. Muslims in the Philippines. (University of the Philippines Press, Quezon City, 1999).
Palawan Tourism Council - History. https://web.archive.org/web/20080731121053/ (2008).
Malkiel-Jirmounsky, M. The Study of The Artistic Antiquities of Dutch India. Harv. J. Asiat. Stud. 4, 59–68 (1939).
Ricklefs, M. C. A History of Modern Indonesia since c. 1300. (Stanford University Press, Stanford (Ca.), 1993).
Munoz, P. M. Early Kingdoms of the Indonesian Archipelago and the Malay Peninsula. (Continental Sales, Incorporated, 2006).
Vogel, J. P. The Earliest Sanskrit Inscriptions of Java. (Albrecht, Weltevreden, 1925).
Hobart, A., Ramseyer, U. & Leemann, A. The People of Bali. (Wiley, 2001).
WHKMLA: Historical Atlas, Indonesia Page. https://web.archive.org/web/20130903064457/ (2013).
Latif, C. & Lay, I. Atlas sejarah Indonesia dan Dunia. (Pembina Peraga, Jakarta, 1992).
Arrowsmith, J. The South Eastern Portion of Australia Compiled from the Colonial Surveys, and from Details Furnished by Exploratory Expeditions, By J. Arrowsmith. (with) Inset Outline Map of Australia. (Map) 35. London, Pubd. 2d. June 1842, by J. Arrowsmith, 10 Soho Square. (1844).
Acknowledgements
We thank Lisa Light for suggesting the name “Cliopatria” for the dataset. Funding was provided by the AHRC-funded project “Data/Culture, Building sustainable communities around Arts and Humanities datasets and tools”, Alan Turing Institute, Pieter Francois (£1.6 M). Peter Turchin and Seshat support is supported by the “Complexity Science” program of the Austrian Research Promotion Agency FFG under grant #873927.
Author information
Authors and Affiliations
Contributions
James Bennett led the project, wrote the manuscript, and developed the code for parsing the original images and preparing review datasets. Erin Mutch developed an initial version of the dataset and provided important comments on GIS processing of the final dataset and on the manuscript. Andrew Tollefson developed the initial images and recorded the references used to create them. Ed Chalstrey developed code for storage of the data and display of the data for historical review. Majid Benam developed code for the storage of the data and verification of the links to Seshat. Enrico Ciono, Jenny Reddish, Jakob Zsambok, and Jill Levin reviewed the data and shapes for historical accuracy. C. Justin Cook provided an initial version of the data set and made critical comments on the manuscript. Pieter Francois, Daniel Hoyer, and Peter Turchin provided funding, project management and guidance, and comments on the manuscript.
Corresponding author
Ethics declarations
Competing interests
The authors declare no competing interests.
Additional information
Publisher’s note Springer Nature remains neutral with regard to jurisdictional claims in published maps and institutional affiliations.
Rights and permissions
Open Access This article is licensed under a Creative Commons Attribution 4.0 International License, which permits use, sharing, adaptation, distribution and reproduction in any medium or format, as long as you give appropriate credit to the original author(s) and the source, provide a link to the Creative Commons licence, and indicate if changes were made. The images or other third party material in this article are included in the article’s Creative Commons licence, unless indicated otherwise in a credit line to the material. If material is not included in the article’s Creative Commons licence and your intended use is not permitted by statutory regulation or exceeds the permitted use, you will need to obtain permission directly from the copyright holder. To view a copy of this licence, visit http://creativecommons.org/licenses/by/4.0/.
About this article

Cite this article
Bennett, J.S., Mutch, E., Tollefson, A. et al. Cliopatria - A geospatial database of world-wide political entities from 3400BCE to 2024CE. Sci Data 12, 247 (2025). https://doi.org/10.1038/s41597-025-04516-9
Received:
Accepted:
Published:
Version of record:
DOI: https://doi.org/10.1038/s41597-025-04516-9
