
Abstract
Automated driving systems enable drivers to perform various non-driving tasks, which has led to concerns regarding driver distraction during automated driving. These concerns have spurred numerous studies investigating driver performance of fallback to driving (i.e., takeover). However, publicly available datasets that present takeover performance data are insufficient. The lack of datasets limits advancements in developing safe automated driving systems. This study introduces TD2D, a dataset collected from 50 drivers with balanced gender representation and diverse age groups in an L2 automated driving simulator. The dataset comprises 500 cases including takeover performance, workload, physiological, and ocular data collected across 10 secondary task conditions: (1) no secondary tasks, (2) three visual tasks, and (3) six auditory tasks. We anticipate that this dataset will contribute significantly to the advancement of automated driving systems.
Background & Summary
Advancements in in-vehicle systems allow drivers to conveniently engage in various non-driving-related tasks (or secondary tasks)1,2,3. For instance, with the integration of voice assistants such as Google Auto, drivers can read and reply to messages without needing their visual attention4. The integration of advanced deep-learning technology (e.g., ChatGPT) in in-vehicle voice assistants has provided drivers with the opportunity to perform various secondary tasks that were previously impossible5,6. Advancements in driving automation systems reduce the effort required for driving, providing drivers with more opportunities to engage in secondary tasks7,8,9. The evolution of in-vehicle systems has transformed vehicles from mere tools for movement into spaces for leisure and work10.
While secondary tasks make drivers’ travel time more productive and enjoyable, they can also lead to distracted driving. Distracted driving occurs when drivers divert their attention from driving to engage in secondary tasks, which has been a major cause of traffic accidents11,12. Therefore, researchers are focused on understanding how distracted driving occurs and impacts driving performance11,12,13,14,15,16. For example, Strayer et al. analyzed drivers’ driving performance and perceived workload when utilizing voice assistants on their smartphones (e.g., Apple Siri) in manual driving contexts16. They found that these voice assistants may increase workload and decrease driving performance.
Recently, partial (or SAE level 2) automated driving systems (e.g., Tesla Autopilot17) have become widely available. They control the vehicle’s longitudinal and lateral directions18. However, even with these systems, distracted driving can still occur because current automated driving systems are imperfect; they cannot respond to all driving situations18. For example, these systems may not detect or respond to unanticipated (or critical) events, such as pedestrian jaywalking. In such cases, drivers need to immediately take over control of the vehicle (i.e., takeover) and drive manually to avoid traffic accidents. Therefore, drivers must continuously monitor the driving situation during automated driving to ensure immediate takeovers19. If drivers are distracted by secondary tasks, they may fail to take over successfully, increasing the risk of traffic accidents.
To fully leverage the advantages of automated driving for secondary tasks, understanding the impact of secondary tasks on the takeover performance during L2 automated driving is crucial. This includes examining whether and to what extent drivers can successfully perform takeovers while being engaged in secondary tasks. An increasing number of studies have actively investigated the impact20,21,22. For example, Louw et al. found that during L2 automated driving, drivers took more time to perform a takeover in response to automation failures when engaging in visual secondary tasks compared to when no secondary task was performed22. Similarly, Blommer et al. found that drivers watching videos took more time to perform a takeover in response to critical events during L2 automated driving than drivers listening to audio20.
To investigate how secondary tasks influence takeover performance in L2 automated driving, researchers need rich and reproducible datasets that capture drivers’ takeover performance while engaged in secondary tasks. In the manual driving context, numerous datasets provide collected in-vehicle data of drivers performing secondary tasks23,24,25,26,27,28,29,30. These datasets provide multimodal data (e.g., physiological and ocular sensor signals) of drivers performing secondary tasks during driving and help to understand the impacts of secondary tasks on the drivers’ state and driving performance. However, these datasets are not directly applicable to L2 automated driving because the data collection scenarios are different. For instance, while the MPDB provides the physiological and ocular data for analyzing driver behavior in manual driving contexts, it does not consider L2 automated driving contexts29. In contrast, ADABase considers L2 automated driving contexts and offers multimodal data of drivers performing secondary tasks during L2 automated driving31. However, the dataset cannot be used to understand the impact of secondary tasks on drivers’ takeover performance because it includes exclusively collected data during L2 automated driving, without considering takeover situations where drivers need to take over control. The manD 1.0 uniquely considers takeover situations, focusing primarily on variations due to emotional states30. However, the dataset is unsuitable for examining takeover performance under different secondary task conditions.
In this paper, we introduce TD2D32, a dataset on takeovers during distracted L2 automated driving, enabling both exploratory and hypothesis-driven investigations on the impact of various types of secondary tasks on takeover performance during L2 automated driving. The dataset has been collected from L2 automated driving scenarios, wherein drivers responded to critical events by taking over control across 10 secondary task conditions. The conditions include three visual tasks, three naturalistic auditory tasks, three reference auditory tasks, and one baseline (no secondary task) condition. For data collection, we recruited 50 drivers and ensured balanced gender representation and diverse age groups. The dataset provides data on takeover performance, physiological and ocular sensor signals, and the workload data of the drivers. To the best of our knowledge, our dataset is the only publicly available dataset that provides takeover performance data in L2 automated driving contexts, including data on takeover performance depending on various secondary tasks, as summarized in Tables 1, 2. We anticipate the dataset to help researchers contribute to safe L2 automated driving by understanding the takeover performance of drivers performing various secondary tasks.
Methods
Ethics approval
Our study was approved by the Institutional Review Board (IRB) of Kangwon National University (KWNUIRB-2022-02-005001). All participants submitted a written consent form after we briefed them on the purpose of this dataset, the data collection procedure and settings, the types of collected data, data disclosure, and the compensation process. We did not collect any personal information, such as names and phone numbers that could be used to identify individuals.
Experimental procedure
Our data collection was conducted under an L2 automated driving scenario, where drivers were required to take control of an automated vehicle and perform manual driving to avoid a crash. This need arises when a vehicle fails to respond appropriately to a road event while the drivers are engaged in various secondary tasks (for the details, see the Automated Driving Scenario Section and the Secondary Task Conditions Section, respectively). To ensure driver safety, all scenarios were conducted using a driving simulator (for the details, see the Simulator Section). In addition, the driving simulator offered advantages for better control of scenarios and secondary task conditions while reducing measurement errors33.
Upon the arrival of the drivers at the laboratory, we first explained the purpose and procedures of the experiment to them. Those who agreed to participate in the experiment signed the IRB consent form. Next, the drivers completed a survey on their demographic information (e.g., age, gender, and date of obtaining their driver’s license). The drivers wore an E4 wristband, H10 chest band, and Pupil Core (for the details, see the Wearable Sensors Section) before sitting in the simulator. The chair and backrest angles of the simulator were adjusted according to the driver’s preferences. Next, the drivers practiced takeovers in response to critical events until they became proficient. They underwent at least four practice sessions, with additional sessions if necessary. Subsequently, they drove in ten automated driving scenarios with different secondary task conditions, where the order of the conditions was counterbalanced. Every automated driving scenario began with a practice session for the secondary task performed in that scenario. In each practice session, we calibrated the Pupil Core to ensure sensing accuracy. After completing each scenario, the drivers filled out the NASA-TLX questionnaire to assess their perceived workload during that scenario, followed by a brief rest (for the details, see the Measurements section). The average experiment duration was 2.71 hours (SD = 0.44, range = 2.07–3.33) (or an average of 162.6 minutes), including the time spent on calibration and practice. The duration also included rest breaks of 40 minutes.
Participants
By advertising with posters in local communities and on online forums, we recruited 50 drivers who held valid driver’s licenses and drove at least once every week. In addition, the drivers were required not to wear eyeglasses because the physical interference and reflection of eyeglasses could have caused incorrect tracking of ocular movements. Drivers with prescribed eyeglasses wore contact lenses during the experiment. To ensure generalizability, we balanced the age and gender distributions. We recruited ten drivers across five age groups ranging from their twenties to their sixties, separated by ten years while maintaining an equal gender ratio of five males and five females for each group. Their average age and driving experience were 43.8 years (SD = 14.3, range = 20–67) and 16.9 years (SD = 14.3, range = 1–43), respectively. To compensate for their participation, each driver received approximately 30 USD.
Apparatus
Simulator
As shown in Fig. 1, our simulation setting comprised a cockpit module for maneuvering a simulated vehicle, a screen for displaying driving situations, and a speakerphone (Jabra Speak 510) allowing the drivers to engage in auditory secondary tasks. The screen was composed of three 24-inch monitors, each arranged at an angle of 135 degrees. The height at the center of the monitor was 1 meter. The distance between the driver and the center of the monitors was adjusted by changing the seat’s location from 0.71 to 1.03 meters depending on the drivers’ preferences. The cockpit module comprised a movable seat and a Thrustmaster’s T500RS wheelset.

L2 automated driving simulator. The lower left section shows the movable seat and desktop computer. The center shows the Thrustmaster’s T500RS racing-wheel set and the Jabra Speak 510 speakerphone. The upper right section shows the experimental scenario screen.
To simulate our automated driving scenario, we modified the CARLA (ver. 0.9.11), which is an open-source driving simulation software designed for testing automated driving systems34. Major modifications included the following: (1) enabling an immediate transition from L2 automated driving to manual driving by manipulating the steering wheel or pedals, and (2) logging the ego vehicle’s state (e.g., direction, speed, and location); maneuvering behavior (e.g., pedaling and steering); and vehicle accidents (e.g., the occurrence of critical events, collision with the leading vehicle, and hitting the sidewalk). Furthermore, simulated routes and traffic conditions were generated using Matlab’s RoadRunner Scenario35, an interactive editor for designing scenarios for automated driving simulations. The routes and conditions were imported to the modified CARLA.
Wearable sensors
We employed three wearable sensors to collect drivers’ physiological and ocular responses during L2 automated driving (see Fig. 2). The time settings of these sensors were synchronized with the Network Time Protocol server at time.google.com to ensure consistent and accurate timing across all the devices. Further details are as follows:
-
Polar’s H10 chest band was worn on the bare skin of participants’ chests to collect electrocardiogram (ECG) signals and heart rate (HR) at 130 Hz and in bpm, respectively. Similar to the Empatica E4, the Polar H10 transmitted sensor data to a smartphone in real time using Bluetooth. The sensor data were stored in the internal storage of the provided smartphone and later retrieved.
-
Empatica’s E4 wristband was used to collect photoplethysmography (PPG) and electrodermal activity (EDA) signals at 64 Hz and 4 Hz, respectively. Drivers wore the E4 wristband on their preferred hand. Sensor readings collected from the E4 wristband were transferred to the provided smartphone via Bluetooth and uploaded to Empatica’s online cloud. After the experiment, we manually downloaded the sensor data from the cloud.
-
Pupil Labs’ Pupil Core is a glass-shaped headset comprising two eye cameras placed below both eyes (refresh rate: 200 Hz, resolution: 192 × 192 pixels) and a scene camera mounted above the eyes (refresh rate: 60 Hz, resolution: 1280 × 720 pixels). Videos recorded with the three cameras were transmitted to a desktop computer connected via a USB-A cable and later used to derive ocular responses (pupil diameter, gaze, and fixation) using the Pupil Capture software36.

Wearable sensors for data collection.
Automated driving scenario
At the beginning of the scenario, the ego vehicle autonomously drove at a constant speed of 50 km/h, a speed commonly used in automated driving studies focused on city driving37,38,39, in the right lane of a straight two-lane road (for the details, see the Simulator Section). Considering the braking time in our simulation environment, we set the time-to-collision (TTC) was set to 2 seconds. Under this TTC condition, the driver could avoid a collision by pressing the brake pedal within 1.01 seconds of the occurrence of a critical event (i.e., approximately a second before a collision), which represented the average response time for a driver at L2 driving at 50 km/h37.
The leading vehicle was positioned 25 meters ahead of the ego vehicle and moved at the same speed. Multiple pedestrians stood on each sidewalk along the road at intervals of 37.6 meters to prevent the driver from predicting the timing of critical events. After the ego vehicle started at a random time between 50 and 130 seconds (M = 90.9, SD = 18.2), one of the following events was randomly selected to occur: a pedestrian jaywalking from the (1) left or (2) right sidewalks, or (3) the leading vehicle coming to a sudden stop. Each critical event occurred either on the left, right, or center of the vehicle’s path, requiring the driver to monitor the driving environment evenly. During jaywalking events, one of the pedestrians on the sidewalks would suddenly cross the road. In a sudden stop event, the leading vehicle would suddenly stop.
The L2 automated system could not properly respond to such critical events; therefore, the drivers were instructed to take over the automated vehicle and perform maneuvers to avoid crashes. The scenario ended after the drivers’ reactions to the critical events were recorded. Further, we instructed the drivers to score their perceived workload during a given scenario (see the Measurements Section). Each participant experienced one scenario for each secondary task condition, resulting in ten scenarios. Each scenario was designed to be completed within 3 minutes.
Secondary task conditions
During L2 automated driving, the drivers experienced 10 secondary task conditions with different modalities that caused distracted driving. These conditions included (1) a baseline where drivers did not have to engage in any secondary tasks, (2–4) three reference auditory tasks, (5–7) three naturalistic auditory tasks, and (8–10) three visual tasks. Each task was conducted in Korean, which was the drivers’ first language.
Reference auditory tasks
Reference auditory tasks (or cognitive reference tasks in driver distraction research) are pseudo-tasks that are intended to systemically control drivers’ cognitive workloads. For reference tasks, we employed n-back (or delayed digit recall) tasks40, which have been widely used as cognitive reference tasks in driver distraction research40,41,42,43,44,45,46. In the tasks, random single-digit numbers were delivered ten times, with a 2.25-second interval between subsequent numbers, through the provided speakerphone. The drivers listened to a sequence of single-digit numbers and recalled the number that was presented n steps earlier. As the number (n) increased, the cognitive load required for the task increased systematically.
We employed the 0-back, 1-back, and 2-back tasks, which have been commonly used in the literature40,41,42,45,46, as follows:
-
0-back task: This task required the drivers to immediately verbally repeat the last number they heard. For instance, as shown in Fig. 3, drivers were required to say “3” right after hearing “3.”
Fig. 3 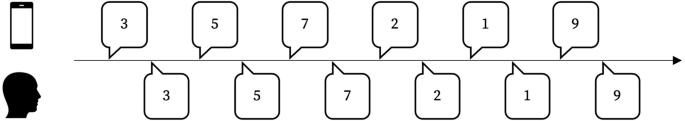
Example of the 0-back task process. After a number is presented, the driver immediately verbally repeats the number. A total of 10 numbers are provided, and the next 0-back task starts immediately after the current one ends.
-
1-back task: This task required the drivers to memorize the number preceding the last number and then verbally repeat it when the last number was presented. For example, as shown in Fig. 4, they needed to remain silent when the first number, “3,” was presented. After the second number, “5,” was presented, they were required to speak the first number, “3.” When the third number, “7,” was presented, they responded with the second number, “5.”
Fig. 4 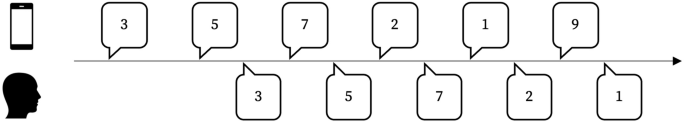
Example of the 1-back task process. After a number is presented, the driver verbally repeats the number that precedes it. A total of 10 numbers are provided, and the next 1-back task starts immediately after the current one ends.
-
2-back task: This task required the drivers to remember the number before the last two numbers and verbally repeat it after hearing the last number. For instance, as shown in Fig. 5, when the first and second numbers, “3” and “5,” were presented, the drivers were required to remain silent. When the third number, “7,” was presented, they were required to respond with the first number, “3.”
Fig. 5 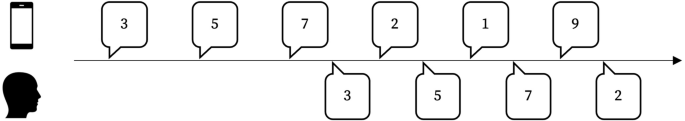
Example of the 2-back task process. After hearing the number, the driver verbally repeats the number that is two numbers prior. A total of 10 numbers are provided, and the next 2-back task starts immediately after the current one ends.


Naturalistic auditory tasks
Naturalistic auditory tasks are existing in-vehicle conversational services provided by voice assistants. Previous studies have reported variations in driver distraction depending on whether a given task requires the driver to speak47,48 and involves numbers or language presentation49. Considering these findings, we employed the following three naturalistic secondary tasks:
-
Audiobook listening task: Drivers often listen to audiobooks or a radio when in a vehicle. The audiobook listening task required the drivers to listen to an audiobook, Anton Chekhov’s farce story “A Marriage Proposal.”
-
Auditory gaming task: Currently, voice assistants such as Amazon Alexa, offer various interactive verbal games50. The auditory gaming task required the drivers to play a classic guessing game called “Guess the Number,” which aimed to guess a given number ranging from 1 to 100, with the fewest possible attempts. For the drivers’ every guess, the voice assistant provided verbal feedback (see Fig. 6, such as “Up,” “Down,” or “Correct,” corresponding to whether each guess denoted upper than, lower than, or equal to the given number, respectively. This task required the driver’s mental arithmetic resources.
Fig. 6 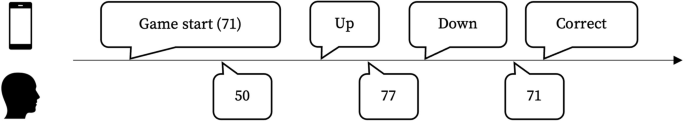
Example of the auditory gaming task process. When the game begins, the voice assistant selects a random number between 1 and 100 (the number in brackets). This number is not disclosed to the driver. When the driver guesses the number incorrectly, the voice assistant provides a hint as either “Up” or “Down.” When the driver guesses the number correctly, the next game starts immediately.
-
Auditory texting task: Texting while driving is a common secondary task. During the auditory texting task, a researcher sent a series of question messages to the drivers quizzing their daily lives (e.g., “What did you have for dinner last night?”). The drivers replied to the messages in the form of voice commands. The voice commands were similar to those of Google Assistant with Android Auto (see Fig. 7). Question messages were randomly selected from a list of preselected questions (all the questions are presented in Table 3). This task required the driver’s linguistic resources.
Fig. 7 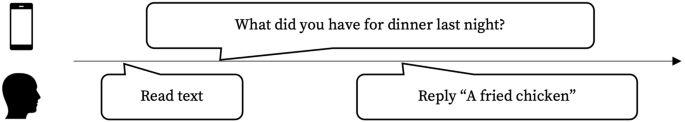
Example of the auditory texting task process. When a researcher sends a question, the driver checks the message and responds with a voice command. Immediately after the driver responds, the next question is sent.
Table 3 List of questions asked to participants during secondary task conditions, namely auditory texting in naturalistic auditory tasks and texting in visual tasks.


Visual tasks
Visual tasks represent the visual counterparts of naturalistic auditory tasks. These tasks include e-book reading, texting, and gaming, which correspond to audiobook listening, auditory texting, and auditory gaming. For this experiment, the drivers performed visual tasks using the provided smartphone. The details of the visual tasks are as follows:
-
E-book reading: This task required the drivers to read Gim Yujeong’s Korean novel “Manmubang,” displayed on the provided smartphone. We selected content different from the audiobook listening task because familiarity with the same content would make the drivers less interested and thus shallowly engage in secondary tasks.
-
Gaming: This task required the drivers to play “Guess the Number,” almost the same as in the auditory gaming task. The major differences were that the drivers were required to manually type their guessed number and feedback was displayed on the provided smartphone.
-
Texting: This task required the drivers to reply to a researcher’s question messages by manually typing the replies. Similar to the auditory texting task, question messages were randomly selected from the preselected list (Table 3).
Measurements
To investigate the impact of secondary tasks on the drivers’ ability to cope with critical events, we measured (1) takeover performance and (2) driver workloads.
Takeover performance
To assess the takeover performance, we intended to quantify two different aspects of the drivers’ abilities to handle critical events. Specifically, we incorporated both time-based and takeover quality measures: takeover reaction time and takeover success. The takeover reaction time represents how quickly a driver reacts to critical events (or performs the takeover). Takeover reaction time is defined as the time elapsed from the onset of a critical event (e.g., jaywalking) to the first moment of the driver’s maneuvers (e.g., putting on the brake pedal or manipulating the steering wheel) in milliseconds. This measurement has been widely used in prior studies to analyze driver takeover performance in automated driving51. Takeover success represents whether the drivers successfully take control of a vehicle and avoid collisions during the critical events. Takeover success provided a binary outcome: success or failure. Takeover was defined as a failure when the ego vehicle crashed into other objects (the leading car or pedestrian) or drove onto a sidewalk. Both takeover reaction time and takeover success were calculated using simulator logs.
Driver workload
To assess the drivers’ perceived workload, we used the NASA Task Load Index (NASA-TLX)52. NASA-TLX is a multidimensional assessment questionnaire that assesses six dimensions of workload: (1) mental demand (cognitive and perceptual requirements of a task); (2) physical demand (the level of physical activity required to complete a task); (3) temporal demand (degree of time pressure during a task); (4) performance (degree of goal accomplishment during a task); (5) effort (degree of overall mental and physical exertion to accomplish the activities); and (6) frustration (degree of being insecure and discouraged during a task).
After each secondary task condition, the recruited drivers provided ratings for each dimension (0: no demand, 100: maximum demand). Further, we conducted pairwise comparisons among the dimensions (15-pair comparisons in total) to determine their relative importance. The relative importance (or weight) of each dimension was calculated by dividing the number of times a given dimension was selected as more important than the other by 15. The TLX score was obtained by calculating the weighted average of the ratings across all the dimensions, reflecting the overall perceived workload. Furthermore, a raw TLX score that averaged the dimension ratings without considering their weights was provided.
Data Records
The TD2D dataset32 is available in the online repository. This dataset includes physiological and ocular sensor data, takeover performances, and perceived workloads from 500 experimental scenarios for 50 participants, with 10 experimental scenarios and their basic demographics per participant. All data are provided as comma-separated values (CSV) and MPEG-4 Part 14 (.mp4) format, totaling 16.7 GB. Figure 8 presents an overview of the TD2D dataset.

Overview of the TD2D dataset.
Basic demographics
The basic demographics of the participants are presented in a file named driverInformation.csv, which contains the following fields:
-
Dn: the unique identifier of each participant.
-
age: international age as of the experiment date for each participant.
-
gender: M or F corresponds to male or female, respectively.
-
drivingExperience: the number of years from the driving license acquisition to this experiment.
-
These variables represent how often the participants engage in a specified task (0: never, 1: less than once per month, 2: at least once per month but less than once per week, and 3: at least once per week).
-
ebookFrequency: values range from 0 to 3, corresponding to how often the participant reads e-books.
-
audiobookFrequency: values range from 0 to 3, corresponding to how often the participant listens to audiobooks.
-
textingFrequency: values range from 0 to 3, corresponding to how often the participant texts.
-
voiceTextingFrequency: values range from 0 to 3, corresponding to how often participant texts using voice commands.
-
guessTheNumberFrequency: values range from 0 to 3, corresponding to how often the participant plays the “Guess the Number” game.
-
nbackFrequency: values range from 0 to 3, corresponding to how often the participant performs the n-back test.
Takeover scenario information
Information on the experimental scenarios, takeover performances, and perceived workloads is presented in the file takeoverScenarioInformations.csv, which is included in a sub-directory indicating the type of secondary tasks under a parent directory named after each driver’s unique identifier (i.e., the Dn field in driverInformation.csv). The names of the sub-directories for secondary task types include baseline (no secondary task was given), 0-back, 1-back, 2-back (0-back, 1-back, and 2-back of reference auditory tasks, respectively), audiobook listening, voice texting, voice gaming (audiobook listening, voice texting, and voice gaming of naturalistic auditory tasks, respectively), e-book reading, texting, and gaming (e-book reading, texting, and gaming of visual tasks, respectively). For example, data collected while a driver, D01 was engaged in audiobook listening is placed in D01/audiobook listening/takeoverScenarioInformations.csv. The first three fields in the file describe the experimental scenarios.
-
criticalEventType: a type of critical event that occurred in a given scenario. The value of this field can either be L (pedestrian jaywalking from the left), R (pedestrian jaywalking from the right), or F (leading vehicle came to a sudden stop).
-
criticalEventOccurrenceTime: the timestamp (in milliseconds) at which a critical event occurred, where a given scenario begins at 0 milliseconds.
-
scenarioEndTime: the timestamp (in milliseconds) at which a given scenario is completed.
The next two fields include information on takeover performance:
-
takeoverSuccess: Success or Failure corresponds to whether the driver avoids accidents, respectively.
-
reactionTime: the latency (in milliseconds) from the critical event occurrence to the driver’s first maneuver.
The last 14 fields are relevant to the perceived workload measured using NASA-TLX:
-
NASA-TLX: the NASA-TLX scores for a given scenario, ranging from 0 to 100, where a higher score indicates a higher workload.
-
NASA-RTLX: the NASA Raw TLX scores for a given scenario, ranging from 0 to 100, where a higher score indicates a higher workload.
-
mentalDemand: scores of the mental demand sub-dimension, ranging from 0 to 100. The higher the score, the greater the mental burden perceived by the driver during a given scenario.
-
physicalDemand: scores of the physical demand sub-dimension, ranging from 0 to 100. A higher score corresponds to the more physical activity felt by the drivers for a given scenario.
-
temporalDemand: scores of the temporal demand sub-dimension, ranging from 0 to 100. A higher score indicates that the driver feels more time pressure for a given scenario.
-
performance: scores of the performance sub-dimension, ranging from 0 to 100. A higher score indicates that the driver feels more satisfied with their performance during a given scenario.
-
effort: scores of the effort sub-dimension, ranging from 0 to 100. A higher score corresponds to the driver’s greater physical and mental effort in a given scenario.
-
frustration: scores of the effort sub-dimension, ranging from 0 to 100. A higher score indicates that the driver feels more stressed during a given scenario.
-
weightOfMentalDemand: the number of times (ranging from 0 to 5) the mental demand sub-dimension is considered more important than other sub-dimensions in a pairwise comparison.
-
weightOfPhysicalDemand: the number of times (ranging from 0 to 5) the physical demand sub-dimension is considered more important than other sub-dimensions in a pairwise comparison.
-
weightOfTemporalDemand: the number of times (ranging from 0 to 5) the temporal demand sub-dimension is considered more important than other sub-dimensions in a pairwise comparison.
-
weightOfPerformance: the number of times (ranging from 0 to 5) the performance sub-dimension is considered more important than other sub-dimensions in a pairwise comparison.
-
weightOfEffort: the number of times (ranging from 0 to 5) the effort sub-dimension is considered more important than other sub-dimensions in a pairwise comparison.
-
weightOfFrustration: the number of times (ranging from 0 to 5) the frustration sub-dimension demand is considered more important than other sub-dimensions in a pairwise comparison.
Physiological data
The physiological responses of the drivers measured with the H10 chest band and the E4 wristband have been separately provided as CSV files for each sensing modality. These CSV files are placed in the sub-directories of driver identifiers and secondary task types in the same manner as the takeover scenario information. Every CSV file contains a common field named timestamp, indicating the timestamp (in milliseconds) at which a given reading was recorded, starting from 0 milliseconds at the beginning of each scenario. For improved readability, the data fields excluding the timestamp are discussed further:
-
ECG.csv: electrical activity in the hearts of the driver, collected using the Polar H10 chest band at a sampling frequency of 130 Hz.
-
value: ECG signals in millivolt (mV).
-
-
HR.csv: the heart rate of the driver, measured using the Polar H10 chest band at a sampling rate of 1 Hz.
-
value: number of heartbeats per minute (b/min).
-
-
PPG.csv: blood volume pulse (BVP) of the driver, optically obtained using the Empatica E4 wristband PPG sensor with a sampling frequency of 64 Hz.
-
value: BVP signals in nanowatt (nW).
-
-
EDA.csv: skin resistance of the driver, recorded using the Empatica E4 wristband sampled at 4 Hz.
-
value: skin resistance in microsiemens (µS).
-
Ocular data
The ocular responses of the drivers measured using the Pupil Core have been separately provided as CSV and video files. These files are placed in the sub-directories of driver identifiers and secondary task types in the same manner as the takeover scenario information. Every CSV file contains a common field named timestamp, indicating the timestamp (in milliseconds) at which a given reading was recorded, starting from 0 milliseconds at the beginning of each scenario. For improved readability, the data fields excluding the timestamp are discussed further:
-
diameters.csv: average pupil diameter of the driver, calculated from videos of both eyes at a sampling frequency of 200 Hz.
-
value: pupil diameter in millimeters.
-
-
gazePositions.csv: average gaze position of the driver, calculated from videos of both eyes at a sampling frequency of 200 Hz.
-
gazeAngle: the angle in degrees, indicating the difference between the optical axis (the gaze point when looking straight ahead) and the current gaze point. Figure 9 shows the method of gaze angle calculation in a coordinate system.
Fig. 9 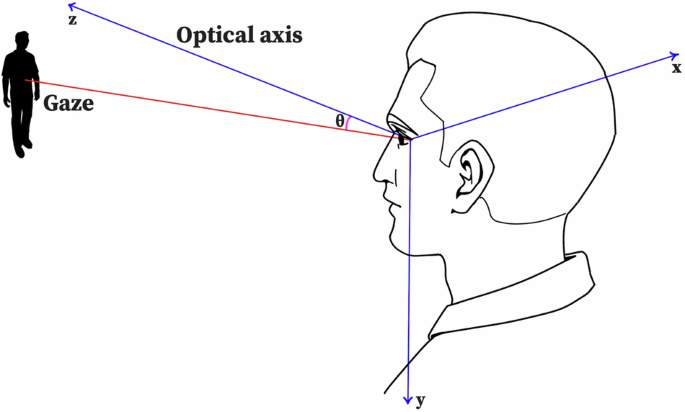
Descriptive image of gaze. θ represents the gazeAngle, which is the angle between the gaze point and the optical axis (the gaze point when looking straight ahead). The z-axis coincides with the optical axis. The x-axis represents the horizontal direction, with the positive direction to the right. The y-axis represents the vertical direction, with the positive direction downward.
-
gazeAngleX: the angle in degrees representing the horizontal difference between the optical axis and the current gaze point. When the value is greater or less than zero, it indicates looking to the right or left, respectively.
-
gazeAngleY: the angle in degrees representing the vertical difference between the optical axis and the current gaze point. When the value is greater or less than zero, it indicates looking downward or upward, respectively.
-
-
fixations.csv: the driver’s visual fixation calculated from multiple gazes pointing to one place. As the eyes move slightly while maintaining a single fixation, subtle differences exist in the gaze within the same fixation.
-
fixationAngle: the angle in degrees indicating the difference between the fixation point of looking straight ahead and the current fixation point. The fixation point is calculated by averaging gaze points within the same fixation.
-
fixationAngleX: the angle in degrees representing the horizontal difference between the fixation point of looking straight ahead and the current fixation point. When the value is greater or less than zero, it indicates looking to the right or left, respectively.
-
fixationAngleY: the angle in degrees representing the vertical difference between the fixation point of looking straight ahead and the current fixation point. When the value is greater or less than zero, it indicates looking downward or upward, respectively.
-
dispersion: dispersion of fixation in degrees indicates the angular difference between the two gaze points that are the furthest apart within the same fixation.
-
duration: fixation duration in milliseconds (ms) represents differences in timestamps between the first and last gazes within the same fixation.
-

Eye video
-
eye_left.mp4: this file contains the videos of the driver’s left eyeball in grayscale.
-
eye_right.mp4: this file contains the videos of the driver’s right eyeball in grayscale.
Technical Validation
Takeover performance and workload
Tables 4, 5 show overviews of the takeover performance (success ratio and average reaction time) and perceived workload data collected from 50 drivers across 10 secondary task conditions. Specifically, Table 4 presents the descriptive statistics of the takeover performance and workload across the secondary task conditions, while Table 5 presents the descriptive statistics of takeover performance and workload across secondary task conditions by age group.
Furthermore, we conducted two mixed-model analyses to explore the variations in takeover performance across age groups and secondary task conditions. For each analysis, we used the reaction time and takeover success as dependent variables, respectively. For both analyses, we consistently included age groups, secondary task conditions, and their interaction effects as fixed effects, and the drivers as the random effect. We performed linear regression analysis for reaction time and binary logistic regression analysis for takeover success.
For the reaction times, the mixed-model analysis revealed no significant main effect of age group. However, secondary task conditions such as auditory texting (β = 135.92, t = 2.213, p = 0.027), e-book reading (β = 413.32, t = 6.728, p < 0.001), gaming (β = 431.26, t = 7.020, p < 0.001), and texting (β = 471.60, t = 7.677, p < 0.001) resulted in significantly longer reaction times compared to the baseline condition. In addition, the gaming and texting conditions exhibited significant interaction effects with age groups. Specifically, reaction time significantly increased as the age group increased for gaming (β = 449.68, t = 3.274, p = 0.001) and texting (β = 310.50, t = 2.260, p = 0.024).
For takeover success, the mixed-model analysis revealed no significant main effect of age group. However, secondary task conditions such as e-book reading (β = −3.02, z = −5.126, p < 0.001) and texting (β = −2.76, z = −4.788, p < 0.001) significantly decreased takeover success probabilities compared to the baseline condition. No interaction effects between secondary task condition and age group were detected. These results demonstrate that driver takeover performance varies across secondary task conditions and age groups. Importantly, our dataset effectively captures these differences, providing a valuable resource for analyzing variations in takeover performance related to demographics and secondary tasks.
Machine-learning analysis
To ensure that our dataset is technically convincing, we conducted a machine-learning analysis where our machine-learning models used features extracted from physiological and ocular sensor data as inputs and predicted whether the takeover was successful.
Machine learning pipeline
To construct the models, we encompassed the entire process of building and evaluating machine-learning models by referring to the machine-learning pipeline proposed in a prior study on affective and cognitive computing with multimodal sensor data53 (see Fig. 10). First, we screened out participants with missing data for any of the sensing modalities. For the remaining participants’ data, we extracted various features from sensor readings recorded within a 10-second window immediately before critical events occurred. These features were subsequently paired with the takeover result (i.e., success vs. failure) for a given critical event. The models were trained and evaluated using leave-one-subject-out (LOSO) cross-validation (CV). More detailed processes are presented below.

Machine learning pipeline of the TD2D dataset.
Preprocessing
Before building the machine learning models, we excluded participants with missing data for sensing modalities. Throughout the careful investigation, we excluded data collected from 11 of the 50 participants for the following reasons: eight participants (D1, D11, D15, D18, D23, D36, D43, and D46) had missing data in the H10 chest band, and three participants (D6, D41, and D47) had missing data in the E4 wristband. The following machine learning analysis was conducted on the remaining data from 390 experimental scenarios (256 scenarios resulting in takeover successes) of the 39 participants, with ten scenarios per participant.
Feature extraction
For each experimental scenario, we extracted features from sensor data recorded within a 10-second window immediately before the timestamp of critical event occurrence (which is presented in the field named criticalEventOccurrenceTime in takeoverScenarioInformations.csv). We considered 13 different sensing modalities in the feature extraction, as follows: ECG (the field, value, in ECG.csv), PPG (the field, value, in PPG.csv), EDA (the field, value, in EDA.csv), HR (the field, value, in HR.csv), pupil diameter (the field, value, in diameter.csv), eye gaze (the fields, gazeAngle, gazeAngleX, and gazeAngleY, in gazePositions.csv), eye fixation (the fields, fixationAngle, fixationAngleX, fixationAngleY, duration, and dispersion, in fixations.csv). For each modality, we calculated five features reflecting statistical distributions within the sensor data of the 10-second window, including the minimum, maximum, mean, skewness, and kurtosis, resulting in a total of 65 features.
Training and cross-validation
We conducted a LOSO cross-validation to ensure applicability to drivers that were not included in our dataset. In this CV, samples (i.e., features and takeover successes) from one driver were assigned to a testing fold, and samples from the others were assigned to a training fold. The machine learning models were trained with samples within the training fold and evaluated with samples within the testing fold. This process was repeated 39 times, and each driver sample was used to evaluate machine-learning models. Each training process began by balancing the label distributions because the number of takeover successes was greater than the number of takeover failures (256 vs. 134). Such an imbalanced distribution may reduce the capability of predicting the minority class (i.e., takeover failures in our data). To mitigate the issue, we oversampled samples belonging to the minority class in the training fold using the synthetic minority over-sampling technique (SMOTE), which generated new samples that were similar to the existing samples. We selected 20 out of 65 features by eliminating relatively unnecessary features using recursive feature elimination (RFE) to mitigate overfitting.
For the type of machine learning models, we considered subject-independent models, which are trained on data from multiple individuals to capture generalizable patterns applicable across diverse populations. For example, in the context of machine learning models for vehicles, such models are trained on data collected from multiple drivers, excluding data from the driver of the specific vehicle. For the algorithms of the models. we considered ensemble-learning algorithms, including Random Forest54, XGBoost55, and LightGBM56. These algorithms are widely used to predict takeover performance and situation awareness in distracted automated driving contexts57,58,59. In addition, we also considered the multi-layer perceptron (MLP) model60 as the neural network60. The trained models were evaluated using the testing fold, accompanied by various performance metrics, including F1-scores for the minority and majority classes, the average of both F1-scores (i.e., the macro-averaged F1-score), and accuracy.
Performance evaluation
The performance of the three machine learning models and one neural network model are listed in Table 6. The Random Forest model showed the best performance, achieving a macro-averaged F1-score of 0.59 and an accuracy of 0.68. The performances were followed by LightGBM with a macro-averaged F1-score of 0.54 and an accuracy of 0.67, XGBoost with 0.53 and 0.63, and MLP with 0.47 and 0.63, respectively. While we did not conduct significant feature engineering or use eye video data, such a performance evaluation showed that our TD2D dataset holds sufficient potential for developing machine learning models focusing on takeover performance prediction.
Usage Notes
Potential applications
The TD2D dataset is intended to support researchers in understanding, analyzing, and predicting takeover performance while distracted L2 driving by utilizing the workload score through NASA-TLX, physiological data such as ECG, PPG, EDA, heart rate, and ocular data including the gaze, fixation, pupil diameter, and eye video. We expect the TD2D dataset to be useful for research in the context of L2 automated driving contexts. For example, similar to what we have shown through technical validation, it can help predict takeover performance using the driver’s physiological data and ocular data57 or analyze the relationship between the driver’s physiological data and workload61. In addition, it can be utilized to analyze whether a driver is visually distracted through ocular data. For example, by analyzing the gaze data, Louw et al. found that drivers prioritized secondary tasks over driving situations, even though L2 automated driving was unstable owing to heavy fog62.
In addition, we expect the TD2D dataset to be useful for research besides L2 automated driving contexts. For example, contexts in which individuals must continuously monitor automated systems, such as city traffic control centers, cement control centers, and power plant control centers, are similar to the contexts in which drivers need to monitor driving situations continuously during L2 automated driving. Therefore, the TD2D dataset can be valuable for analyzing the relationship between the physiological data and the workload of the operator monitoring such a system63. Moreover, contexts in which workers face interruptions during ongoing tasks, including receiving emails and talking with co-workers, are similar to contexts in which drivers are interrupted by critical events while performing secondary tasks. Therefore, the TD2D dataset can be used to analyze whether workers are interruptible by another task using physiological and takeover data64.
The TD2D dataset includes driver data of various populations, making it a valuable resource for developing subject-independent machine learning models. These models are trained on data from multiple drivers to capture overarching patterns that are broadly applicable across diverse populations. These models are particularly useful for addressing cold-start scenarios where individual-specific data of a driver is unavailable, for instance, when a driver first purchases the vehicle. Subject-dependent models, trained exclusively on data from a single driver, are capable of capturing personalized patterns and preferences of the driver, thereby achieving higher accuracy for the driver compared to subject-independent models. Subject-independent machine learning models can serve as initial models to avoid cold-start scenarios. Furthermore, as the driver’s individual-specific data accumulates, the models can transition into subject-dependent models through machine learning techniques such as transfer learning.
Limitations
We fixed the weather conditions and traffic in our driving environment, which led to limitations in understanding the differences in the driver’s state owing to these environmental changes. Previous studies have indicated that an increase in other vehicles on the road escalates the driving workload65, and adverse weather conditions deteriorate takeover performance66. Nevertheless, our dataset was collected under consistently fixed weather and traffic conditions, making it suitable for analyzing variations in the states of drivers performing different secondary tasks. In addition, although only one secondary task was performed at a time under our experimental conditions, drivers in real-world scenarios may engage in multiple tasks simultaneously while driving. For instance, a driver may engage in visual-manual texting while simultaneously listening to an audiobook. However, our dataset can still be used to investigate the relationship between each secondary task to driver distraction67. Next, since our data was collected using a simulator, it may not fully reflect the complexity of real-road driving conditions. However, simulator-based data for distracted driving research offer several advantages over real-road data, including better control of conditions, greater sensitivity to secondary task conditions, and reduced measurement error33. Given these advantages, our dataset remains a valuable resource for studying distracted driving, similar to previous simulator-based datasets27,29,30,31. Finally, our data were insufficient for training robust subject-dependent models due to the limited number of conditions per driver (i.e., 10 cases per driver). However, the dataset included data from a wide range of populations and various secondary task conditions, allowing for the development of subject-independent models applicable across diverse populations and various scenarios. Moreover, a subject-independent model trained on our dataset can be deployed in cold-start scenarios and later refined into subject-dependent models as driver-specific data accumulate, using techniques such as transfer learning.
Code availability
Our technical validation process was included a Jupyter notebook, which available at https://github.com/HAI-lab-KNU/TD2D_SupplementaryCodes. In addition, our simulator codes are also available at https://github.com/HAI-lab-KNU/L2-vehicle-simulator.
References
Huemer, A. K. & Vollrath, M. Driver secondary tasks in germany: Using interviews to estimate prevalence. Accid. Analysis & Prev. 43, 1703–1712, https://doi.org/10.1016/j.aap.2011.03.029 (2011).
Huemer, A. K., Schumacher, M., Mennecke, M. & Vollrath, M. Systematic review of observational studies on secondary task engagement while driving. Accid. Analysis & Prev. 119, 225–236, https://doi.org/10.1016/j.aap.2018.07.017 (2018).
Metz, B., Landau, A. & Just, M. Frequency of secondary tasks in driving – results from naturalistic driving data. Saf. Sci. 68, 195–203, https://doi.org/10.1016/j.ssci.2014.04.002 (2014).
Google. Google assistant is integrated with android auto and compatible cars. Google (2024).
Group, M.-B. Mercedes-benz takes in-car voice control to a new level with chatgpt. Mercedes-Benz Group (2023).
team, A. Chatgpt in the automotive industry: Improving vehicle navigation. AIContentfy (2023).
Naujoks, F., Purucker, C. & Neukum, A. Secondary task engagement and vehicle automation – comparing the effects of different automation levels in an on-road experiment. Transp. Res. Part F: Traffic Psychol. Behav. 38, 67–82, https://doi.org/10.1016/j.trf.2016.01.011 (2016).
Wandtner, B., Schömig, N. & Schmidt, G. Secondary task engagement and disengagement in the context of highly automated driving. Transp. Res. Part F: Traffic Psychol. Behav. 58, 253–263, https://doi.org/10.1016/j.trf.2018.06.001 (2018).
Llaneras, R. E., Salinger, J. & Green, C. A. Human factors issues associated with limited ability autonomous driving systems: Drivers’ allocation of visual attention to the forward roadway. In Driving Assessment Conference, vol. 7, https://doi.org/10.17077/drivingassessment.1472 (University of Iowa, 2013).
Lyons, G. & Urry, J. Travel time use in the information age. Transp. Res. Part A: Policy Pract. 39, 257–276, https://doi.org/10.1016/j.tra.2004.09.004 Positive Utility of Travel (2005).
Jazayeri, A., Martinez, J. R. B., Loeb, H. S. & Yang, C. C. The impact of driver distraction and secondary tasks with and without other co-occurring driving behaviors on the level of road traffic crashes. Accid. Analysis & Prev. 153, 106010, https://doi.org/10.1016/j.aap.2021.106010 (2021).
Klauer, S. G. et al. Distracted driving and risk of road crashes among novice and experienced drivers. New Engl. J. Medicine 370, 54–59, https://doi.org/10.1056/NEJMsa1204142 (2014).
Stutts, J. et al. The causes and consequences of distraction in everyday driving. Annu. Proc Assoc Adv Automot Med 47, 235–251 (2003).
Hurts, K., Angell, L. S. & Perez, M. A. The distracted driver: Mechanisms, models, and measurement. Rev. Hum. Factors Ergonomics 7, 3–57, https://doi.org/10.1177/1557234X11410387 (2011).
Choudhary, P., Gupta, A. & Velaga, N. R. Perceived risk vs actual driving performance during distracted driving: A comparative analysis of phone use and other secondary distractions. Transp. Res. Part F: Traffic Psychol. Behav. 86, 296–315, https://doi.org/10.1016/j.trf.2022.03.001 (2022).
Strayer, D. L., Cooper, J. M., Turrill, J., Coleman, J. R. & Hopman, R. J. The smartphone and the driver’s cognitive workload: A comparison of apple, google, and microsoft’s intelligent personal assistants. Can. J. Exp. Psychol. 71, 93–110 (2017).
Support, T. Autopilot and full self-driving capability (2024).
committee, O.-R. A. D. O. Taxonomy and Definitions for Terms Related to Driving Automation Systems for On-Road Motor Vehicles, https://doi.org/10.4271/J3016_202104 (2021).
Council of European Union. Commission implementing regulation (EU) 2022/1426 (2022).
Blommer, M. et al. The effects of a scheduled driver engagement strategy in automated driving. Proceedings of the Human Factors and Ergonomics Society Annual Meeting 59, 1681–1685, https://doi.org/10.1177/1541931215591363 (2015).
Arkonac, S. E., Brumby, D. P., Smith, T. & Babu, H. V. R. In-car distractions and automated driving: A preliminary simulator study. In Proceedings of the 11th International Conference on Automotive User Interfaces and Interactive Vehicular Applications: Adjunct Proceedings, AutomotiveUI ’19, 346–351, https://doi.org/10.1145/3349263.3351505 (Association for Computing Machinery, New York, NY, USA, 2019).
Louw, T. et al. Engaging in ndrts affects drivers’ responses and glance patterns after silent automation failures. Transp. Res. Part F: Traffic Psychol. Behav. 62, 870–882, https://doi.org/10.1016/j.trf.2019.03.020 (2019).
Li, W. et al. A multimodal psychological, physiological and behavioural dataset for human emotions in driving tasks. Sci. Data 9, 481, https://doi.org/10.1038/s41597-022-01557-2 (2022).
Kopuklu, O., Zheng, J., Xu, H. & Rigoll, G. Driver anomaly detection: A dataset and contrastive learning approach. In Proceedings of the IEEE/CVF Winter Conference on Applications of Computer Vision (WACV), 91–100 (2021).
Chen, G. et al. Neuroiv: Neuromorphic vision meets intelligent vehicle towards safe driving with a new database and baseline evaluations. IEEE Transactions on Intell. Transp. Syst. 23, 1171–1183, https://doi.org/10.1109/TITS.2020.3022921 (2022).
Ortega, J. D. et al. Dmd: A large-scale multi-modal driver monitoring dataset for attention and alertness analysis. In Bartoli, A. & Fusiello, A. (eds.) Computer Vision – ECCV 2020 Workshops, 387–405 (Springer International Publishing, Cham, 2020).
Taamneh, S. et al. A multimodal dataset for various forms of distracted driving. Sci. Data 4, 170110, https://doi.org/10.1038/sdata.2017.110 (2017).
Weng, C.-H., Lai, Y.-H. & Lai, S.-H. Driver drowsiness detection via a hierarchical temporal deep belief network. In Chen, C.-S., Lu, J. & Ma, K.-K. (eds.) Computer Vision – ACCV 2016 Workshops, 117–133 (Springer International Publishing, Cham, 2017).
Tao, X. et al. A multimodal physiological dataset for driving behaviour analysis. Sci. Data 11, 378, https://doi.org/10.1038/s41597-024-03222-2 (2024).
Dargahi Nobari, K. & Bertram, T. A multimodal driver monitoring benchmark dataset for driver modeling in assisted driving automation. Sci. Data 11, 327, https://doi.org/10.1038/s41597-024-03137-y (2024).
Oppelt, M. P. et al. Adabase: A multimodal dataset for cognitive load estimation. Sensors 23, https://doi.org/10.3390/s23010340 (2023).
Zenodo https://doi.org/10.5281/zenodo.14185964 (2024).
Administration, N. H. T. S. et al. Visual-manual nhtsa driver distraction guidelines for in-vehicle electronic devices. Washington, DC: Natl. Highw. Traffic Saf. Adm. (NHTSA), Dep. Transp. (DOT) (2012).
Dosovitskiy, A., Ros, G., Codevilla, F., Lopez, A. & Koltun, V. CARLA: An open urban driving simulator. In Proceedings of the 1st Annual Conference on Robot Learning, 1–16 (2017).
MATLAB. Roadrunner scenario. MathWorks (2024).
Kassner, M., Patera, W. & Bulling, A. Pupil: An open source platform for pervasive eye tracking and mobile gaze-based interaction. In Adjunct Proceedings of the 2014 ACM International Joint Conference on Pervasive and Ubiquitous Computing, UbiComp ’14 Adjunct, 1151–1160, https://doi.org/10.1145/2638728.2641695 (ACM, New York, NY, USA, 2014).
Winter, J. D., Stanton, N., Price, J. & Mistry, H. The effects of driving with different levels of unreliable automation on self-reported workload and secondary task performance. Int. J. Veh. Des. 70, 297–324, https://doi.org/10.1504/IJVD.2016.076736 (2016).
Xie, F., Chen, T., Xia, Q., Huang, L. & Shu, H. Study on the controlled field test scenarios of automated vehicles. Tech. Rep., SAE Technical Paper (2018).
Siebert, F. W. & Wallis, F. L. How speed and visibility influence preferred headway distances in highly automated driving. Transp. Res. Part F: Traffic Psychol. Behav. 64, 485–494, https://doi.org/10.1016/j.trf.2019.06.009 (2019).
Mehler, B., Reimer, B. & Dusek, J. A. Mit agelab delayed digit recall task (n-back). Cambridge, MA: Mass. Inst. Technol. 17 (2011).
Mehler, B., Reimer, B., Coughlin, J. F. & Dusek, J. A. Impact of incremental increases in cognitive workload on physiological arousal and performance in young adult drivers. Transp. Res. Rec. 2138, 6–12 (2009).
Solovey, E. T., Zec, M., Garcia Perez, E. A., Reimer, B. & Mehler, B. Classifying driver workload using physiological and driving performance data: Two field studies. In Proceedings of the SIGCHI Conference on Human Factors in Computing Systems, CHI ’14, 4057–4066 (Association for Computing Machinery, New York, NY, USA, 2014).
Radlmayr, J., Gold, C., Lorenz, L., Farid, M. & Bengler, K. How traffic situations and non-driving related tasks affect the take-over quality in highly automated driving. Proc. Hum. Factors Ergonomics Soc. Annu. Meet. 58, 2063–2067 (2014).
Gold, C., Berisha, I. & Bengler, K. Utilization of drivetime – performing non-driving related tasks while driving highly automated. Proc. Hum. Factors Ergonomics Soc. Annu. Meet. 59, 1666–1670 (2015).
Kim, A., Choi, W., Park, J., Kim, K. & Lee, U. Interrupting drivers for interactions: Predicting opportune moments for in-vehicle proactive auditory-verbal tasks. Proc. ACM Interact. Mob. Wearable Ubiquitous Technol. 2 (2018).
Kim, A., Park, J.-M. & Lee, U. Interruptibility for in-vehicle multitasking: Influence of voice task demands and adaptive behaviors. Proc. ACM Interact. Mob. Wearable Ubiquitous Technol. 4 (2020).
Lee, A. M. C., Cerisano, S., Humphreys, K. R. & Watter, S. Talking is harder than listening: The time course of dual-task costs during naturalistic conversation. Can. J. Exp. Psychol. canadienne de psychologie expérimentale 71, 111–119 (2017).
Rann, J. C. & Almor, A. Effects of verbal tasks on driving simulator performance. Cogn. Res. Princ. Implic. 7, 12 (2022).
Horrey, W., Lesch, M. & Garabet, A. Dissociation between driving performance and drivers’ subjective estimates of performance and workload in dual-task conditions. J. Saf. Res. 40, 7–12, https://doi.org/10.1016/j.jsr.2008.10.011 (2009).
Amazon. Amazon.com: Alexa games: Alexa skills. Amazon (2024).
Eriksson, A. & Stanton, N. A. Takeover time in highly automated vehicles: Noncritical transitions to and from manual control. Hum. Factors 59, 689–705, https://doi.org/10.1177/0018720816685832 (2017).
Hart, S. G. & Staveland, L. E. Development of nasa-tlx (task load index): Results of empirical and theoretical research. In Hancock, P. A. & Meshkati, N. (eds.) Human Mental Workload, vol. 52 of Advances in Psychology, 139–183, https://doi.org/10.1016/S0166-4115(08)62386-9 (North-Holland, 1988).
Kang, S. et al. K-emophone: A mobile and wearable dataset with in-situ emotion, stress, and attention labels. Sci. Data 10, 351, https://doi.org/10.1038/s41597-023-02248-2 (2023).
Breiman, L. Random forests. Mach. Learn. 45, 5–32, https://doi.org/10.1023/A:1010933404324 (2001).
Chen, T. & Guestrin, C. Xgboost: A scalable tree boosting system. In Proceedings of the 22nd acm sigkdd international conference on knowledge discovery and data mining, KDD ’16, 785–794, https://doi.org/10.1145/2939672.2939785 (Association for Computing Machinery, New York, NY, USA, 2016).
Ke, G. et al. Lightgbm: A highly efficient gradient boosting decision tree. In Guyon, I. et al. (eds.) Advances in Neural Information Processing Systems, vol. 30 (Curran Associates, Inc., 2017).
Du, N. et al. Predicting driver takeover performance in conditionally automated driving. Accid. Analysis & Prev. 148, 105748, https://doi.org/10.1016/j.aap.2020.105748 (2020).
Ayoub, J., Du, N., Yang, X. J. & Zhou, F. Predicting driver takeover time in conditionally automated driving. IEEE Transactions on Intell. Transp. Syst. 23, 9580–9589, https://doi.org/10.1109/TITS.2022.3154329 (2022).
Zhou, F., Yang, X. J. & de Winter, J. C. F. Using eye-tracking data to predict situation awareness in real time during takeover transitions in conditionally automated driving. IEEE Transactions on Intell. Transp. Syst. 23, 2284–2295, https://doi.org/10.1109/TITS.2021.3069776 (2022).
Gardner, M. & Dorling, S. Artificial neural networks (the multilayer perceptron)—a review of applications in the atmospheric sciences. Atmospheric Environ. 32, 2627–2636, https://doi.org/10.1016/S1352-2310(97)00447-0 (1998).
Radhakrishnan, V. et al. Physiological indicators of driver workload during car-following scenarios and takeovers in highly automated driving. Transp. Res. Part F: Traffic Psychol. Behav. 87, 149–163, https://doi.org/10.1016/j.trf.2022.04.002 (2022).
Louw, T. & Merat, N. Are you in the loop? using gaze dispersion to understand driver visual attention during vehicle automation. Transp. Res. Part C: Emerg. Technol. 76, 35–50, https://doi.org/10.1016/j.trc.2017.01.001 (2017).
Fallahi, M., Motamedzade, M., Heidarimoghadam, R., Soltanian, A. R. & Miyake, S. Assessment of operators’ mental workload using physiological and subjective measures in cement, city traffic and power plant control centers. Heal. Promot. Perspect 6, 96–103, https://doi.org/10.15171/hpp.2016.17 (2016).
Züger, M. & Fritz, T. Interruptibility of software developers and its prediction using psycho-physiological sensors. In Proceedings of the 33rd Annual ACM Conference on Human Factors in Computing Systems, CHI ’15, 2981–2990, https://doi.org/10.1145/2702123.2702593 (Association for Computing Machinery, New York, NY, USA, 2015).
Hao, X. et al. The effect of traffic on situation awareness and mental workload: Simulator-based study. In Harris, D. (ed.) Engineering Psychology and Cognitive Ergonomics, 288–296 (Springer Berlin Heidelberg, Berlin, Heidelberg, 2007).
Li, S., Blythe, P., Guo, W. & Namdeo, A. Investigation of older driver’s takeover performance in highly automated vehicles in adverse weather conditions. IET Intell. Transp. Syst. 12, 1157–1165, 10.1049/iet-its.2018.0104. https://ietresearch.onlinelibrary.wiley.com/doi/pdf/10.1049/iet-its.2018.0104 (2018).
Wandtner, B., Schömig, N. & Schmidt, G. Effects of non-driving related task modalities on takeover performance in highly automated driving. Hum. Factors 60, 870–881, https://doi.org/10.1177/0018720818768199 PMID: 29617161 (2018).
Fridman, L., Langhans, P., Lee, J. & Reimer, B. Driver gaze region estimation without use of eye movement. IEEE Intell. Syst. 31, 49–56, https://doi.org/10.1109/MIS.2016.47 (2016).
Acknowledgements
This work was supported by the 2022 Research Grant from Kangwon National University and by Innovative Human Resource Development for Local Intellectualization program through the Institute of Information & Communications Technology Planning & Evaluation(IITP) grant funded by the Korea government(MSIT)(IITP-2025-RS-2023-00260267).
Author information
Authors and Affiliations
Contributions
J.H. and A.K. designed and managed the data collection. J.H., A.K., J.L. and W.C. analyzed the results and wrote the manuscript. J.L., W.K. and J.R. reviewed the manuscript.
Corresponding author
Ethics declarations
Competing interests
The authors declare no competing interests.
Additional information
Publisher’s note Springer Nature remains neutral with regard to jurisdictional claims in published maps and institutional affiliations.
Rights and permissions
Open Access This article is licensed under a Creative Commons Attribution-NonCommercial-NoDerivatives 4.0 International License, which permits any non-commercial use, sharing, distribution and reproduction in any medium or format, as long as you give appropriate credit to the original author(s) and the source, provide a link to the Creative Commons licence, and indicate if you modified the licensed material. You do not have permission under this licence to share adapted material derived from this article or parts of it. The images or other third party material in this article are included in the article’s Creative Commons licence, unless indicated otherwise in a credit line to the material. If material is not included in the article’s Creative Commons licence and your intended use is not permitted by statutory regulation or exceeds the permitted use, you will need to obtain permission directly from the copyright holder. To view a copy of this licence, visit http://creativecommons.org/licenses/by-nc-nd/4.0/.
About this article

Cite this article
Hwang, J., Choi, W., Lee, J. et al. A Dataset on Takeover during Distracted L2 Automated Driving. Sci Data 12, 539 (2025). https://doi.org/10.1038/s41597-025-04781-8
Received:
Accepted:
Published:
Version of record:
DOI: https://doi.org/10.1038/s41597-025-04781-8
