
Abstract
We present a dataset designed to advance non-intrusive human gait recognition using structural vibration. Structural vibrations, resulting from the rhythmic impacts of toes and heels on the ground, offer a unique, privacy-preserving gait recognition modality. We curated the largest dataset consisting of structural vibration signals from 100 subjects. Existing datasets in this domain are limited in scope, typically involving around ten participants and offering minimal exploration. To comprehensively investigate this modality, we recorded vibration signals across three distinct floor types—wooden, carpet, and cement—and at three different distances from a geophone sensor (1.5 m, 2.5 m, and 4.0 m), involving 40 and 30 participants, respectively. The dataset also includes video recordings of 15 individuals in an outdoor setting. Moreover, we recorded structural vibration signals of 15 people walking at three different speeds. Alongside the vibration data, we provide physiological details such as participant age, gender, height, and weight. The dataset contains over 96 hours of raw structural vibration data, along with additional interim and processed data. This dataset aims to address long-standing challenges in non-intrusive and privacy-preserving gait recognition, with potential applications in clinical analysis, elderly care and rehabilitation engineering.
Background & Summary
Structural vibration-based person identification is an emerging topic in the field of soft biometrics and medical technology1,2. As humans walk, our bodies exert an impact force on the ground, generating vibrations that propagate through the structure. These structural vibrations are unique to each individual as they depend on various factors such as height, weight, gait strides, stride length along with structural properties, and background noises3. Structural vibrations offer many advantages over existing methods, such as being low-cost, non-intrusive, less computationally complex, and free of privacy issues. Prior studies has established the potential of using structural vibration as behavioral biometrics1,2,4,5,6. However, such works relied on limited datasets, impeding the development of robust identification methods. Our research fills a crucial gap by compiling the first comprehensive dataset of 100 individuals, including task-specific sub-datasets totaling 96+ hours of structural vibration signals recorded with a single geophone.
During walking, our body apply forces to the ground or platform, which help us move forward and keep us balanced. These forces propagate through the structure as horizontal and vertical waves or vibrations3. Our work focuses on the vertical vibrations due to their unique individual characteristics1,5. As shown in Fig. 1, foot strikes (initial contact) generate higher frequency vibrations than lift-off (acceleration) due to the impulsive force during the strike. We extract the envelope of the signal, using Hilbert transform, to visualise the overall variation by subsiding the rapid oscillations2,7. This reveals a distinct pattern indicating cyclical changes in the signal corresponding to the phases of contact and acceleration. Early research has tried to model this structural vibration using deterministic force models4. In this study, we adopt a probabilistic perspective, assuming individuals do not produce exact identical force-time profiles. However, the walking pattern is similar over different space-time, and the wave profile will exhibit intrinsic and extrinsic randomness as a function of weight, height, structural properties, and background noise, among other factors1. Naturally, a substantial subject database is crucial for such robust statistical characterization. The impact force (kgms2 or Newton (N)) due to footstep impact on the ground is transmitted through the structure and recorded as a vibration signal by a geophone sensor (in Volt (V)). Thus, the recorded signal has induced properties of both the structure and the individual walking pattern. As shown in Table 1, early studies on person identification using structural vibrations focused on small datasets, typically involving around ten participants, to establish proof-of-concept1,2,4,5,6,8. These studies demonstrated that unique walking patterns could be recorded and classified through vibrations transmitted to supporting structures. However, data scarcity was a significant limitation, as large-scale experiments with humans were rarely conducted. Pressure plates and Inertial Measurement Units (IMUs) are prominent soft biometric modalities based on human movement9,10,11,12. Pressure plates capture the unique Ground Reaction Forces (GRFs) exerted by the foot during walking by being placed directly beneath it13,14,15. Pressure plates exhibit limitations due to their requirement for direct user interaction. Deployment often requires explicit user consent, hindering their applicability in scenarios demanding unobtrusive identification16. IMUs, often embedded in wearable devices, offer gait-based identification through their ability to track body movements9. IMU’s needs to be attached with the person’s body, which might lead to discomfort17. In contrast, structural vibration-based monitoring is non-intrusive and does not require direct body contact.

Visual depiction of data collection framework showcasing structural vibration signals, and signal envelope (Hilbert Transform) in outdoor environment.
The dataset is categorized into five primary components:
-
Person Identification: Raw structural vibration signals recorded from 100 individuals walking on a single floor.
-
Multi-Distance: Vibration data from 30 individuals walking at three specific distances—1.5 m, 2.5 m, and 4.0 m—from a geophone sensor to study signal variation with proximity.
-
Multi-Structure: Data from 40 individuals captured across three distinct floor surfaces: wooden, carpeted, and cemented, to analyze the effect of structural properties on vibration patterns.
-
Multi-Modal: Outdoor recordings from 15 participants using both a geophone and two synchronized cameras to support multi-modal analysis combining structural and visual cues.
-
Multi-Speed: Data from 15 individuals walking at three different speeds—slow (80-90 Steps/min), normal (90-120 Steps/min), and fast (120-140 Steps/min)—to study gait variations.
This diverse and extensive dataset, spanning over 96 hours, provides a foundational resource for the development and evaluation of algorithms in non-intrusive human gait recognition using structural vibrations.
Methods
Recording Setup
We collected structural vibration signals, with a single geophone for Multiple Indoor (A1, A2, A3, A5) and outdoor (A4) environment, along with two cameras. Figure 2 shows the images of geophone sensor, raspberry pi 3B+, and camera. Details are given below :
-
Geophone: A geophone is a sensor that converts the ground vibrations into voltage, which can be recorded by using any microcontroller or microprocessor having an analog-to-digital converter (ADC). We used geophone sensors with a sensitivity of 2.88 V/m/sec, and a gain of 10 was used for both indoor and outdoor environments. Vibration signals were recorded using a Logic sound card hat equipped with a 16-bit analog-to-digital converter (ADC) operating at a sampling rate of 8 kHz. The sound card interfaced with a Raspberry Pi 3B+, having 1 GB of RAM and 16 GB of storage via SD Card for indoor data (A1, A2, A3, and A5). For outdoor data (A4), a geophone sensor was interfaced with a Sony CXD5602 Spresense embedded micro-controller.
-
Single Board Computers: For indoor experiments (A1, A2, and A3, A5), we have used raspberry Pi 3B+ featuring BCM2837B0 64-bit ARM-based Cortex-A53 processor running at 1.4 GHz with 1 GB of RAM and 16 GB of storage via SD Card. The geophone sensor was interfaced with raspberry Pi 3B+ using a logic sound card hat equipped with a 16-bit analog-to digital converter (ADC) at a sampling rate of 8 KHz. In our outdoor experiments (A4.1), we used the Sony CXD5602 Spresense board. This board features an ARM Cortex-M4F processor with six cores running at 156 MHz and a 16-bit A/D conversion output. We opted for the Sony Spresense board due to its low power consumption—only 1 W (5 V @ 200 mA)—compared to the Raspberry Pi 3B+, which requires approximately 7.5 W (5 V @ 1.5 A). This energy efficiency makes the Sony Spresense board well-suited for outdoor data collection experiments. However, it has a limitation: it can only record signals at 16 KHz and 32 KHz. Therefore, we initially recorded vibrational signals at 16 KHz and subsequently downsampled the data to 8 KHz to maintain consistency with the indoor datasets.
-
Camera: For (A4.2) dataset, we have used 2 cameras that have a CMOS sensor (0.84667 cm) with 3 MP, 95° viewing angle, with frame rate of 20 fps. It supports Wi-fi protocol to remotely view the recorded video and save it to smartphone or cloud services.

Hardware Components: (a) Geophone sensor for capturing structural vibrations, (b) Raspberry Pi 3B+ board for data acquisition, and (c) Camera for outdoor data collection.
Statistical Attributes of the Dataset
The different statistical attributes of the dataset are given below:
-
Subjects: In this study, 100 participants, comprising 68 males and 32 females, aged between 20 to 60 years, took part. Figure 3 presents the age-wise distribution and weight-to-height ratio of the participants. Each participant was asked to wear flat-bottom shoes that would be comfortable for walking.
Fig. 3 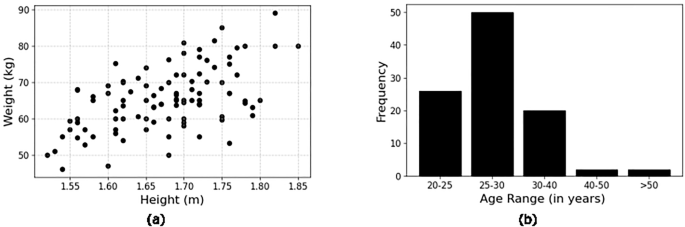
Distribution of Subjects in A1, (a) Height and weight distribution of the 100 participants, and (b) Age distribution of the participants in A1.
-
Anthropometrics: As shown in the Table 2, the participants’ heights vary from approximately 1.40 m to 1.90 m, and weights range from 40 kg to 90 kg. The dataset’s details regarding age, gender, height, and weight are available on the GitHub repository.
Table 2 Datasets Details and Characteristics. -
Data Collection Environment: Indoor and Outdoor data collection involves multiple 5-minute walking sessions for each participant between 11:00 AM and 6:00 PM.
-
Background Noise: The indoor datasets potentially include noise from typical building operations such as air conditioning. These temporal variations and noises reflect real-world conditions in a multi-functional building environment. Figures 4–7(c), clearly demonstrates the variation in noise distribution across different rooms and outdoor environment. Notably, the signal-to-noise ratio (SNR) exhibits dependence on the floor level, with ground floor locations typically having high SNR compared to the third floor. Additionally, we observed that the amplitude of the source signal exhibits an inverse relationship with distance from the sensor. As highlighted by Pan et al.1, footstep events predominantly occur within the 0-250 Hz frequency range. Applying band-pass filters within this range to the raw signal can further enhance the quality of event detection. To facilitate effective event extraction from the raw signals, we provide background noise recordings for each room.
Fig. 4 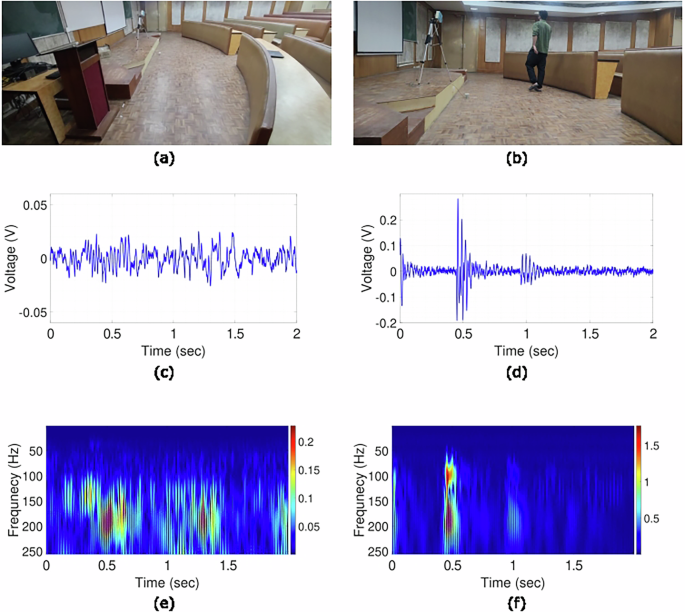
(a) Empty wooden floor room, (b) Participant walking in front of the sensor during data collection, (c) Raw noise signal acquired from the geophone sensor, (d) Raw vibration signal recorded during a participant’s walk, (e) Continuous Wavelet Transform (CWT) of the noise signal, (f) CWT of the walking signal, highlighting the transformed features.


Experimental protocol
Prior to data collection, participants were briefed for 5 minutes about the task to ensure clear understanding. They were asked to walk from a designated starting point (Point A) to another designated endpoint (Point B) at a natural pace, turn around at Point B, and then repeat the walk back to Point A. Each session lasted for five minutes, we conducted approximately 750 sessions. Participants were informed that they could stop and rest at any point during the session (if they feel uncomfortable); the recording would be paused and restarted upon resuming the walk. It is important to note that structural vibrations from non-human activities were not controlled. The walking area for all locations is maintained around 100 m2. The data collection process strictly adhered to the rigorous guidelines established by the Institutional Ethics Commitee (IEC). Ethical approval from the IEC, Indian Institute of Technology Delhi, was obtained (Ref. number IITD/IEC/P-059, date of approval: 13/09/2019). All participants provided written informed consent for data collection and sharing prior to participating in the study. The consent form explicitly explained that their data would be anonymized and shared publicly for research purposes. Participants were informed about the nature of the data being collected and how it would be used for gait recognition research.
Dataset Details
The dataset can be further used for different use-cases. The detail are as follows:
-
A1: Vibration signals were recorded from 100 individuals at a distance of 2.5 m-6.0 m from the sensor. Each individual has 20 minutes of recorded data, totaling 33.66 hours.
-
A2: Data from 30 individuals were collected on a cement floor at three distances from the sensor: 1.5 m (A2_1), 2.5 m (A2_2), and 4.0 m (A2_3). Each individual has 15 minutes of recorded data for each distances, totaling 22.5 hours.
-
A3: Data from 40 individuals were collected on wooden (A3_1), carpet (A3_2), and cement (A3_3) floors, at a distance of 2.5 m - 6.0 m from the sensor. Each individual has 20 minutes of data per floor, totaling 30 hours.
-
A4: Data from 15 individuals were recorded using a single geophone (A4_1) and two off-the-shelve cameras (left camera-A4_2a and right camera-A4_2b). Each individual has 10 minutes of recorded data, totaling 2.5 hours.
-
A5: Data from 15 participants (11 males and 4 females) to incorporate different walking speeds: slow A5_1 (80-90 SPM), normal A5_2 (90-120 SPM), and fast A5_3 (120-140 SPM). This experiment yielded 7.5 hours of data. Participants walked to metronome beats for the slow and fast speeds, while walking at their natural pace for the normal category.
Location Details
-
Wooden Floor: The data collection environment is a classroom on the ground floor with wooden floors. This room is used for data collection of dataset A1, A3_1, A5. Figure 4 shows a photo of the room, a sample of noise distribution within the room, and a visualization of data collected from a walking person.
-
Carpet Floor: The room is a conference room on the ground floor with carpeted flooring surrounded by concrete. The thickness of the carpet is 9mm. The room is furnished with chairs and a table. This room is used for data collection of dataset A3_2, where 40 person walked for 15 minutes each. The Fig. 5 illustrates the data collection setup for A3.2, including a room photo, noise distribution sample, and walking person data visualization.
Fig. 5 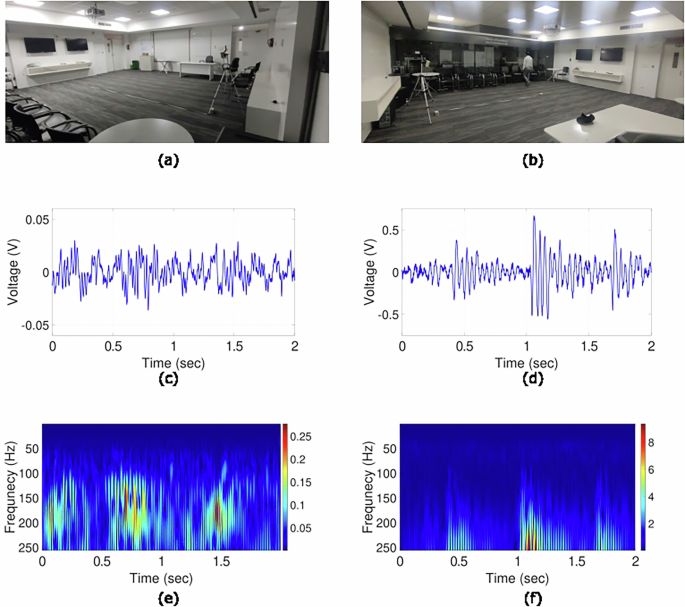
(a) Empty carpet floor room, (b) Participant walking in front of the sensor during data collection, (c) Raw noise signal acquired from the geophone sensor, (d) Raw vibration signal recorded during a participant’s walk, (e) Continuous Wavelet Transform (CWT) of the noise signal, (f) CWT of the walking signal, highlighting the transformed features.
-
Cement Floor: The room is a research lab on the third floor of a multi-storied building, covered in tiles. It is an active research lab with regular activities occurring in the background. This room is used for data collection of datasets A3_3 and A2 (1.5 m, 2.5 m, and 4.0 m). Figure 6 shows a photo of the room, a sample of the noise distribution within the room, and a visualization of data collected from a walking person.
Fig. 6 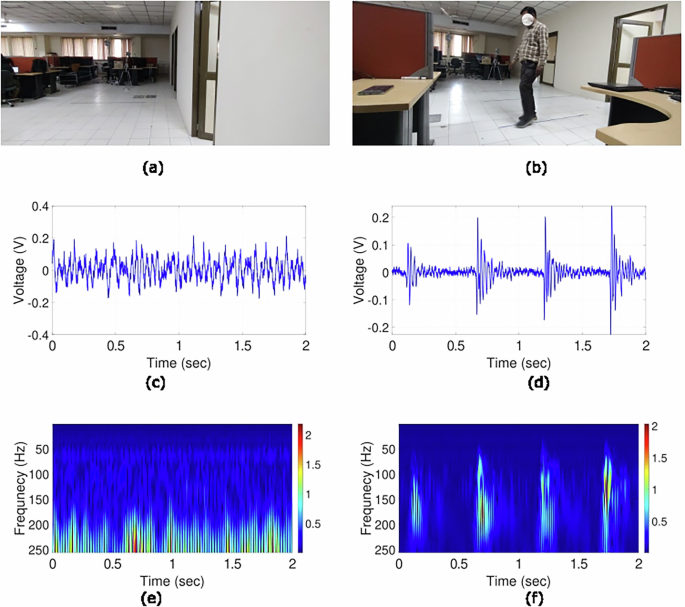
(a) Empty cement floor room, (b) Participant walking in front of the sensor during data collection, (c) Raw noise signal acquired from the geophone sensor, (d) Raw vibration signal recorded during a participant’s walk, (e) Continuous Wavelet Transform (CWT) of the noise signal, (f) CWT of the walking signal, highlighting the transformed features.
-
Outdoor Ground: The data collection environment is an open outdoor playground where the vibration signals of 15 individuals were recorded. Due to the open nature of the space, extraneous noise from activities such as people walking, running, and playing cricket was unavoidable. Open ground is used for data collection of two modalities, structural and vision based; the structural based vibration collected data named as A4_1 and vision based collected data is used to formulate A4_2. Figure 7 shows the location setup, a sample of noise distribution and a visualization of data collected from a walking person.
Fig. 7 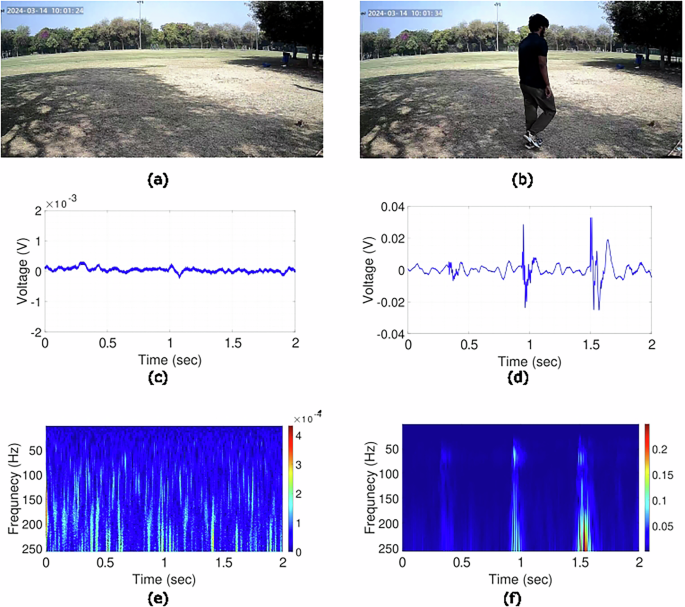
(a) Empty outdoor ground, (b) Participant walking in front of the sensor during data collection, (c) Raw noise signal acquired from the geophone sensor, (d) Raw vibration signal recorded during a participant’s walk, (e) Continuous Wavelet Transform (CWT) of the noise signal, (f) CWT of the walking signal, highlighting the transformed features.


Data Pre-processing
We processed our data using standard method2, which uses Gaussian Mixture Model-based clustering to extract footstep events based on both statistical features (skewness and kurtosis) and spectral features based on energy bins. We take a rolling window of 375 ms and calculate 134 features. After preprocessing, we structured the dataset based on footstep events, grouping them so that each row represents one sample. As shown in the Fig. 8, we converted the extracted footstep events to 2-D time-frequency images using Continuous Wavelet Transform to focus on the changes in energy distribution, which is unique for each and every individual6. We use the Mask R-CNN model (pre-trained on the ImageNet dataset) to detect humans within each image frame, allowing us to isolate the human silhouettes from the background18. This step ensures that the image is normalized based on the extracted silhouette, focusing solely on the relevant body region for gait analysis. Finally, for processed files we formulate the Gait Energy Images (GEIs) by merging the gait cycle images. This consistent size ensures compatibility during subsequent processing and analysis.

Data Processing Steps: (a) Raw vibration signal acquired from the geophone sensor. (b) Pre-processed signal after noise reduction and event segmentation. (c) Extracted events converted into a CWT image for further analysis.
Data Records
The dataset is publicly hosted on the Open Science Forum portal (Reference Number : VPWCZ)19. As shown in Fig. 9, it is organized into three stages: raw, interim, and processed. The corresponding folder and file naming conventions are summarized in Table 3. A detailed breakdown is provided below. Figure 10 highlights the file structure arrangements.

Data Structure Overview: The dataset is organized into three sub-categories—‘raw,’ ‘interim,’ and ‘processed.’ Each category is further divided by use-case (A1 - A5), containing recordings, events, Silhouettes, and spectrograms, respectively.

Overview of the code repository structure. The repository includes the Demographic Details folder containing participant demographic data, and the event detection folder comprising MATLAB scripts and related functions. Additional files include README.md for usage instructions, requirements.txt for dependencies, and specmeaker.py for signal processing utilities.
Raw data
The A1 Dataset is structured to contain one folder for each individual, with folder names labeled as P1, P2, up to P100. Each folder includes at least 4 .mat files, where each file represents 5 minutes of vibration data. The file naming convention follows the pattern FolderName_FileNumber, such as P1_1.mat and P1_2.mat. The A2 Dataset contains three folders representing different distances from the geophone sensor: A2_1 (1.5 m), A2_2 (2.5 m), and A2_3 (4.0 m). Each folder has subfolders for individual participants, labeled as P1, P2, up to P30, with each subfolder containing at least 3 .mat files, where each file represents 5 minutes of vibration data and follows the same naming convention. The A3 Dataset consists of three folders corresponding to different floor types: A3_1 (Wooden), A3_2 (Carpet), and A3_3 (Cement). Similar to A2, each folder includes subfolders for individual participants (P1, P2, to P40), with each subfolder containing at least 3 .mat files representing 5 minutes of vibration data and named using the same convention. The A4 Dataset contains contains subfolders for each participant (P1, P2, to P15). In A4_1, each subfolder contains one .mat file representing 10 minutes of vibration data, named using the same convention. The A5 Dataset captures vibration data of participants walking at different speeds and is structured into three main folders. The folder A5_1 contains data of participants walking at a fast speed (120–140 steps per minute), A5_2 includes data of participants walking at their normal pace (90–120 steps per minute), and A5_3 stores data of participants walking at a slow speed (80–90 steps per minute). Each folder is organized into subfolders for individual participants, labeled as P1, P2, up to P15. Each subfolder contains at least 2 .mat files, where each file represents 5 minutes of vibration data corresponding to the specified walking speed. The file naming convention follows the format FolderName_FileNumber, such as P1_1.mat and P1_2.mat.
Interim Data
The interim datasets (A1–A5) are provided as single .mat files, such as A1.mat, A2.mat, and A3.mat, where each file contains individual samples represented as rows. Each row consists of 1,500 data-points capturing the characteristics of a single footstep event and an associated target label or person_id. The structure of each file is as follows:A1.mat contains data with a shape of (samples, 1501), where columns 0–1499 correspond to the features, and column 1500 represents the person_id, ranging from 1 to 100. Similarly, the dataset A2_1.mat includes data with a shape of (samples, 1501), where the person_id ranges from 1 to 30 for participants walking at 1.5m, and the corresponding features are stored in columns 0–1499. The structure is the same for A2_2.mat and A2_3.mat, which contain data for participants at 2.5m and 4.0m, respectively. For A3_1.mat, the data shape is (samples, 1501), with participants walking on a Wooden floor. The person_id ranges from 1 to 40, while the features occupy columns 0–1499. Similarly, A3_2.mat and A3_3.mat represent data for participants walking on Carpet and Cement floors, respectively. The interim dataset A4_1.mat captures vibration data on Wooden floors, with each row containing 1,500 features and the person_id ranging from 1 to 15. A4_2a and A4_2b store .jpg files of human silhouettes captured from Right and Left cameras, organized similarly, with person_id values from 1 to 15. Finally, the A5_1.mat, A5_2.mat, and A5_3.mat files contain samples corresponding to participants walking at fast, normal, and slow speeds. Each row includes 1,500 features in columns 0–1499 and the person_id ranging from 1 to 15, capturing the vibration characteristics for different walking paces.
Processed Data
The processed data (A1-A5) is organized into folders named (A1-A5), with each directory containing subdirectories that store CWT images (224 × 224) in .jpg format for individual events. The structure of each dataset is as follows: The A1 folder includes subdirectories labeled as P1, P2, up to P100. For the A2 dataset, the folder is divided into three subdirectories: A2_1, A2_2, and A2_3, each containing participant-specific subfolders labeled P1, P2, up to P30. Similarly, the A3 dataset is organized into subfolders A3_1, A3_2, and A3_3, each with participant directories ranging from P1 to P40. The A4_1 dataset is split into subdirectories with each subfolder containing participant-specific directories labeled P1, P2, up to P15. Lastly, the A5 dataset consists of three subdirectories: A5_1, A5_2, and A5_3, with subfolders for each participant named P1, P2, up to P15.
Technical Validation
Before each data acquisition session, we calibrated the sensor to ensure its reliability in detecting ground vibrations in the given environment. Participant walked 30 steps in 30 seconds, matching their pace to a metronome set at 60 beats per minute. Participant walked directly away from the sensor, eventually moving beyond its sensing range (approximately 6-10 meters). We processed the recorded vibration signals with a peak detection algorithm to identify individual footstep events. The algorithm first applied a 50 ms moving average filter to smooth the signal, then detected steps using a minimum peak height of 0.022. It reported the total number of detected steps, offering a straightforward and effective method for extracting step patterns from normalized vibration signal. Over 250 days of recordings, spanning 750 sessions, the algorithm detected footstep peaks with an error rate of just 0.003, showing high accuracy even beyond the typical sensing range. We began with a controlled footstep test to evaluate the sensor’s response to low-frequency, periodic vibrations generated by human movement. Figure 11 shows a representative structural vibration signal from one session. To maintain data quality, we established a twofold non-seismic buffer zone around the recording area and prohibited all concurrent human activity during data acquisition. We validated the dataset using established protocol2. We report the average accuracy across multiple datasets. While our current work does not introduce a new methodology, it ensures reproducibility and facilitates benchmarking through publicly available code and results. Detailed experimental results, including discussions on validation metrics and performance across varying environments and users, can be accessed via our github repository: https://github.com/Mainak1792/Terra. The geophone-based data collected are available in raw, interim and processed formats, using well-established de-noising and normalization procedures2,6. This provides flexibility for future researchers to either utilize the raw data and apply their own post-processing methods or directly work with the ready-to-use post-processed data. To evaluate data integrity, the post-processed data have been plotted for visualization in Fig. 12.

Vibrational signal with detected footsteps. Red dots mark peaks from synchronized walking at 60 BPM.

This image depicts vibration signal from three individuals collected from wooden floor: (a) Person 1, (b) Person 50, and (c) Person 100. The corresponding CWT images for each person’s footprint are shown in (d), (e), and (f) respectively.
Usage Notes
Alongside our datasets, we provide starter codes to facilitate loading in both MATLAB and Python environments. The datasets are structured into raw, interim, and processed forms, allowing researchers to selectively utilize them based on specific use cases and research objectives. Raw datasets are ideal for developing novel signal processing algorithms and techniques for distinguishing human-generated signals from noise. Interim datasets, which consist of footstep events, provides a foundation for directly developing use-case wise problems and classification algorithms. Lastly, processed datasets in the form of Continuous Wavelet Transform images support deep learning based applications. Alternatively users can use their own strategy to develop methods better suited for their problem statement (i.e. domain adaptation, multi-modal gait recognition, gait abnormality, biomechanical analysis etc.). This tiered data structure enables flexibility in method development and application across a range of signal processing and analysis scenarios.
Code availability
We have provided starter codes in the Open Sciene Forum19 and github repository. All data processing procedures described in this paper were performed using MATLAB R2022b and Python 3.9.13. As shown in Fig. 10, code File Structure includes two sub-folders—Demographic_Details and event_detection—along with README.md, requirements.txt, and specmeaker.py files. The Demographic_Details folder contains statistical details for each sub-dataset. The event_detection folder includes essential MATLAB code files for extracting time-frequency events from the vibration signal. All our processed datasets can be easily loaded to train models, and hosting site automatically generates a croissant metadata file. Each dataset is labelled and annotated. Complete metadata records for raw data and code are found at https://github.com/Mainak1792/Terra.
References
Pan, S. et al. Footprintid: Indoor pedestrian identification through ambient structural vibration sensing. Proceedings of the ACM on Interactive, Mobile, Wearable and Ubiquitous Technologies 1(3), 1–31, https://doi.org/10.1145/3130954 (2017).
Anchal, S., Mukhopadhyay, B. & Kar, S. Person identification and imposter detection using footstep generated seismic signals. IEEE Transactions on Instrumentation and Measurement 70, 1–11, https://doi.org/10.1109/TIM.2020.3022486 (2020).
Succi, G. P., Prado, G., Gampert, R., Pedersen, T. K. and Dhaliwal, H. Problems in seismic detection and tracking. In Unattended Ground Sensor Technologies and Applications II, volume 4040, pages 165–173. SPIE, https://doi.org/10.1117/12.392572 (2000).
Mirshekari, M., Fagert, J., Bonde, A., Zhang, P. and Young Noh, H. Human gait monitoring using footstep-induced floor vibrations across different structures. In Proceedings of the 2018 ACM international joint conference and international symposium on pervasive and ubiquitous computing and wearable computers, pages 1382–1391, https://doi.org/10.1145/3267305.3274187 (2018).
Dong, Y. and Young Noh, H. Structure-agnostic gait cycle segmentation for in-home gait health monitoring through footstep-induced structural vibrations. In Society for Experimental Mechanics Annual Conference and Exposition, pages 65–74. Springer, https://doi.org/10.1007/978-3-031-36663-5_8 (2023).
Xu, X., Deng, R., Zhao, G., Zhang, B. & Liu, C. Deep domain generalization-based indoor pedestrian identification using footstep-induced vibrations. IEEE Transactions on Instrumentation and Measurement 73, 1–8, https://doi.org/10.1109/TIM.2024.3351227 (2024).
Cohen, L. Time-frequency analysis, volume 778. Prentice Hall PTR Englewood Cliffs, 1995.
Chakraborty, M. & Kar, S. Enhancing person identification through data augmentation of footstep-based seismic signals. IEEE Signal Processing Letters 30, 1642–1646, https://doi.org/10.1109/LSP.2023.3327650 (2023).
Ngo, T. T., Makihara, Y., Nagahara, H., Mukaigawa, Y. & Yagi, Y. The largest inertial sensor-based gait database and performance evaluation of gait-based personal authentication. Pattern Recognition 47(1), 228–237, https://doi.org/10.1016/j.patcog.2013.06.028 (2014).
Soulard, J., Vaillant, J., Balaguier, R. & Vuillerme, N. Spatio-temporal gait parameters obtained from foot-worn inertial sensors are reliable in healthy adults in single-and dual-task conditions. Scientific Reports 11(1), 10229, https://doi.org/10.1038/s41598-021-88794-4 (2021).
Ibrahim, A. A. et al. Short inertial sensor-based gait tests reflect perceived state fatigue in multiple sclerosis. Multiple Sclerosis and Related Disorders 58, 103519, https://doi.org/10.1016/j.msard.2022.103519 (2022).
Zhou, L., Fischer, E., Markus Brahms, C., Granacher, U. & Arnrich, B. Duo-gait: A gait dataset for walking under dual-task and fatigue conditions with inertial measurement units. Scientific Data 10(1), 543, https://doi.org/10.1038/s41597-023-02391-w (2023).
Horst, F., Lapuschkin, S., Samek, W., Müller, K.-R. & Schöllhorn, W. I. Explaining the unique nature of individual gait patterns with deep learning. Scientific reports 9(1), 2391, https://doi.org/10.1038/s41598-019-38748-8 (2019).
Burdack, J. et al. Systematic comparison of the influence of different data preprocessing methods on the performance of gait classifications using machine learning. Frontiers in bioengineering and biotechnology 8, 260, https://doi.org/10.3389/fbioe.2020.00260 (2020).
Derlatka, M. & Parfieniuk, M. Real-world measurements of ground reaction forces of normal gait of young adults wearing various footwear. Scientific data 10(1), 60, https://doi.org/10.1038/s41597-023-01964-z (2023).
Leporace, G., Batista, L.A., Metsavaht, L. & Nadal, J. Residual analysis of ground reaction forces simulation during gait using neural networks with different configurations. In Proceedings of the 37th Annual International Conference of the IEEE Engineering in Medicine and Biology Society (EMBC), pages 2812–2815, https://doi.org/10.1109/EMBC.2015.7318976 (2015).
Subramanian, R. & Sarkar, S. Evaluation of algorithms for orientation invariant inertial gait matching. IEEE Transactions on Information Forensics and Security 14(2), 304–318, https://doi.org/10.1109/TIFS.2018.2850032 (2018).
He, K., Gkioxari, G., Dollár, P. & Girshick, R. Mask r-cnn. In Proceedings of the IEEE international conference on computer vision, pages 2961–2969 (2017).
Chakraborty, M., Mukhopadhyay, B., Chandan, C., Anchal, S. & Kar, S. A structural vibration-based dataset for human gait recognition. OSF, https://doi.org/10.17605/OSF.IO/VPWCZ (2025).
Acknowledgements
We acknowledge the support of the Department of Electrical Engineering, Centre for Sensors, Instrumentation and Cyber-Physical System Engineering (SeNSE), and Bharti School of Telecommunications Technology and Management (BSTTM) at Indian Institute of Technology Delhi (IIT-Delhi). We would like to thank Atharv Saxena, S. Krishnapriya for their support during data collection and all the participants who participated in this experiment. This work was supported in part by PMRF Scholarship, under Grant 1402105 and in part by IIT-Delhi.
Author information
Authors and Affiliations
Contributions
M.C., C., B.M., S.A., S.K. conceived the experiment(s). M.C., S.A., and C. conducted the experiment(s), M.C. analyzed the results and wrote the manuscript. All authors reviewed the manuscript.
Corresponding author
Ethics declarations
Competing interests
The authors declare no competing interests.
Additional information
Publisher’s note Springer Nature remains neutral with regard to jurisdictional claims in published maps and institutional affiliations.
Rights and permissions
Open Access This article is licensed under a Creative Commons Attribution-NonCommercial-NoDerivatives 4.0 International License, which permits any non-commercial use, sharing, distribution and reproduction in any medium or format, as long as you give appropriate credit to the original author(s) and the source, provide a link to the Creative Commons licence, and indicate if you modified the licensed material. You do not have permission under this licence to share adapted material derived from this article or parts of it. The images or other third party material in this article are included in the article’s Creative Commons licence, unless indicated otherwise in a credit line to the material. If material is not included in the article’s Creative Commons licence and your intended use is not permitted by statutory regulation or exceeds the permitted use, you will need to obtain permission directly from the copyright holder. To view a copy of this licence, visit http://creativecommons.org/licenses/by-nc-nd/4.0/.
About this article

Cite this article
Chakraborty, M., Chandan, Anchal, S. et al. A Structural Vibration-based Dataset for Human Gait Recognition. Sci Data 12, 1617 (2025). https://doi.org/10.1038/s41597-025-05517-4
Received:
Accepted:
Published:
Version of record:
DOI: https://doi.org/10.1038/s41597-025-05517-4
