
Abstract
This study aims to develop comprehensive real operational datasets from three distinct building types—a large-scale office, an auditorium, and a hospital—focusing on Air Handling Units (AHUs) equipped with Constant Air Volume (CAV) systems for Automated Fault Detection and Diagnosis (AFDD). Although a consistent methodological framework was followed, data collection and preparation processes were specifically adapted to each building’s unique operational characteristics. Key procedures included: (1) customized raw data collection based on individual building requirements; (2) thorough identification and removal of missing or duplicated data points; (3) systematic annotation of operational conditions and fault categories; and (4) strategic division of datasets into training, validation, and test subsets tailored to each building’s specific data features. The resulting datasets enable researchers and developers to refine and advance machine learning and diagnostic models specifically designed for AFDD within AHU systems. Facility operators can then seamlessly integrate these validated AFDD models into existing management systems, facilitating efficient automated fault detection and ensuring optimal performance and reliability.
Background & Summary
Air Handling Units (AHUs) within Heating, Ventilation, and Air Conditioning (HVAC) systems primarily regulate and circulate conditioned air to maintain optimal indoor environmental conditions, including temperature, humidity, ventilation, and air quality1,2,3. Automated Fault Detection and Diagnosis (AFDD) for AHUs involves continuous and automated monitoring of multiple system components, including sensors, actuators, and controllers, to rapidly detect any abnormal or faulty conditions.
In recent decades, numerous data-driven AFDD methods have been extensively studied, with supervised machine learning approaches receiving particular attention due to their high accuracy and reliability4,5,6,7. However, these supervised methods heavily depend on extensive and accurately labeled datasets for training and validation. Examples of such datasets include the 1043-RP dataset developed for chiller systems8,9 and the 1312-RP dataset focusing on laboratory-based AHU systems10. Additionally, researchers have commonly created simulation datasets using widely recognized tools such as HVACSIM + and Modelica11,12,13,14.
Although simulation and laboratory datasets offer ease of accessibility and controlled conditions, real operational data obtained from actual building environments are crucial. Real-world operational data authentically capture complex system behaviors, environmental variations, and unforeseen events that simulations or laboratory experiments might not fully replicate15. Despite advancements, there remain significant gaps in the availability of comprehensive real operational datasets, particularly in specialized building contexts. To date, only limited research specifically addresses real operational data for office buildings, with a predominant focus on developing operational guidelines rather than extensively providing real-world datasets16.
To bridge this gap, the primary objective of this research is to develop extensive, real operational datasets from three distinct building types—a large-scale office, an auditorium, and a hospital. These buildings were specifically chosen because they represent typical urban environments, enhancing the transferability and generalizability of the developed AFDD methods to similar facilities. Researchers can utilize these datasets to explore, validate, and publish novel methods, while developers can leverage them to refine, implement, and enhance machine learning and diagnostic models specifically designed for AFDD in AHU systems.
Methods
The real operational dataset collected from various building types utilizes AHUs equipped with Constant Air Volume (CAV) in HVAC systems. While a consistent methodological framework guided the overall process of data collection and preparation, specific procedures were adapted to accommodate the unique operational characteristics and configurations of each building. These steps included: (1) customized raw data collection tailored to the specific requirements of each building type; (2) removal of missing or duplicated data points within each dataset; (3) systematic labelling of operational conditions and fault types at the target class level; and (4) dataset splitting into training, validation, and test subsets designed according to the distinct data characteristics of each building.
Raw data collection
Raw data collection was conducted across three distinct building types: an auditorium, a hospital, and an office. Each building type utilized multiple AHUs, varying in number, specifications, and sensor configurations specifically tailored for AFDD across different rooms or spaces. Initially, each sensor recorded data at one-minute intervals. For practical, hourly-scale analysis, these high-frequency measurements were aggregated into hourly intervals. This aggregation significantly reduced storage requirements and simplified data management challenges typically associated with high-frequency datasets in real-world applications.
However, aggregating data into hourly intervals introduces certain considerations for AFDD method development. Operational statuses and valve positions, for example, might fluctuate or modulate multiple times within an hour, and such detailed variations may not be fully captured when data are aggregated. Although this does not diminish the overall usefulness of the dataset, AFDD developers should carefully consider these implications when applying or interpreting hourly aggregated data.
All sensors utilized for AFDD were calibrated annually according to standard procedures specified by their respective manufacturers. Calibration procedures, detailed below for each sensor type, ensured consistent data accuracy and reliability. The sensors employed for FDD are detailed in Table 1, including their descriptions and measurement units with sensor accuracy. Although sensor types were consistent across buildings, the total number of sensors varied slightly depending on each building’s unique characteristics. More detailed dataset descriptions for each building type are provided below.
-
Auditorium
The data collection was conducted at the Sejong Arts Center (21 Gungnipbangmulgwan-ro, Sejong-si), covering an area of 16,186 m² across floors B1 to 6 F. The dataset was collected over a period of one year, from January 1 to December 31, 2022. The facility was equipped with 13 AHUs, each designed with cooling and heating capabilities tailored to specific spaces, as detailed in Table 2. The AHU system incorporated 15 distinct sensor variables, with sensor placement illustrated schematically in Fig. 1. Data from these AHUs were recorded hourly and continuously throughout the entire year, resulting in a comprehensive dataset comprising 113,880 hourly records.
Fig. 1 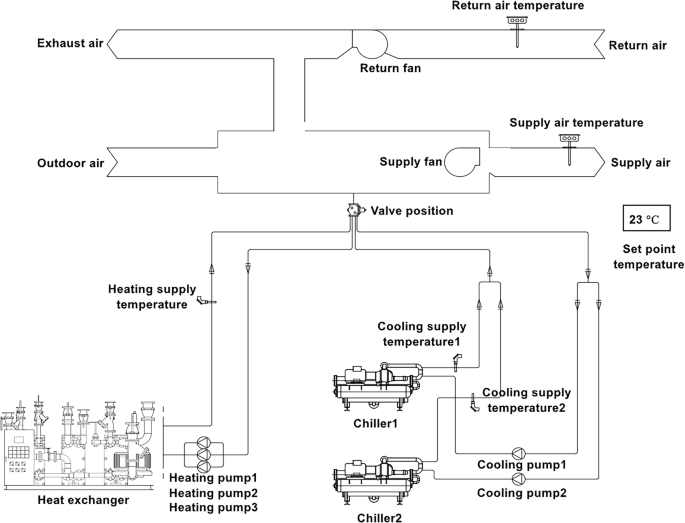
Schematic diagrams of sensor placement for AHUs in the auditorium.
Table 1 Description of used sensors with their units. Table 2 Specifications of installed AHUs within the auditorium facility. -
Hospital
The data collection was conducted at the New Wing of the National Cancer Center Hospital (323 Ilsan-ro, Ilsandong-gu, Goyang-si, Gyeonggi-do), which covers an area of 18,900 m2 extending from basement level 2 to the 5th floor. The building was completed in October 2020, and data collection took place continuously over one year, from January 1 to December 31, 2022. The facility included eight AHUs, each equipped with cooling and heating coils, as detailed in Table 3. A total of nine sensor variables were employed, with their locations illustrated schematically in Fig. 2. Hourly data collection throughout the entire year resulted in a comprehensive dataset comprising 70,080 hourly records.
Table 3 Specifications of installed AHUs within the hospital facility. Fig. 2 
Schematic diagrams of sensor placement for AHUs in the hospital.
-
Large-scale office
The data collection was performed at a large-scale office building located at 48 Gwacheon-daero 7na-gil, Gwacheon-si, Gyeonggi-do, covering an area of 50,966 m² from basement level 4 to the 6th floor. The dataset was collected continuously from December 1, 2023, to November 30, 2024. The facility employed 20 AHUs, each equipped with cooling and heating coils, as detailed in Table 4. A total of 18 sensor variables were utilized, with their schematic locations illustrated in Fig. 3. The data collection yielded 175,532 hourly entries, which slightly exceeds the theoretical total of 175,200 hourly records (calculated as 20 AHUs × 365 days × 24 hours). This difference is likely attributed to additional operational logging or monitoring events captured during data collection.
Table 4 Specifications of installed AHUs within the office facility. Fig. 3 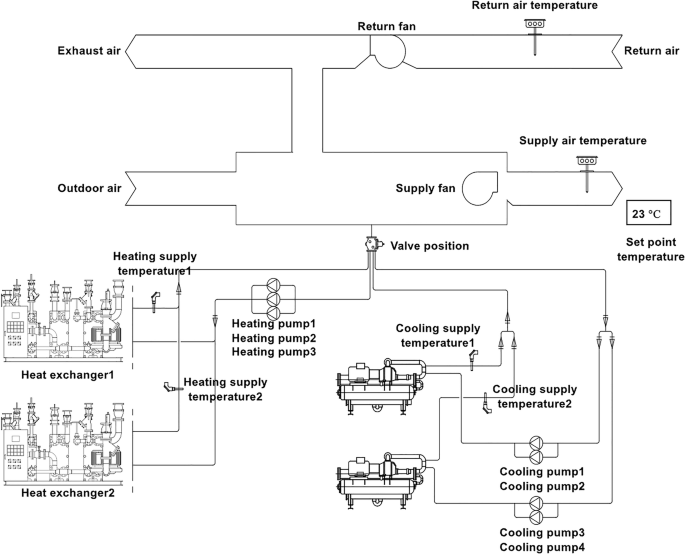
Schematic diagrams of sensor placement for AHUs in the office.


Table 5 summarizes the collected raw datasets for each building type, including the total area, data collection period, number of AHUs, number of sensors, and total data points recorded. Although each dataset has a clearly defined total number of data points, it may still contain some missing sensor variables. Additionally, as mentioned earlier, the dataset from the office building includes 175,532 hourly records, slightly exceeding the theoretically expected 175,200 entries (calculated as 20 AHUs × 24 hours/day × 365 days). This discrepancy indicates that additional operational logging or data recording activities might have occurred. In the following chapter, the collected datasets will be thoroughly reviewed, checked for completeness, and preprocessed to ensure accuracy and consistency for further analysis.
Removal of missing, and duplicated data
Initially, data from multiple AHUs across three buildings were collected hourly for one year (365 days). The theoretical data points were calculated based on the total number of AHUs, days in a year, and hourly intervals. However, discrepancies were found when comparing actual collected data with theoretical expectations, as shown in Table 6.
The auditorium and hospital datasets presented fewer actual data points than theoretically expected, indicating missing values in some independent variables. Specifically, the Auditorium dataset had 505 missing entries, while the Hospital dataset had 4,032 missing entries. These missing data points likely resulted from sensor malfunctions, temporary data logging interruptions, or communication errors during data collection17.
Conversely, the office dataset contained 332 more entries than theoretically expected. Upon closer examination, these excess entries were identified as duplicated data points caused by logging or synchronization errors. After removing these duplicates, the office dataset matched the theoretical data expectation.
Annotation of target class
Seven operational conditions were initially defined for annotation, comprising one normal operation and six fault types: supply fan fault, cooling pump fault, heating pump fault, return air temperature sensor fault, supply air temperature sensor fault, and valve position fault.
While universal guidelines are available to distinguish normal from faulty operational conditions, specific numerical ranges are not consistently defined for all fault types. According to Wang et al.16, certain faults like the return air temperature sensor fault and the supply air temperature sensor fault have widely accepted numerical criteria. In contrast, faults such as valve position issues generally rely on broader guidelines without explicit numerical ranges.
In practice, numerical fault criteria must be tailored to specific AHU installations due to variations in system configurations, manufacturer specifications, and operational contexts. An important observation made during annotation is that typically, the return air temperature is higher than the supply air temperature. However, specific operational conditions can cause this relationship to reverse. For instance, during periods of low occupancy or inactivity—particularly in office and auditorium buildings—interior spaces can naturally cool, resulting in the return air temperature falling below the supply air temperature. Additionally, when cooler outdoor air is introduced through free cooling (economizer mode) without mechanical cooling, the return air temperature may also become relatively lower.
In this study, six HVAC experts, each with over 20 years of engineering experience, applied ASHRAE-based guidelines to empirically establish appropriate numerical ranges suitable for typical hospital AHU systems. Table 7 details the established criteria and numerical ranges for each condition.
Annotations were manually entered into an Excel program by four annotators, each possessing over 20 years of HVAC FDD expertise and backgrounds in mechanical engineering. To enhance reliability and predictive accuracy, an independent team of two experts cross-checked a randomly selected subset of the annotated data.
The operational conditions and overall fault distributions for each building type are visualized in Fig. 4. Each hourly data point was treated individually; therefore, a continuous fault lasting multiple hours was counted as multiple occurrences (one per hour). Similarly, continuous normal operation was also counted as multiple occurrences, one for each hour. The analysis shows that hospitals exhibit greater operational reliability compared to auditoriums and offices. Auditoriums have a relatively balanced distribution between normal and faulty conditions, whereas office buildings display a significant number of faults, indicating a critical area for targeted improvement.

Distribution of operational conditions (normal and fault condition) by building type.
Table 8 provides the distribution of each fault category across datasets, highlighting differences arising from the varied occurrence of specific fault types. Notably, despite being part of the annotation guidelines, certain faults were absent in specific buildings:
-
The cooling pump fault and heating pump fault were not identified in the hospital and office buildings, indicating stable pump operation aligned with system demands throughout the monitoring period.
-
The cooling supply temperature fault was rarely identified, occurring only once within the hospital building. Conversely, this fault was entirely absent in both the auditorium and office buildings.
-
These observations reflect variations in operational reliability and highlight differences in fault profiles across different building types and system configurations.
Data split
After completing the annotation of the entire dataset, the data were randomly partitioned into three subsets: training (60%), validation (20%), and test (20%). In machine learning, the training set is typically used exclusively for model training, the validation set is employed for hyperparameter tuning and selecting the best-performing models, and the test set provides an unbiased evaluation of the final model’s performance on unseen data18. However, traditional random splitting can lead to smaller classes becoming disproportionately underrepresented19,20. To address this issue, stratified sampling was employed to maintain balanced representation across all subsets.
Notably, certain faults either did not occur during the data collection period or occurred very infrequently, presenting challenges for robust machine learning model training and evaluation. Consequently, these minor classes were excluded from the data-splitting process. Specifically, seven categories—one normal condition and six fault conditions—were defined for fault detection and diagnosis as follows:
-
Normal condition: “Normal”
-
Return Air Temperature Sensor Fault: “RATSF”
-
Supply Air Temperature Sensor Fault: “SATSF”
-
Supply Fan Fault: “SFF”
-
Valve Position Fault: “VPF”
-
Cooling Pump Fault: “CPF”
-
Heating Pump Fault: “HPF”
Stratified sampling preserves the proportional representation of each class within each dataset subset, ensuring that classes, particularly those with fewer instances, are neither overrepresented nor underrepresented. This approach reduces the risk of bias, supports stable model training, and enhances the reliability and validity of subsequent evaluations. Detailed distributions of each dataset across training, validation, and test subsets are provided in Table 9.
Data Record
Each sensor continuously monitors and records its corresponding variable, generating a detailed record of each AHU’s operational status along with labeling for relevant faults. These sensors are integrated into the Building Management System (BMS), enabling continuous monitoring and control of AHU operations. Initially, data from each sensor variable was individually stored in csv file format, directly exported from the BMS, which manages and monitors HVAC systems across the building. The integrated datasets for each building type have been compiled and stored in the Figshare repository21. Details of the stored files, including the number of AHUs, sensors, operating conditions, and filenames, are provided in Table 10.
Technical Validation
Because imputation methods rely heavily on assumptions about how data becomes missing—and violations of these assumptions can introduce significant biases—this study excluded data entries if more than one independent variable was missing. Specifically, to improve the robustness and accuracy of machine learning models, missing data were intentionally not imputed, as artificial imputation can potentially distort underlying data patterns and negatively impact predictive performance22,23.
To further enhance data quality and reliability, each AHU condition across all building types was meticulously labeled according to clearly defined guidelines and numerical ranges outlined in Table 7. Annotation was conducted manually by four annotators, each possessing at least 20 years of specialized experience in HVAC FDD and comprehensive mechanical engineering expertise. Their extensive experience significantly reduced potential labeling errors, improved annotation accuracy, and ensured consistency throughout the process.
An illustrative example demonstrating the labeling approach using auditorium data for each condition is provided in Table 11. In this table, it is important to note that certain rows labeled as “normal condition” reflect special but valid operational scenarios. For instance, the first row, which shows low Supply Air Temperature (17.12 °C) combined with a higher cooling supply temperature (~26 °C) and inactive cooling pumps, indicates the system operating in economizer mode (free cooling), directly utilizing cooler outdoor air. The partially open valve position (48.08%) is part of the AHU’s airflow modulation strategy to efficiently maintain indoor conditions without mechanical cooling. The second row represents transient or transitional operational states, where the higher supply air temperature (26.77 °C) compared to the set point (22 °C), along with the fully open valve position (100%) but inactive heating pumps, reflects specific AHU control logic during temporary operational adjustments or transitions between operating modes.
Annotators directly recorded corresponding fault labels into an Excel spreadsheet. Additionally, to ensure high-quality annotations and reliable predictive outcomes, an independent verification team comprising two additional experts cross-checked randomly selected annotated samples. This rigorous cross-validation step was instrumental in identifying and correcting annotation inconsistencies, further strengthening dataset quality.
Code availability
Python and the Pandas library, along with custom-developed code, were employed to handle missing data, remove duplicate entries, and analyze dataset distributions. The final processed dataset is provided as an Excel-compatible CSV file. The specific code used for these preprocessing steps is available in the Figshare repository21 under the filename “FDD_processing.ipynb.”
References
Yun, W. S., Hong, W. H. & Seo, H. A data-driven fault detection and diagnosis scheme for air handling units in building HVAC systems considering undefined states. J. Build. Eng. 35, 1–12 (2021).
Li, G. et al. Interpretation of convolutional neural network-based building HVAC fault diagnosis model using improved layer-wise relevance propagation. Energy Build. https://doi.org/10.1016/j.enbuild.2023.112949 (2023).
Wang, H., Lin, J. & Zhang, Z. Single imbalanced domain generalization network for intelligent fault diagnosis of compressors in HVAC systems under unseen working conditions. Energy Build. 312, 114192 (2024).
Chen, J. et al. A review of computing-based automated fault detection and diagnosis of heating, ventilation and air conditioning systems. Renewable and Sustainable Energy Reviews at https://doi.org/10.1016/j.rser.2022.112395 (2022).
Crowe, E. et al. Empirical analysis of the prevalence of HVAC faults in commercial buildings. Sci. Technol. Built Environ. https://doi.org/10.1080/23744731.2023.2263324 (2023).
Wang, S. Automated Fault Diagnosis Detection of Air Handling Units Using Real Operational Labelled Data and Transformer-based Methods at 24-hour operation Hospital. Build. Environ. 113257, https://doi.org/10.1016/j.buildenv.2025.113257 (2025).
Wang, S., Kim, J., Park, S. & Kim, J. Fault Diagnosis of Air Handling Units in an Auditorium Using Real Operational Labeled Data Across Different Operation Modes. Comput. Civ. Eng. 39 (2025).
Comstock, M. C., Braun, J. E. & Bernhard, R. J. Experimental data from fault detection and diagnostic studies on a centrifugal chiller. Purdue Univ. (1999).
Comstock, M. C. & Braun, J. E. Development of analysis tools for the evaluation of fault detection and diagnostics for chillers. ASHRAE (1999).
Li, S. Development and validation of a dynamic air handling unit model, Part I. ASHRAE Trans. 116, 45 (2010).
Schein, J., Bushby, S. T. & Schein, J. R. A simulation study of a hierarchical, rule-based method for system-level fault detection and diagnostics in HVAC systems. (US Department of Commerce, National Institute of Standards and Technology, 2005).
Pourarian, S. et al. A tool for evaluating fault detection and diagnostic methods for fan coil units. Energy Build. https://doi.org/10.1016/j.enbuild.2016.12.018 (2017).
Granderson, J. et al. A labeled dataset for building HVAC systems operating in faulted and fault-free states. Sci. Data https://doi.org/10.1038/s41597-023-02197-w (2023).
Granderson, J., Lin, G., Harding, A., Im, P. & Chen, Y. Building fault detection data to aid diagnostic algorithm creation and performance testing. Sci. Data https://doi.org/10.1038/s41597-020-0398-6 (2020).
Huang, J. et al. Real vs. simulated: Questions on the capability of simulated datasets on building fault detection for energy efficiency from a data-driven perspective. Energy Build. 259, 111872 (2022).
Wang, S., Eum, I., Park, S. & Kim, J. A semi-labelled dataset for fault detection in air handling units from a large-scale office. Data Br. 57, 110956 (2024).
Wang, S. Evaluation of impact of image augmentation techniques on two tasks: Window detection and window states detection. Results Eng. 24, 103571 (2024).
Wang, S., Korolija, I. & Rovas, D. Impact of Traditional Augmentation Methods on Window State Detection. CLIMA 2022 Conf. 1–8, https://doi.org/10.34641/clima.2022.375 (2022).
Wang, S., Kim, M., Hae, H., Cao, M. & Kim, J. The Development of a Rebar-Counting Model for Reinforced Concrete Columns: Using an Unmanned Aerial Vehicle and Deep-Learning Approach. J. Constr. Eng. Manag. 149, 1–13 (2023).
Wang, S. & Han, J. Automated detection of exterior cladding material in urban area from street view images using deep learning. J. Build. Eng. 96, 110466 (2024).
Wang, S. Labelled dataset for FDD in different building types: auditorium, hospital, and large-scale office. https://doi.org/10.6084/m9.figshare.27147678.v3 (2024).
Eum, I., Kim, J., Wang, S. & Kim, J. Heavy Equipment Detection on Construction Sites Using You Only Look Once (YOLO-Version 10) with Transformer Architectures. Appl. Sci. 15 (2025).
Han, J., Kim, J., Kim, S. & Wang, S. Effectiveness of Image Augmentation Techniques on Detection of Building Characteristics from Street View Images Using Deep Learning. J. Constr. Eng. Manag. 150, 1–18 (2024).
Author information
Authors and Affiliations
Contributions
S. Wang: Conceptualization, Formal analysis, Software, Validation, Visualization, Writing – original draft, Writing – review & editing, Project administration. S. Wang reviewed and approved the manuscript.
Corresponding author
Ethics declarations
Competing interests
The authors declare no competing interests.
Additional information
Publisher’s note Springer Nature remains neutral with regard to jurisdictional claims in published maps and institutional affiliations.
Rights and permissions
Open Access This article is licensed under a Creative Commons Attribution-NonCommercial-NoDerivatives 4.0 International License, which permits any non-commercial use, sharing, distribution and reproduction in any medium or format, as long as you give appropriate credit to the original author(s) and the source, provide a link to the Creative Commons licence, and indicate if you modified the licensed material. You do not have permission under this licence to share adapted material derived from this article or parts of it. The images or other third party material in this article are included in the article’s Creative Commons licence, unless indicated otherwise in a credit line to the material. If material is not included in the article’s Creative Commons licence and your intended use is not permitted by statutory regulation or exceeds the permitted use, you will need to obtain permission directly from the copyright holder. To view a copy of this licence, visit http://creativecommons.org/licenses/by-nc-nd/4.0/.
About this article

Cite this article
Wang, S. Real operational labeled data of air handling units from office, auditorium, and hospital buildings. Sci Data 12, 1481 (2025). https://doi.org/10.1038/s41597-025-05825-9
Received:
Accepted:
Published:
Version of record:
DOI: https://doi.org/10.1038/s41597-025-05825-9
This article is cited by
-
Domain-adaptive faster R-CNN for non-PPE identification on construction sites from body-worn and general images
Scientific Reports (2026)
-
Development of an automated transformer-based text analysis framework for monitoring fire door defects in buildings
Scientific Reports (2025)
-
Fault-class coverage–aligned combined training for AFDD of AHUs across multiple buildings
Scientific Reports (2025)
-
Domain adaptation using transformer models for automated detection of exterior cladding materials in street view images
Scientific Reports (2025)
