
Abstract
Relaxation-diffusion MRI (rdMRI) is an advanced imaging technique that acquires diffusion MRI data across multiple echo times (TEs), enabling the disentanglement of relaxation and diffusion effects. This approach offers deeper insights into tissue microstructure, making it especially powerful for studying complex tissue organization and developmental processes. However, the lack of publicly available rdMRI datasets in mouse models has significantly limited its application in preclinical research. Here, we present a high-quality in-vivo rdMRI dataset of aging mouse brains, collected from five different age groups (n = 6 per group) using a 9.4 T ultra-high field MRI scanner. The rdMRI data were acquired at 5 different TEs, with multi-shell diffusion scans at each TE. Each rdMRI dataset was processed through a specialized pipeline, with systematic quality control to ensure the reliability of the data. This dataset provides a foundation for validating and optimizing rdMRI techniques and serves as a valuable resource for investigating age-related structural alterations in the mouse brain.
Background & Summary
Diffusion magnetic resonance imaging (dMRI) is a non-invasive imaging technique that characterizes brain microstructure by probing the displacement of water molecules in tissue1. Beyond conventional dMRI, relaxation-diffusion MRI (rdMRI) integrates both diffusion and relaxation properties, such as longitudinal (T1) or transverse (T2) relaxation, which enhances the sensitivity to microstructural heterogeneity and improves compartment-specific contrast2,3,4,5. Among rdMRI techniques, T2-relaxation-diffusion imaging acquires diffusion-weighted data at multiple echo times (TEs), enabling the separation of diffusion from transverse relaxation effects across tissue compartments6,7,8,9. This addresses key limitations of traditional single-TE dMRI, which assumes uniform T₂ within each voxel and may bias diffusion estimates in complex tissue environments10,11,12. By disentangling these effects, T2-relaxation-diffusion MRI allows for more precise and robust characterization of complex brain microstructure4,5.
Age-related alterations in brain microstructure, including axonal degeneration, myelin breakdown, and changes in cellular density13, are closely associated with cognitive decline and the development of neurodegenerative diseases such as Alzheimer’s disease14,15. Accurately characterizing these changes is essential for understanding brain aging and its pathological mechanisms16. Mouse models play a vital role in aging research due to their genetic modifiability, experimental control, and widespread use in preclinical studies17,18.
Given the sensitivity of rdMRI in detecting subtle neural microstructure changes5,19, it is particularly well-suited for investigating age-related alterations in the brain20,21. However, despite its potential, publicly available rdMRI datasets for aging studies in mouse models remain scarce. Thus, we have released a high-quality rdMRI dataset of the aging mouse brain covering five different age groups. This dataset comprises multi-shell diffusion-weighted images acquired at five TEs using a 9.4 T ultra-high field animal MRI scanner. A customized preprocessing pipeline tailored for rdMRI data was employed, followed by the calculation of relaxation-regressed diffusion signals and transverse relaxation rates using the RElaxation-Diffusion Imaging Moments (REDIM)5 framework. Comprehensive quality control measures were applied, including signal-to-noise ratio (SNR) quantification and standardized assessments using the DSI Studio software (version 2022.07.06), ensuring data accuracy and consistency.
By sharing these data openly, we aim to support the optimization of rdMRI algorithms, particularly in preclinical mouse models. Moreover, we hope this dataset serves as a foundational resource, inspiring the development of novel approaches for studying aging and neurodegenerative diseases in preclinical research.
Methods
Animals
All animal experiments were conducted in accordance with the Institutional Animal Care and Use Committee of Southern Medical University. This dataset involved 30 male C57BL/6 mice, divided into five age groups (2, 6, 12, 18, and 24 months), with 6 mice per group (Fig. 1). The animals were housed in standard laboratory conditions with controlled temperature and a 12-hour light/dark cycle, with free access to food and water.

Age distribution of scanned mice. Five groups of mice were scanned at different age points using a 9.4 T MRI animal scanner. Each age group included 6 different mice (total n = 30), providing cross-sectional coverage across the mouse lifespan for relaxation-diffusion MRI analysis.
MRI acquisitions
All in-vivo MRI experiments were conducted with a Bruker BioSpin 9.4 T scanner (Software: ParaVision 360). An 86 mm volume coil was used for transmission and a 2 × 2 mouse brain surface array coil was used for signal reception. Diffusion weighted imaging (DWI) was performed with a slew rate of 4497 T/m/s and the maximum gradient amplitude of 660 mT/m. During scanning, the mice were anesthetized with 1%-1.5% isoflurane (RWD Life Science, China). The mice were restrained in an animal holder with ear pins and a bite bar. Respiration rate was monitored with a pressure transducer placed under the abdomen, just below the ribcage. Respiration ranged between 60 and 70 breaths per minute during scanning. A circulating water heating pad was used to maintain the temperature of the animals at 37.5 ± 0.1 °C.
All diffusion MRI data were acquired in the coronal plane using a multi-shot 2D spin echo echo-planar imaging (SE-EPI) pulse sequence, with the phase encoding direction set to Inferior-Superior (IS) for all acquisitions. The TEs were acquired in ascending order: TE = 22, 37, 52, 67, and 82 ms. For each TE, 30 gradient directions were acquired at b-values of 500, 1000, 1500, and 2500 s/mm² (Fig. 2a), along with six in-phase encoding (IS) b0 images and six reversed phase encoding (SI) b0 images. The same set of 30 gradient directions was used across all TEs and b-values. TR = 3200 ms, FOV = 18 × 15 mm², matrix size = 180 × 150, slices = 15, in-plane resolution = 0.1 × 0.1 mm2, slice thickness = 0.5 mm, flip angle = 90°, bandwidth = 345 kHz, average = 1, segments = 4. The diffusion gradient duration (δ) was 4 ms, and the diffusion gradient separation (∆) was 10 ms. The total scan time was 27 minutes per TE, resulting in 135 minutes per mouse for the full rdMRI protocol.

An illustration of the processing pipeline for multi-TE dMRI data acquisition and registration in the mouse brain. (a) Acquisition scheme design for relaxation-diffusion MRI. (b) Image preprocessing pipeline for multi-TE dMRI data. (c) Rigid alignment of multi-TE dMRI data (37 ms, 52 ms, 67 ms, and 82 ms) to the reference dMRI data at TE = 22 ms. (d) Relaxation regressed DWI images and transverse relaxation rate image. (e) Relaxation regressed dMRI data registration pipeline to atlas space.
T2-weighted anatomical images were acquired using a 2D turbo rapid acquisition with relaxation enhancement (TurboRARE) sequence. The parameters included: TR = 3200 ms, TE = 11 ms, rare factor = 8, FOV = 18 × 15 mm², matrix size = 225 × 187, slices = 15, in-plane resolution = 0.08 × 0.08 mm2, slice thickness = 0.5 mm, average = 3, excitation flip angle = 90°, bandwidth = 1400 kHz, scan time = 4 minutes.
Data processing
The raw data were converted from Digital Imaging and Communications in Medicine (DICOM) to Neuroinformatics Informatics Technology Initiative (NIfTI) format using dcm2niix in MRIcroGL (version 1.2). Preprocessing of the dMRI data for each TE session was conducted in MRtrix3 (version 3.0.1)22 and included the following steps: denoising23 (using magnitude data only), unringing24, distortion and motion correction25, and bias field correction26, as shown in Fig. 2b. Whole brain masks for each subject were manually edited using the segmentation editor in ITK-SNAP (version 4.0). Subsequently, the 4D dMRI data acquired at TEs of 37, 52, 67, and 82 ms were rigidly registered to the TE = 22 ms data using the “mrregister” command in MRtrix322 (Fig. 2c).
The relaxation-regressed diffusion signal and the relaxation rate (Fig. 2d) were then calculated using the REDIM5 method in MATLAB (The MathWorks, USA, version R2022a). The dMRI scalar metrics were computed from the diffusion tensor imaging (DTI)27 and neurite orientation dispersion and density imaging (NODDI)28. DTI metrics include axial diffusivity (AD), radial diffusivity (RD), mean diffusivity (MD), and fractional anisotropy (FA) which were derived using MRtrix329. NODDI metrics include neurite density index (NDI) and orientation dispersion index (ODI) which were calculated with the AMICO toolbox (version 2.1.0)30 using default parameters. Finally, for each subject, the first b0 image from the relaxation-regressed diffusion signal was registered to the Allen Mouse Brain Atlas (AMBA) template31 using the Symmetric Normalization (SyN) algorithm in Advanced Normalization Tools (ANTs)32. The resulting registration transforms were applied to warp all derived dMRI metric maps into the atlas space (Fig. 2e).
Data analysis
Fiber orientation distribution (FOD)33 maps were calculated for each subject using multi-shell constrained spherical deconvolution with a maximum harmonic order of 6. Tractography34 was then generated with one million streamlines using the iFOD235 algorithm, seeding randomly within the whole-brain mask. The following parameters were applied: minimum streamline length of 0.5 mm, FOD cut-off of 0.05, maximum angle of 45°, and step size of 0.025 mm. To further quantify microstructural features, the number of crossing fibers (NCF)36 was derived from the FOD maps.
Data Records
The MRI dataset and exported protocols follow the Brain Imaging Data Structure (BIDS) (version 1.9.0) (https://bids.neuroimaging.io/) standard37 and are publicly available on figshare38 (https://doi.org/10.6084/m9.figshare.28433102). Each subject session folder contains three subfolders: “anat” for anatomical images, “dwi” for raw dMRI data, and “reversed phase-encode dwi” for data acquired with reversed phase encoding direction. Demographic information for each subject is compiled in the “participants.tsv” file, while the acquisition protocol can be found in the JSON files located within each scan folder. In addition, preprocessed outputs are provided in the “derivatives” folder, including both preprocessed data and relaxation-regressed dMRI data.
Technical Validation
To ensure the reliability of the preprocessed rdMRI data, we employed common methods to assess image quality, data consistency, and registration accuracy, as detailed below:
-
The SNR was calculated by dividing the mean signal by the noise39. The mean signal was obtained from a region of interest (ROI) in the white matter at the genu of the corpus callosum in a non-diffusion image (red box in Fig. 3a). The noise was calculated as the standard deviation of the background signal in the same image (blue box in Fig. 3a). All selected ROIs were manually checked and found to be free of ghosting artifacts. The calculated SNR values for each TE are displayed in Fig. 3b.
Fig. 3 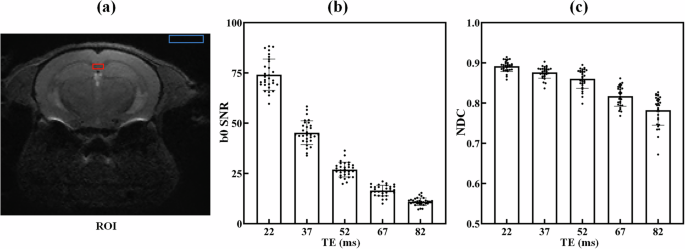
Quality metrics of the preprocessed dMRI data. (a) The ROIs used for measuring the SNR in the non-diffusion image (red box is WM ROI, blue box is background ROI). (b) The calculated SNR values for each TE. (c) The Neighboring DWI Correlation (NDC) for each TE. Each dot represents one mouse (n = 30).
-
The Neighboring DWI Correlation (NDC) was calculated in the DSI Studio software and was assessed to identify low-quality outliers caused by artifacts, such as eddy currents, head motion, or coil issues. Lower NDC values indicate reduced data quality and potential alignment issues. The NDC values for each TE are shown in Fig. 3c. DSI Studio automatically generates quality control reports, which include NDC values and bad slice counts. In our multi-TE dMRI dataset, no bad slices were identified, and all NDC values exceeded the threshold of 0.6. These metrics were carefully reviewed to ensure the quality and reliability of our dataset.
-
To provide a more comprehensive assessment of data quality, we present preprocessed relaxation-regressed dMRI images at TE = 22 ms from three orthogonal views: coronal, axial, and sagittal (Fig. 4). The inclusion of both in-plane and through-plane perspectives allows for the evaluation of intra-slice image quality and the consistency across slices, which is critical for ensuring the continuity of anatomical structures in the dataset. Additionally, we provide a representative example of MD, FA, NDI, and ODI images per age group (2, 6, 12, 18, and 24 months) in Fig. 5. This enables a direct comparison of data quality across different developmental stages, with all images showing approximately the same anatomical location.
Fig. 4 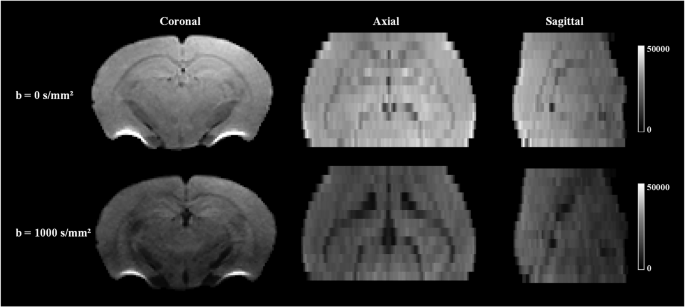
Preprocessed relaxation-regressed dMRI images at TE = 22 ms from three orthogonal views: coronal, axial, and sagittal. The displayed image represents the full FOV.
Fig. 5 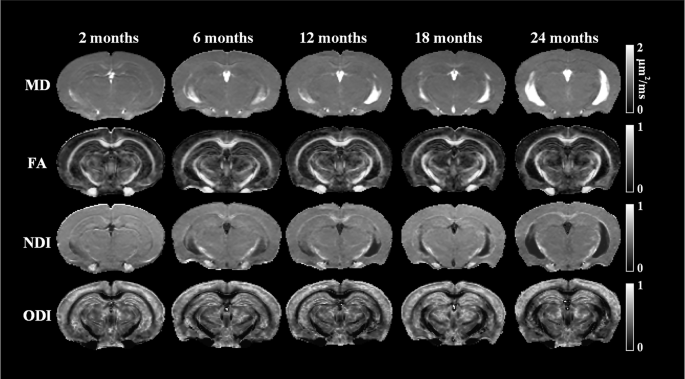
Representative images of MD, FA, NDI, and ODI across different age groups (2, 6, 12, 18, and 24 months).
-
To evaluate the effectiveness of the rdMRI technique in complex fiber regions, we visualized FODs and performed tractography (Fig. 6a, b). The relaxation-regressed FODs offered clearer and more accurate depictions of intricate fiber orientations compared to traditional approaches. Furthermore, the resulting tractography demonstrated the enhanced capability of rdMRI in revealing the connectivity and spatial organization of white matter pathways. Finally, we derived multiple quantitative metrics from the rdMRI data, including transverse relaxation rate, DTI and NODDI parameters, which offer valuable insights into the structural and microstructural properties of brain tissue (Fig. 6c).
Fig. 6 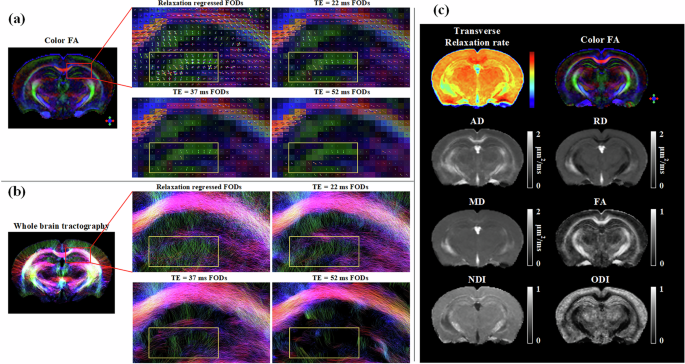
Visualization of FODs, tractography, and parametric maps. (a) FODs at three different TEs (22, 37, and 52 ms), along with relaxation-regressed FODs. (b) Tractography results at three TEs (22, 37, and 52 ms), together with relaxation-regressed tractography. (c) Parametric maps, including transverse relaxation rate, color-FA, AD, RD, MD, FA, NDI, and ODI.
-
To validate the registration accuracy, we calculated the Dice scores for five representative brain regions (cortex, hippocampus, thalamus, striatum, and corpus callosum) between the registered dMRI images and the AMBA. All manual segmentation results were referenced from the Allen Common Coordinate Framework version 3. The Dice scores were computed using the following equation40:


where A and B represent the binary masks of the ROI in the subject and reference, respectively, and A \(\cap \) B represents their intersection. The Dice score results are shown in Fig. 7. Overall, the Dice scores indicate satisfactory registration accuracy, with higher agreement for the cortex, hippocampus, and thalamus, and acceptable performance for the striatum and corpus callosum.

Dice scores for five representative brain regions between the registered dMRI images and the AMBA template. The brain regions include Cortex (CX), Hippocampus (HP), Thalamus (TH), Striatum (STR), and Corpus callosum (CC).
Usage Notes
This rdMRI dataset represents a significant resource for researchers aiming to validate rdMRI analysis algorithms or studying mouse brain development and degeneration41,42,43. To ensure the reliability of the analysis results, special attention must be paid to the data preprocessing.
In this study, although we did not use the reversed phase encoding b0 images for distortion correction, we applied nonlinear registration to align the dMRI images with anatomical images in AMBA space to reduce susceptibility distortion44 (see Methods for details). The reversed phase encoding b0 images are available on figshare and we encourage researchers to utilize them for exploring distortion correction strategies for mouse brains.
In addition, a signal drift was visually detectable along the phase-encoding direction over the course of the long scan. Accurate alignment across the multi-TE dMRI data is critical, and improper alignment may introduce bias in the calculation of relaxation regression diffusion signals.
Finally, the dataset was acquired using anisotropic voxels (0.1 × 0.1 × 0.5 mm3), which may introduce bias in the estimation of ODI in NODDI, especially in regions with complex fibers. Users should interpret ODI results with caution.
Code availability
All the REDIM code and processing scripts related to MRtrix3 and ANTs are available for access on figshare (https://doi.org/10.6084/m9.figshare.28433102), providing researchers with a transparent and reproducible framework for carrying out rdMRI analyses.
Data availability
The dataset is available at figshare (https://doi.org/10.6084/m9.figshare.28433102).
References
Alexander, D. C., Dyrby, T. B., Nilsson, M. & Zhang, H. Imaging brain microstructure with diffusion MRI: practicality and applications. NMR Biomed 32, e3841, https://doi.org/10.1002/nbm.3841 (2017).
Leppert, I. R. et al. Efficient whole-brain tract-specific T1 mapping at 3 T with slice-shuffled inversion-recovery diffusion-weighted imaging. Magn. Reson. Med. 86, 738–753, https://doi.org/10.1002/mrm.28734 (2021).
De Santis, S., Barazany, D., Jones, D. K. & Assaf, Y. Resolving relaxometry and diffusion properties within the same voxel in the presence of crossing fibres by combining inversion recovery and diffusion-weighted acquisitions. Magn. Reson. Med. 75, 372–380, https://doi.org/10.1002/mrm.25644 (2015).
Wu, Y. et al. Relaxation-Diffusion Spectrum Imaging for Probing Tissue Microarchitecture. in Medical Image Computing and Computer Assisted Intervention-MICCAI 2023. 14227, 152-162 (2023).
Ning, L., Gagoski, B., Szczepankiewicz, F., Westin, C.-F. & Rathi, Y. Joint RElaxation-Diffusion Imaging Moments to Probe Neurite Microstructure. IEEE Trans. Med. Imaging 39, 668–677, https://doi.org/10.1109/tmi.2019.2933982 (2020).
McKinnon, E. T. & Jensen, J. H. Measuring intra-axonal T2 in white matter with direction-averaged diffusion MRI. Magn. Reson. Med. 81, 2985–2994, https://doi.org/10.1002/mrm.27617 (2018).
Veraart, J., Novikov, D. S. & Fieremans, E. TE dependent Diffusion Imaging (TEdDI) distinguishes between compartmental T2 relaxation times. Neuroimage 182, 360–369, https://doi.org/10.1016/j.neuroimage.2017.09.030 (2017).
de Almeida Martins, J. P. & Topgaard, D. Multidimensional correlation of nuclear relaxation rates and diffusion tensors for model-free investigations of heterogeneous anisotropic porous materials. Sci Rep 8, 2488, https://doi.org/10.1038/s41598-018-19826-9 (2018).
Kim, D., Doyle, E. K., Wisnowski, J. L., Kim, J. H. & Haldar, J. P. Diffusion-relaxation correlation spectroscopic imaging: A multidimensional approach for probing microstructure. Magn. Reson. Med. 78, 2236–2249, https://doi.org/10.1002/mrm.26629 (2017).
Harrison, J. R. et al. Imaging Alzheimer’s genetic risk using diffusion MRI: A systematic review. Neuroimage Clin 27, 102359, https://doi.org/10.1016/j.nicl.2020.102359 (2020).
Alexander, A. L., Lee, J. E., Lazar, M. & Field, A. S. Diffusion tensor imaging of the brain. Neurotherapeutics 4(3), 316–329, https://doi.org/10.1016/j.nurt.2007.05.011 (2007).
Maharjan, S. et al. Age-dependent microstructure alterations in 5xFAD mice by high-resolution diffusion tensor imaging. Front. Neurosci 16, 964654, https://doi.org/10.3389/fnins.2022.964654 (2022).
Seo, S. W. et al. P2-142: Pathogenesis of gray and white matter changes in cognitively impaired patients due to Alzheimer’s, cerebrovascular disease, and mixed pathologies: Axonal degeneration versus myelin breakdown. Alzheimer’s & Dementia 11, 540–541, https://doi.org/10.1016/j.jalz.2015.06.680 (2015).
Bozzali, M. White matter damage in Alzheimer’s disease assessed in vivo using diffusion tensor magnetic resonance imaging. J. Neurol. Neurosurg. Psychiatry 72, 742–746, https://doi.org/10.1136/jnnp.72.6.742 (2002).
Phillips, G. A., Butchart, J., Hope, S., Taylor, G. & Strain, W. D. Salivary beta amyloid 1-42 (Aβ42) for the diagnosis of Alzheimer’s disease: a systematic review and meta-analysis. Alzheimer’s & Dementia 19, e080350, https://doi.org/10.1002/alz.080350 (2023).
Anckaerts, C. et al. Early functional connectivity deficits and progressive microstructural alterations in the TgF344-AD rat model of Alzheimer’s Disease: A longitudinal MRI study. Neurobiol Dis 124, 93–107, https://doi.org/10.1016/j.nbd.2018.11.010 (2018).
Jullienne, A., Trinh, M. V. & Obenaus, A. Neuroimaging of Mouse Models of Alzheimer’s Disease. Biomedicines 10, 305, https://doi.org/10.3390/biomedicines10020305 (2022).
Igarashi, H. et al. Longitudinal GluCEST MRI Changes and Cerebral Blood Flow in 5xFAD Mice. Contrast. Media. Mol. Imaging 2020, 8831936, https://doi.org/10.1155/2020/8831936 (2020).
Gong, T. et al. MTE-NODDI: Multi-TE NODDI for disentangling non-T2-weighted signal fractions from compartment-specific T2 relaxation times. Neuroimage 217, 116906, https://doi.org/10.1016/j.neuroimage.2020.116906 (2020).
Bartzokis, G. et al. White Matter Structural Integrity in Healthy Aging Adults and Patients With Alzheimer Disease. Arch Neurol 60, 393–398, https://doi.org/10.1001/archneur.60.3.393 (2003).
Salat, D. H. et al. Age-related alterations in white matter microstructure measured by diffusion tensor imaging. Neurobiol Aging 26, 1215–1227, https://doi.org/10.1016/j.neurobiolaging.2004.09.017 (2004).
Tournier, J.-D. et al. MRtrix3: A fast, flexible and open software framework for medical image processing and visualisation. NeuroImage 202, 116137, https://doi.org/10.1016/j.neuroimage.2019.116137 (2019).
Veraart, J. et al. Denoising of diffusion MRI using random matrix theory. Neuroimage 142, 394–406, https://doi.org/10.1016/j.neuroimage.2016.08.016 (2016).
Kellner, E., Dhital, B., Kiselev, V. G. & Reisert, M. Gibbs-ringing artifact removal based on local subvoxel-shifts. Magnetic Resonance in Med 76, 1574–1581, https://doi.org/10.1002/mrm.26054 (2015).
Andersson, J. L. R., Skare, S. & Ashburner, J. How to correct susceptibility distortions in spin-echo echo-planar images: application to diffusion tensor imaging. Neuroimage 20, 870–888, https://doi.org/10.1016/S1053-8119(03)00336-7 (2003).
Tustison, N. J. et al. N4ITK: Improved N3 Bias Correction. IEEE Trans. Med. Imaging 29, 1310–1320, https://doi.org/10.1109/TMI.2010.2046908 (2010).
Basser, P. J., Mattiello, J. & LeBihan, D. MR diffusion tensor spectroscopy and imaging. Biophys. J 66, 259–267, https://doi.org/10.1016/S0006-3495(94)80775-1 (1994).
Zhang, H., Schneider, T., Wheeler-Kingshott, C. A. & Alexander, D. C. NODDI: practical in vivo neurite orientation dispersion and density imaging of the human brain. Neuroimage 61, 1000–1016, https://doi.org/10.1016/j.neuroimage.2012.03.072 (2012).
Veraart, J., Sijbers, J., Sunaert, S., Leemans, A. & Jeurissen, B. Weighted linear least squares estimation of diffusion MRI parameters: strengths, limitations, and pitfalls. Neuroimage 81, 335–346, https://doi.org/10.1016/j.neuroimage.2013.05.028 (2013).
Daducci, A. et al. Accelerated Microstructure Imaging via Convex Optimization (AMICO) from diffusion MRI data. Neuroimage 105, 32–44, https://doi.org/10.1016/j.neuroimage.2014.10.026 (2014).
Wang, Q. et al. The Allen Mouse Brain Common Coordinate Framework: A 3D Reference Atlas. Cell 181, 936–953.e20, https://doi.org/10.1016/j.cell.2020.04.007 (2020).
Avants, B., Tustison, N. J. & Song, G. Advanced Normalization Tools: V1.0. Insight. J. https://doi.org/10.54294/uvnhin (2009).
Raffelt, D., Tournier, J., Crozier, S., Connelly, A. & Salvado, O. Reorientation of fiber orientation distributions using apodized point spread functions. Magn. Reson. Med. 67, 844–855, https://doi.org/10.1002/mrm.23058 (2011).
Tournier, J., Calamante, F. & Connelly, A. MRtrix: Diffusion tractography in crossing fiber regions. Int J Imaging Syst Tech 22, 53–66, https://doi.org/10.1002/ima.22005 (2012).
Tournier, J., Calamante, F. & Connelly, A. Improved probabilistic streamlines tractography by 2 nd order integration over fibre orientation distributions. in Proceedings of the International Society for Magnetic Resonance in Medicine 1670. Wiley: New Jersey, USA (2009).
Raffelt, D. et al. Apparent Fibre Density: a novel measure for the analysis of diffusion-weighted magnetic resonance images. Neuroimage 59, 3976–3994, https://doi.org/10.1016/j.neuroimage.2011.10.045 (2011).
Gorgolewski, K. J. et al. The brain imaging data structure, a format for organizing and describing outputs of neuroimaging experiments. Sci Data 3, 160044, https://doi.org/10.1038/sdata.2016.44 (2016).
Ren, B. et al. A relaxation-diffusion MRI dataset of aging mouse brains at 9.4 Tesla. figshare https://doi.org/10.6084/m9.figshare.28433102 (2025).
Association, N. E. M. Determination of signal-to-noise ratio (SNR) in diagnostic magnetic resonance imaging. Report No. MS 1-2008 (R2014) (National Electrical Manufacturers Association, 2008).
Ni, H. et al. A Robust Image Registration Interface for Large Volume Brain Atlas. Sci Rep 10, 2139, https://doi.org/10.1038/s41598-020-59042-y (2020).
Denic, A. et al. MRI in rodent models of brain disorders. Neurotherapeutics 8, 3–18, https://doi.org/10.1007/s13311-010-0002-4 (2011).
Nie, X. et al. Diffusion MRI detects longitudinal white matter changes in the 3xTg-AD mouse model of Alzheimer’s disease. Magn Reson Imaging 57, 235–242, https://doi.org/10.1016/j.mri.2018.12.003 (2018).
Han, X. et al. High-resolution diffusion magnetic resonance imaging and spatial-transcriptomic in developing mouse brain. Neuroimage 297, 120734, https://doi.org/10.1016/j.neuroimage.2024.120734 (2024).
Jelescu, I. O. et al. Considerations and recommendations from the ISMRM diffusion study group for preclinical diffusion MRI: Part 1: In vivo small-animal imaging. Magn. Reson. Med. 93(6), 2507–2534, https://doi.org/10.1002/mrm.30429 (2025).
Acknowledgements
This work was supported by funding from the National Natural Science Foundation of China (Grant Numbers: U21A6005, 61971214, 82372079, 62201265) and the Guangdong Basic and Applied Basic Research Foundation (Grant Numbers: 2023A1515012093), Guangdong-Hong Kong Joint Laboratory for Psychiatric Disorders (Grant Numbers: 2023B1212120004).
Author information
Authors and Affiliations
Contributions
Protocol design: B.R., Q.T., X.Z.; Data collection: B.R., Q.T.; Data analysis: B.R., Y.W., Y.L., Y.B.; Preparation of manuscript: B.R., Q.T., Y.F, X.Z.
Corresponding authors
Ethics declarations
Competing interests
The authors declare no competing interests.
Additional information
Publisher’s note Springer Nature remains neutral with regard to jurisdictional claims in published maps and institutional affiliations.
Rights and permissions
Open Access This article is licensed under a Creative Commons Attribution-NonCommercial-NoDerivatives 4.0 International License, which permits any non-commercial use, sharing, distribution and reproduction in any medium or format, as long as you give appropriate credit to the original author(s) and the source, provide a link to the Creative Commons licence, and indicate if you modified the licensed material. You do not have permission under this licence to share adapted material derived from this article or parts of it. The images or other third party material in this article are included in the article’s Creative Commons licence, unless indicated otherwise in a credit line to the material. If material is not included in the article’s Creative Commons licence and your intended use is not permitted by statutory regulation or exceeds the permitted use, you will need to obtain permission directly from the copyright holder. To view a copy of this licence, visit http://creativecommons.org/licenses/by-nc-nd/4.0/.
About this article

Cite this article
Ren, B., Wu, Y., Liu, Y. et al. A relaxation-diffusion MRI dataset of aging mouse brains at 9.4 Tesla. Sci Data 12, 1797 (2025). https://doi.org/10.1038/s41597-025-06088-0
Received:
Accepted:
Published:
Version of record:
DOI: https://doi.org/10.1038/s41597-025-06088-0
