
Abstract
This dataset addresses the need for multimodal biomechanical recordings during over-ground walking, ramps, and stairs by synchronously capturing electromyographic (EMG), inertial (IMU), and plantar pressure data. We collected data from 45 adults (15 with unilateral transtibial amputation and 30 without amputation) who completed five standardized locomotor tasks: level walking, ramp ascent/descent, and stair ascent/descent. Each participant performed 50 supervised trials. Wireless EMG and IMU sensors (Delsys Trigno Avanti) measured muscle activation and kinematics, while intelligent insoles (XSENSOR) captured plantar pressure distribution. Raw data were saved in.hpf (EMG/IMU) and.XSN (pressure) formats, with processed outputs in.csv files. All data are organized by task and sensor type, including complete participant metadata. Key dataset outputs include time-normalized EMG amplitudes, segment kinematics, and pressure maps across terrains and populations. The dataset was validated technically and experimentally during the acquisition. This resource enables quantitative analysis of gait adaptation and supports machine learning for locomotion classification. Data are provided in accessible formats to foster reuse in biomechanics, rehabilitation engineering, robotics, and clinical gait research.
Background & Summary
Lower limb amputation significantly affects quality of life1, impacting their physical, emotional, and social functionality2,3. Despite technological advances, many of the existing prostheses, mostly passive4, do not adequately replicate the biomechanical behavior of the lost limb, limiting daily activities such as walking on irregular surfaces or climbing stairs5,6,7. An essential aspect in this context is the objective quantitative evaluation of gait patterns in amputees to detect abnormalities and develop new rehabilitation protocols and assistive prosthetic devices, customized to each subject8. At this point, it is also important to evaluate data from healthy individuals to quantify possible deviations of the gait pattern from different physiological profiles. Electromyographic, kinematic, and kinetic data provide complete motion analysis to describe human gait. Kinematic data include displacement and orientation of body segments, joint angles, and spatiotemporal parameters of gait9. Kinetic data include reaction forces of the foot and floor, moments, and distribution of pressure forces exerted by the foot, and kinetic and potential energy10,11,12. Muscle activation patterns are analyzed using electromyographic signals (EMG) associated with muscle fiber contraction, which can be recorded non-invasively using surface electrodes attached to the skin over muscle bellies13,14. Traditionally, this type of analysis is carried out in the laboratory using optical motion capture (OMC) systems15,16,17, which limits the ability to perform evaluations under more natural conditions9. However, in recent years portable sensors have been developed, such as inertial measurement units (IMU)18,19,20,21,22,23, which integrate accelerometers, gyroscopes and magnetometers, allowing the measurement of acceleration and angular velocity of body segments; electromyographic sensors13,24,25,26,27,28 allow recording the electrical activity generated by muscles, reflecting muscle activation patterns during dynamic tasks in real conditions. On the other hand, plantar pressure sensors11,12,23,29,30, commonly integrated into instrumented insoles, allow quantification of the distribution of loads and pressures along the surface of the foot during contact with the ground. The integration of these technologies has allowed out-of-laboratory analyzes to be performed, enabling biomechanical parameters of movement to be measured in real time and adapted to various locomotion activities, such as walking on flat surfaces, stairs and ramps21,22,24,31,32,33, which facilitates a more natural assessment of the user’s biomechanical behavior31.
The majority of studies related to gait analysis use only one source of biomechanical data, either signals (EMG), (IMU), or plantar pressure, thus limiting the comprehensive understanding of human movement. In the few cases where signal fusion is performed, it is usually between two sources21,23,25, but rarely are the three fundamental dimensions of motion analysis integrated simultaneously34. In addition, studies that manage to integrate these three technologies tend to focus on non-disabled populations24,26 or, when they address the case of amputees, focus predominantly on transfemoral amputee users12,20. In addition, most of these studies evaluate only a single locomotion task, such as walking on a flat surface or climbing stairs, without considering the functional variability involved in different types of displacement.
In recent years, several studies have explored multimodal sensing for amputee gait analysis. For instance, Gonzales et al.21 combined EMG and IMU sensors to classify locomotion modes in transtibial amputees using machine learning algorithms, achieving accuracies of 98.8% and 93.4% for SVM and LSTM models, respectively. Huang et al.35 recorded residual muscle activity in 12 transtibial amputees using surface EMG to investigate coactivation patterns during walking with passive prostheses. Barberi et al.24 evaluated 13 transfemoral amputees to decode walking tasks from a minimal EMG channel set, while Ghailassi et al.13 analyzed EMG parameters from 12 participants (including two transtibial amputees) walking at different treadmill speeds.
Because of these limitations, this study presents an efficient methodology for the collection of multimodal biomechanical data from the lower body: Fusion data of EMG, IMU, and plantar pressure. The purpose of this study is to collect electromyographic, inertial, and plantar pressure signals from 45 participants: 15 with unilateral transtibial amputation and 30 without amputation, during five locomotion tasks: walking on a flat surface, ascending and descending ramps, and stairs. This dataset36 includes data from both amputee and non-amputee participants, allowing for the analysis of variations in movement patterns across different standardized terrains and populations. This large sample size allows for the identification of variations in the movement patterns of people with and without transtibial amputation, crucial for the development of active prostheses that can adapt more efficiently to the demands of the terrain and specific tasks of the user21.
This dataset36 contains synchronized multimodal biomechanical signals, including electromyographic (EMG), inertial (IMU), and plantar pressure data collected over time. EMG signals are recorded in millivolts (mV) from surface electrodes placed on key muscles, providing a temporal representation of muscle activation patterns during various locomotion tasks. IMU data includes measurements of linear acceleration, angular velocity, and positional changes of body segments, captured over time to analyze movement dynamics. In addition, plantar pressure data is recorded through instrumented insoles, providing detailed pressure distribution over time, through the three key regions of the foot: the forefoot, midfoot, and rearfoot, providing a comprehensive analysis of how forces are distributed across the foot during different phases of walking, ramp, and stair tasks. This dataset36 will be of high utility to the academic community in the area of biomechanics, biomedical engineering, and rehabilitation, providing key inputs for the development of intelligent control systems for active prostheses23,30,37, based on the detection of physiological signals in real time. It is also relevant for understanding the functional adaptations of gait in both amputees and non-amputees. The dataset36 can be reused for studies focused on gait analysis, such as gait classification, computational modeling, and the development of new prosthetic control strategies.
Methods
Participants
The study was approved by the Research Ethics Committee for Life Sciences and Technologies of Pontificia Universidad Católica del Perú (approval number 197-2024-CEICVyT/PUCP) on 29 November 2024. All participants signed a written informed consent form approved by the Ethics Committee, authorizing their participation in the study and providing explicit permission for data sharing. All data36 were anonymized at the time of collection; the stored information does not contain names or any other personally identifiable information. To ensure privacy and confidentiality, each participant was assigned a unique identifier, and their identity was treated as strictly confidential at all times.
Participants were recruited by convenience sampling and consisted of adults between 18 and 60 years of age. They were divided into two groups. The first group included 15 transtibial prosthesis wearers (14 males and 1 female), with a mean age of 42 ± 16 years, body weight of 76 ± 16 kg, and height of 166 ± 5 cm. The second group comprised 30 non-amputee subjects (16 males and 14 females), with a mean age of 21 ± 1 years, body weight of 65 ± 12 kg, and height of 164 ± 8 cm. The sample size of amputees was determined considering the proportion of individuals with transtibial amputation in Lima, Peru, where most lower-limb amputations occur above the knee2. A convenience sampling method was used, as it is appropriate when participants must meet specific inclusion criteria and when recruitment is constrained by accessibility38,39. This approach has also been employed in comparable studies involving amputees, which reported similar or smaller sample sizes while obtaining relevant and high-quality EMG-based analyses13,21,24,35.
The recruitment of participants was carried out through multiple communication channels. In healthcare and rehabilitation institutions, flyers and informational announcements were distributed by institutional representatives, supported by explanatory phone calls and messages. Contact was also established with leaders of amputee associations and support groups. Similarly, in academic and university settings, recruitment was promoted through the distribution of flyers during academic talks, research events, and the university’s institutional email system. Social media platforms, especially Instagram, were also used to expand outreach. The recruitment materials included the purpose of the study, inclusion and exclusion criteria, location, contact information, and a QR code for participant registration.
Participants in each group were selected according to the inclusion and exclusion criteria listed in Tables 1, 2. In addition, basic measurements, including anthropometric data and prosthetic characteristics, were collected to confirm the proper functioning of the prosthesis during the trials. Participants with transtibial amputation primarily used two types of prosthetic sockets: TSB (Total Surface-Bearing) and PTB (Patellar Tendon-Bearing), which differ mainly in how they distribute weight across the residual limb. Table 3 presents detailed demographic and body measurements, as well as the specific prosthetic components used by each transtibial amputee. For non-amputee participants, demographic information and body measurements are provided in Table 4.
Acquisition systems
The experimental procedures were conducted using systems for multimodal signal acquisition. Each session involved two laptops running distinct acquisition systems for collecting electromyographic (EMG), inertial (IMU), and plantar pressure signals simultaneously.
EMG and IMU System. The system used Delsys Trigno Avanti Sensors to capture EMG and IMU signals concurrently with high precision and resolution. These non-invasive, wireless sensors were paired with EMGWorks Acquisition software for signal capture and EMGWorks Analysis for post-processing and analysis.
Instrumented Insole System. The system used XSENSOR Intelligent Insoles to measure plantar pressure. These non- invasive, portable, and wireless insoles are equipped with high-resolution sensors distributed in the three areas of the foot (rear-foot, mid-foot, and fore-foot). Real-time data collection and analysis were performed using the XSENSOR Foot & Gait software.
Experimental protocol
Three operators were involved in managing each acquisition session. The first operator was responsible for assessing participants’ movement patterns to determine eligibility, as well as evaluating the prosthesis of amputee participants to ensure its functionality. This operator also monitored the movement patterns of both groups of participants during the trials. The second operator handled participant communication, sensor placement, and presession instructions, including guidance on attire, informed consent, and device functionality. The third operator was tasked with preparing the testing environment, ensuring that all necessary equipment was available and functional. During sessions, this operator also managed the calibration and continuous monitoring of the EMG, IMU, and plantar pressure signals from start to finish.
-
1.
Calibration of the Systems. The first step involved calibrating the measurement equipment, including EMG sensors, IMUs, and plantar pressure insoles. The calibration of Delsys sensors was carried out according to the detailed procedures provided in the manufacturer’s guide, which includes frequency adjustments for both EMG and IMU signals, as well as configuration based on the specific body segment being evaluated. XSENSOR insoles, on the other hand, perform automatic calibration based on the initial pressure determined by the participant’s body weight.
-
2.
Signal Verification. Participants were asked to walk a distance of five meters as part of a controlled walking trial on a flat surface. This procedure was used to establish individualized activation thresholds for both acquisition systems, as these parameters varied between participants. The trial also served to identify and correct potential sensor placement errors and discrepancies in the initial calibration settings.
-
3.
Synchronization Record. Simultaneous recording was achieved by manually starting and stopping both systems at the same time using an external trigger. During post-processing, the files were time-aligned using the start timestamp.
-
4.
Test Environments. Three environments were defined for the experimental tests shown in Fig. 1 for data acquisition in five locomotion tasks: walking on a flat floor, ascending/descending stairs, and ascending/descending ramp.
Fig. 1 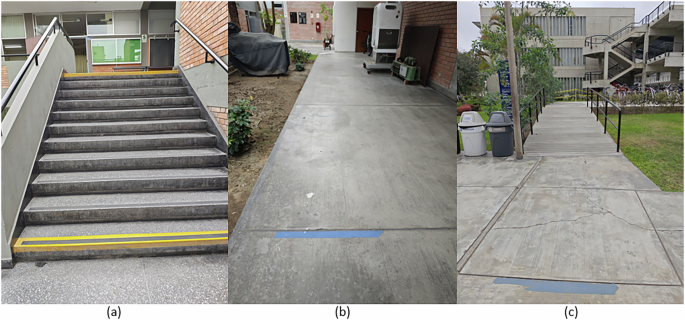
Environments for data acquisition: (a) Stairs, (b) Level Ground, and (c) Ramp.

Each locomotion task was repeated 10 times for analysis of the gait pattern: 10 trials on level ground; 20 trials on stairs (10 ascent, 10 descent); and 20 trials on the ramp (10 ascent, 10 descent), totaling 50 controlled trials per participant with and without transtibial amputation.
The tests were performed without external assistance; participants walked at a natural pace, pausing for three seconds at each transition between surfaces and at the end of each environment, to pause the test and avoid additional steps that would contaminate the data.
-
Level ground (10 m): A 10-meter walkway was marked at both ends with blue tape to delineate the start and finish of each trial.
-
Staircase (11 steps): A fixed staircase with 11 steps (16 cm riser, 29.5 cm tread). To simulate real-world transitions, participants walked an additional 1.70 m of level ground before ascending and 3.55 m after descending.
-
Ramp (6 m, 7 degrees): A six-meter inclined ramp at 7° preceded by 3.05 m and followed by 3.88 m of level ground to evaluate both the ascent and descent transitions.
Each locomotion task was repeated 10 times for a comprehensive analysis of the gait pattern: 10 trials on level ground; 20 on stairs (10 up, 10 down); and 20 on the ramp (10 up, 10 down), totaling 50 controlled trials per participant with and without transtibial amputation.
The trials were carried out without external assistance, allowing participants to walk at a natural pace. Upon crossing the finish line, each participant paused for three seconds before returning to the start for the next test to avoid contaminating the data with extra steps. Three-second pauses were also enforced at the beginning and end of each transition between surfaces.
-
5.
Data Preprocessing for IMU and EMG. Data preprocessing for IMU and EMG. Raw Delsys.hpf files were converted to MATLAB.mat using Delsys Utility (Delsys Inc., Natick, MA, USA). A custom MATLAB script then iterated over each participant and activity folder, loading every trial and building a tidy table as follows: (i) assignment of synchronized time vectors [Time_EMG], [Time_IMU]; (ii) reformatting the signal matrix into columnar form; (iii) removal of unused channels; and (iv) selection of the channels used downstream. Specifically, we retained four EMG channels of interest and IMU signals from three body segments (thigh, leg, foot), keeping their tri-axial accelerometer, magnetometer, and gyroscope streams [ACC.X], [ACC.Y], [ACC.Z], [GYRO.X], [GYRO.Y], and [GYRO.Z. The second script exported each table in.csv format and stored all files in a dedicated folder for further analysis.
-
6.
Data Preprocessing for plantar pressure. Files with extension.XSN containing raw plantar pressure data were generated using the Pro Foot & Gait software (XSENSOR Technology Corporation, Calgary, Canada). After each acquisition session, the data were exported directly from the software in the native.csv format. Each locomotion task was saved as an individual file, named according to the corresponding movement type (e.g., Walking, Ramp-Ascending, Stairs- Descending). Two types of.csv files were generated for each trial: one file containing temporal pressure characteristics, including peak pressure values, timing of force peaks, and pressure distribution across foot regions (forefoot, midfoot, and rearfoot); and a second file containing full-frame plantar pressure data over time, segmented by stance phases. All pressure-related files were stored in a dedicated subfolder within each participant’s data directory. The pressure values are recorded in kPa (kilopascals), with measurements segmented by stance phases for each trial. The flowchart shows the detailed procedure in this study, as seen in Fig. 2.
Fig. 2 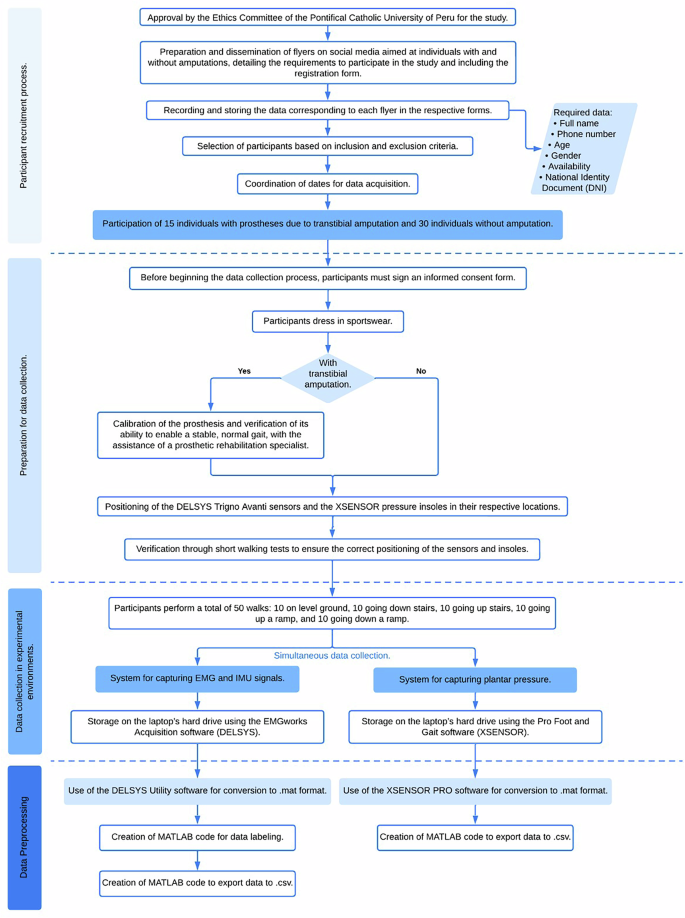
Flowchart outlining the complete data collection and preprocessing procedure. The flowchart provides a comprehensiveoverview of the study’s data collection process, from participant recruitment and ethical approval, through sensor placement and dataacquisition, to data preprocessing and exportation.

Data Records
All files are available online on a Figshare database36. Data are organized by participant folder, labeled as follows:
-
SNAxx: subject non-amputated (xx = 01… 15)
-
SWAxx: subject with transtibial amputation (xx = 01… 15)
Each folder contains data from two acquisition systems:
-
a)
Delsys Trigno Avanti (IMU and EMG):
-
.hpf – raw file with synchronized accelerometer, gyroscope, and EMG signals for each trial.
-
Delsys file-naming patterns: [IMU,EMG]SNAxx_yy.hpf / [IMU,EMG]SWAxx_yy.hpf
-
-
b)
XSENSOR Pro Foot and Gait (Plantar Pressure Insoles)
-
.XSN – raw file with the plantar pressure time series for each trial.
-
XSENSOR file-naming patterns: [PPRI]SNAxx_yy.XSN / [PPRI]SWAxx_yy.XSN
-
Where:
-
SNA / SWA = subject non-amputee or subject with amputee
-
xx = participant number (e.g. 01)
-
yy = trial number (01… 50)
The overall folder structure is shown in Fig. 3 and a detailed description of the file naming conventions, participant codes, and sensor types is provided in Table 5.

Overall folder and data structure. This hierarchical organization of the dataset shows the coding scheme and file-namingconventions used for plantar pressure (PPRI) and EMG-IMU data collected from participants with (SWA) and without (SNA) transtibial amputation.
Technical Validation
All measurement systems underwent rigorous technical validation before and during data acquisition. This included hardware calibration, anatomical positioning of sensors, and signal quality verification.
EMG-IMU Calibration
The Trigno Avanti Sensors were calibrated in two stages before each data collection session. First, all sensors were fully charged for three hours. Then, they were paired with the Delsys Base Station using magnetic activation, and the connection status was confirmed through the EMGworks Acquisition software interface. Once connected, a personalized sensor configuration was created for each participant, assigning sensors to specific anatomical locations. Pilot tests were performed to ensure that EMG signals met the minimum activation threshold for muscle contractions. During these tests, if any signal loss occurred or the threshold for muscle activation was not met, the sensors were repositioned. Only signals with confirmed muscle activation above the predefined threshold were retained for analysis.
EMG-IMU sensors placement
Delsys EMG sensors were placed in four specific thigh muscles to capture electromyographic signals: rectus femoris, biceps femoris, vastus lateralis, and adductor longus. The exact placement was determined by muscle palpation during specific voluntary movements, as described in the protocol. In addition, IMU sensors were placed on three anatomical segments: the thigh (integrated with the EMG sensor on the rectus femoris), the tibia, and the foot. All sensors were aligned parallel to the muscle orientation fiber or the longitudinal axis of the corresponding body segment to ensure optimal signal acquisition. A visual reference of the precise anatomical locations of the sensors for participants with transtibial amputation and non-amputated participants is provided in Figs. 4, 5, respectively.

Sensor placement for participants with transtibial amputation. EMG and IMU sensors from the Delsys Trigno Avanti systemwere placed on specific muscles (adductor longus, rectus femoris, vastus lateralis, and biceps femoris) and body segments (thigh,tibia, and third metatarsal).

Sensor placement for non-amputated participants. EMG and IMU sensors from the Delsys Trigno Avanti system were placed identically to the amputee group, positioned on the adductor longus, rectus femoris, vastus lateralis, biceps femoris, thigh, tibia, and third metatarsal, as indicated.
Data Captured by EMG-IMU sensors
The Delsys sensors simultaneously recorded EMG and IMU data. EMG signals were bandpass filtered between 20 Hz and 480 Hz, and key characteristics were extracted, including the mean absolute value (MAV), root mean square (RMS), standard deviation (SD), and waveform length (WL). IMU data included linear acceleration and angular velocity on the X, Y, and Z axes. Only signals that met the signal-to-noise ratio criteria of high signal quality, the absence of significant artifacts, and complete temporal synchronization between EMG and IMU during clearly segmented gait cycles were retained for analysis. Signals with noticeable artifacts, or where the muscle activation threshold was not reached, were excluded from the analysis.
Insole calibration
The XSENSOR Intelligent Insoles were calibrated, beginning with a full charge of 1.5 hours. Subsequently, the insoles were connected via Bluetooth to the Pro Foot & Gait software. Once connected, critical parameters such as sampling frequency (up to 150 frames per second) and sensitivity settings were configured to optimize the detection of plantar pressure during locomotor activities.
Insole placement
Insoles were inserted into each participant’s athletic shoes, ensuring complete coverage of key plantar regions: rear-foot, mid-foot, and forefoot. The external data transmitter was attached to the lateral side of the shoe using a metal clip, minimizing interference with natural gait patterns. A visual representation of the insole placement inside the shoe is shown in Fig. 6.

Insole: (a) XSENSOR intelligent insoles, (b) placement of insoles within the athletic shoe. The insole fully covers key plantarregions, including the rear-foot, mid-foot, and forefoot, with the external data transmitter secured to the lateral side of the shoe.
Data captured by insole sensors
The instrumented insoles recorded both spatial and temporal distributions of plantar pressure, within a pressure range of 1 to 128 psi (0.67 to 88.3 N/cm2) and an accuracy of ±10%. From these data, parameters such as peak pressure, average pressure, contact area, stance duration, and impulse per gait cycle were extracted. Only complete gait cycles with a high signal-to-noise ratio and free of movement artifacts or disconnections were included in the analysis. Trials where data loss or signal inconsistency was detected were excluded.
Data accuracy and reliability
The precision and reliability of the recorded signals were confirmed by pilot testing conducted before the main study. EMG and IMU signals were visually and computationally validated using EMGworks Analysis software to ensure replicability and consistency of muscle activation and kinematic patterns. Likewise, plantar pressure data were validated using Pro Foot & Gait software to verify that spatial and temporal distributions aligned with established biomechanical patterns. The pilot tests ensured that the thresholds for muscle activation were consistently met, and any data showing excessive loss or artifacts in the signal were excluded from the data set.
Usage Notes
EMG and IMU data
The multimodal biomechanical dataset36 presented in this study provides synchronized signals of electromyography (EMG), inertial measurement unit (IMU), and plantar pressure obtained from individuals with transtibial amputation and non-amputated adults during five locomotion tasks. The raw EMG and IMU data files are stored in.hpf format, which can be converted into MATLAB-compatible formats using the Delsys Utility software. The synchronized accelerometer, gyroscope, and EMG signals enable the analysis of the interactions between muscle activation and body movement during locomotion tasks. These data are suitable for developing algorithms related to prosthetic control, locomotion mode classification, and clinical gait analysis through speed and muscle activation.
Plantar pressure data
The plantar pressure recordings are stored in.XSN format, compatible with XSENSOR Pro Foot & Gait software for real-time biomechanical analysis. They can also be exported to.csv format for temporal evaluations of pressure and peak plantar pressures. Researchers can segment these recordings according to the stance phases to calculate parameters such as contact area, pressure-time integrals, and center of pressure trajectories. Therefore, the provided plantar pressure dataset36 is ideal for detailed studies comparing the impact of transtibial prostheses on gait biomechanics and foot loading patterns relative to non-amputated individuals.
Limitations and recommendations
Researchers and professionals can leverage this data fusion for various purposes, such as training machine learning models for locomotion task classification, identifying distinctive gait patterns, and developing adaptive prosthetic control systems. Additionally, clinical applications of this dataset36 include comparative analyses of muscle activation strategies, joint motion dynamics, and pressure distribution patterns across different terrains and populations. Likewise, this dataset36 is highly valuable for investigating functional gait adaptations in amputees, guiding the design of personalized prostheses, and optimizing rehabilitation protocols.
However, there are certain limitations to this dataset36. Despite including data from 45 participants (15 amputees and 30 non-amputees), the amputee subgroup remains relatively small. Furthermore, there are differences in stump conditions and prosthetic configurations, which may limit the generalizability of the results. Another limitation is that data acquisition was performed under controlled and supervised experimental conditions, which may differ from unsupervised settings. Moreover, the dataset36 was obtained using specific sensor systems (Delsys Trigno Avanti sensors for EMG and IMU data, and XSENSOR smart insoles for plantar pressure measurements), meaning that replicating or comparing results with different hardware configurations may require additional methodological considerations or different calibrations.
To effectively use and interpret the provided data, users are recommended to have prior experience with computational data analysis environments such as MATLAB or similar programs suitable for biomechanical signal processing and analysis. A solid understanding of fundamental biomechanical concepts, including EMG signal interpretation, gait phase identification, and kinematic and kinetic analyses. Furthermore, familiarity with multimodal data fusion and time-series analysis facilitates the interpretation of the dataset36.
The primary scope of this dataset is to provide a comprehensive, multimodal collection of high-quality, synchronized biomechanical signals, along with the necessary code for data processing and visualization. A limitation, however, is that it does not include full-scale analytical interpretations (e.g., joint kinetics). Nevertheless, the provided visualization scripts help bridge this gap by computing and displaying key descriptive metrics of interest to researchers, including statistical summaries of EMG activation and body-segment kinematic angles derived directly from raw IMU data. This provides a solid foundation for further biomechanical modeling.
Data availability
Dataset has been deposited to Figshare36.
Code availability
The MATLAB scripts used in this study are available on Figshare36. The repository includes three custom code and a license file per Springer Nature’s open code policy: (i) a preprocessing script to clean the data of Delsys and XSENSOR files into tables; (ii) an insole visualization script to load and generate animated plots of plantar pressure maps; and (iii) an EMG/IMU visualization script that plots all signals, automatically performs signal statistics, and calculates/plots body segment angles from raw accelerometer data.
References
Su, B.-Y. et al. A CNN-Based Method for Intent Recognition Using Inertial Measurement Units and Intelligent Lower Limb Prosthesis. IEEE Transactions on Neural Syst. Rehabil. Eng. 27, 1032–1042, https://doi.org/10.1109/TNSRE.2019.2909585 (2019).
Farro, L., Tapia, R., Bautista, L., Montalvo, R. & Iriarte, H. Características clínicas y demográficas del paciente amputado. Revista Medica Hered. 23, 240–243 (2012).
Leal-Junior, A. & Frizera-Neto, A. Chapter 3 - Gait analysis: overview, trends, and challengesThis chapter is carried out with the participation of Laura Susana Vargas Valencia. In Leal-Junior, A. & Frizera-Neto, A. (eds.) Optical Fiber Sensors for the Next Generation of Rehabilitation Robotics, 53–64, https://doi.org/10.1016/B978-0-32-385952-3.00011-1 (Academic Press, 2022).
ESSALUD. Prescripción de prótesis de miembro inferior (2018).
Srisuwan, B. & Klute, G. K. Locomotor Activities of Individuals with Lower Limb Amputation. Prosthetics orthotics international 45, 191–197, https://doi.org/10.1097/PXR.0000000000000009 (2021).
Soriano, J. B. et al. Global, regional, and national deaths, prevalence, disability-adjusted life years, and years lived with disability for chronic obstructive pulmonary disease and asthma, 1990–2015: a systematic analysis for the Global Burden of Disease Study 2015. The Lancet Respir. Medicine 5, 691–706, https://doi.org/10.1016/S2213-2600(17)30293-X (2017).
Adhaye, A. M. & Jolhe, D. A. Gait measurement methods: systematic review and comparative studies. J. Mech. Medicine Biol. 24, 2330002, https://doi.org/10.1142/S0219519423300028 (2024)
Abarca, V. E., Oshiro, G., Gonzales-Huisa, O. A. & Elias, D. Design exploration and kinematic validation of a transtibial prosthesis using a 2spu-ru parallel mechanism. Intell. Serv. Robotics https://doi.org/10.1007/s11370-025-00646-6 (2025).
Goldfarb, N., Lewis, A., Tacescu, A. & Fischer, G. S. Open source Vicon Toolkit for motion capture and Gait Analysis. Comput. Methods Programs Biomed. 212, 106414, https://doi.org/10.1016/j.cmpb.2021.106414 (2021).
Borg, J., Mizzi, S. & Formosa, C. Peak pressure data and pressure-time integral in the contralateral limb in patients with diabetes and a trans-tibial prosthesis. Gait & Posture 64, 55–58, https://doi.org/10.1016/j.gaitpost.2018.05.023 (2018).
Casado-Hernández, I. et al. The Effectiveness of Hard Insoles for Plantar Pressure in Cycling: A Crossover Study. Bioengineering 10, 816, https://doi.org/10.3390/bioengineering10070816 (2023).
Guner, S. & Alsancak, S. The Detection of Compensatory Movements in Gait by Evaluating Plantar Pressure in Trans- femoral Amputees. Appl. Sci. 13, 12719, https://doi.org/10.3390/app132312719 (2023).
Ghailassi, I. E. et al. Investigation of EMG Parameters for Transtibial Amputees While Treadmill Walking with Different Speeds: A Preliminary Study. IEEE Access 12, 27356–27367, https://doi.org/10.1109/ACCESS.2024.3360301 (2024).
Nurhanim, K., Elamvazuthi, I., Izhar, L., Capi, G. & Su, S. EMG Signals Classification on Human Activity Recognition using Machine Learning Algorithm. In 2021 8th NAFOSTED Conference on Information and Computer Science (NICS), 369–373, https://doi.org/10.1109/NICS54270.2021.9701461 (2021).
Wang, S. L., Civillico, G., Niswander, W. & Kontson, K. L. Comparison of Motion Analysis Systems in Tracking Upper Body Movement of Myoelectric Bypass Prosthesis Users. Sensors 22, 2953, https://doi.org/10.3390/s22082953 (2022).
Yang, U.-J., & Kim, J.-Y. Mechanical design of powered prosthetic leg and walking pattern generation based on motion capture data. Adv. Robotics 29, 1061–1079, https://doi.org/10.1080/01691864.2015.1026939 (2015).
Samala, M. et al. A dataset of optical camera and IMU sensor derived kinematics of thirty transtibial prosthesis wearers. Sci. Data 11, 922, https://doi.org/10.1038/s41597-024-03677-3 (2024).
Bastas, G., Fleck, J. J., Peters, R. A. & Zelik, K. E. IMU-based gait analysis in lower limb prosthesis users: Comparison of step demarcation algorithms. Gait & Posture 64, 30–37, https://doi.org/10.1016/j.gaitpost.2018.05.025 (2018).
Maqbool, H. F. et al. Gait asymmetrical evaluation of lower limb amputees using wearable inertial sensors. Heliyon 10, https://doi.org/10.1016/j.heliyon.2024.e32207 (2024).
Simonetti, E. et al. Gait event detection using inertial measurement units in people with transfemoral amputation: a comparative study. Med. & Biol. Eng. & Comput. 58, 461–470, https://doi.org/10.1007/s11517-019-02098-4 (2020).
Gonzales-Huisa, O. A., Oshiro, G., Abarca, V. E., Chavez-Echajaya, J. G. & Elias, D. A. EMG and IMU Data Fusion for Locomotion Mode Classification in Transtibial Amputees. Prosthesis 5, 1232–1256, https://doi.org/10.3390/prosthesis5040085 (2023).
Fradet, L., Alimusaj, M., Braatz, F. & Wolf, S. I. Biomechanical analysis of ramp ambulation of transtibial amputees with an adaptive ankle foot system. Gait & Posture 32, 191–198, https://doi.org/10.1016/j.gaitpost.2010.04.011 (2010).
Liu, D., Jin, Z. & Gambatese, J. Scenarios for Integrating IPS–IMU System with BIM Technology in Construction Safety Control. Pract. Period. on Struct. Des. Constr. 25, 05019007, https://doi.org/10.1061/(ASCE)SC.1943-5576.0000465 (2020).
Barberi, F. et al. Early decoding of walking tasks with minimal set of EMG channels. J. Neural Eng. 20, 026038, https://doi.org/10.1088/1741-2552/acc901 (2023).
Wang, Y., Cheng, X., Jabban, L., Sui, X. & Zhang, D. Motion Intention Prediction and Joint Trajectories Generation Toward Lower Limb Prostheses Using EMG and IMU Signals. IEEE Sensors J. 22, 10719–10729, https://doi.org/10.1109/JSEN.2022.3167686 (2022).
Moreira, L., Figueiredo, J., Fonseca, P., Vilas-Boas, J. P. & Santos, C. P. Lower limb kinematic, kinetic, and EMG data from young healthy humans during walking at controlled speeds. Sci. Data 8, 103, https://doi.org/10.1038/s41597-021-00881-3 (2021).
Sobh, K. N. M., Abd Razak, N. A. & Abu Osman, N. A. Investigation of EMG parameter for transtibial prosthetic user with flexion and extension of the knee and normal walking gait: A preliminary study. Proc. Inst. Mech. Eng. Part H 235, 419–427, https://doi.org/10.1177/0954411920985753 (2021).
Yousif, H. A. et al. Assessment of Muscles Fatigue Based on Surface EMG Signals Using Machine Learning and Statistical Approaches: A Review. IOP Conf. Series: Mater. Sci. Eng. 705, 012010, https://doi.org/10.1088/1757-899X/705/1/012010 (2019).
Giest, T. N. & Chang, Y.-H. Biomechanics of the human walk-to-run gait transition in persons with unilateral, transtibial, amputation. J. biomechanics 49, 1757–1764, https://doi.org/10.1016/j.jbiomech.2016.04.004 (2016).
Pană, C. F. et al. The Design of a Smart Lower-Limb Prosthesis Supporting People with Transtibial Amputation—A Data Acquisition System. Appl. Sci. 12, 6722, https://doi.org/10.3390/app12136722 (2022).
Vallabhajosula, S., Tan, C. W., Mukherjee, M., Davidson, A. J. & Stergiou, N. Biomechanical Analyses of Stair-climbing while Dual-tasking. J. biomechanics 48, 921, https://doi.org/10.1016/j.jbiomech.2015.02.024 (2015).
Protopapadaki, A., Drechsler, W. I., Cramp, M. C., Coutts, F. J. & Scott, O. M. Hip, knee, ankle kinematics and kinetics during stair ascent and descent in healthy young individuals. Clin. Biomech. 22, 203–210, https://doi.org/10.1016/j.clinbiomech.2006.09.010 (2007).
Camargo, J., Ramanathan, A., Flanagan, W. & Young, A. A comprehensive, open-source dataset of lower limb biomechanics in multiple conditions of stairs, ramps, and level-ground ambulation and transitions. J. Biomech. 119, 110320, https://doi.org/10.1016/j.jbiomech.2021.110320 (2021).
Lencioni, T., Carpinella, I., Rabuffetti, M., Marzegan, A. & Ferrarin, M. Human kinematic, kinetic and EMG data during different walking and stair ascending and descending tasks. Sci. Data 6, 309, https://doi.org/10.1038/s41597-019-0323-z (2019).
Huang, S. & Huang, H. Voluntary control of residual antagonistic muscles in transtibial amputees: Reciprocal activation, coactivation, and implications for direct neural control of powered lower limb prostheses. IEEE Transactions on Neural Syst. Rehabil. Eng. 27, 85–95, https://doi.org/10.1109/TNSRE.2018.2885641 (2019).
Abarca, V. E., Chavez, J., Eulogio, L., Viviano, C. & Elias, D. A. Multimodal biomechanical dataset of transtibial amputees and non-amputated adults performing five locomotion tasks. figshare https://doi.org/10.6084/m9.figshare.29856323 (2025).
Sun, J. & Voglewede, P. A. Powered Transtibial Prosthetic Device Control System Design, Implementation, and Bench Testing. J. Med. Devices 8, https://doi.org/10.1115/1.4025851 (2013).
Otzen, T. & Manterola, C. Sampling techniques on a population study. Int. J. Morphol. 35, 227–232, https://doi.org/10.4067/S0717-95022017000100037 (2017).
Hernández González, O. Aproximación a los distintos tipos de muestreo no probabilístico que existen. Revista Cuba. de Medicina Gen. Integral 37 (2021).
Acknowledgements
This research was funded by the Government of Peru through the National Program for Scientific Research and Advanced Studies (PROCIENCIA–CONCYTEC) under Contract No. PE501086900-2024-PROCIENCIA. The authors express their gratitude to all participants, all of whom provided written informed consent for their participation and for the open publication of their anonymized data for research purposes.
Author information
Authors and Affiliations
Contributions
J.C., V.E.A. and D.A.E. conceptualized the study. J.C. and V.E.A. designed the methodology and protocol. J.C. coordinated participant recruitment. J.C., M.M. and L.E. performed data acquisition. L.E., M.M. and J.C. conducted data curation. M.M., L.E. and J.C. developed preprocessing scripts and processed the data. M.M., L.E. and J.C. conducted technical validation and quality assessment. L.E., M.M. and J.C. generated visualizations and figures. J.C., V.E.A., M.M. and L.E. wrote the original draft. J.C., V.E.A., M.M. and L.E. reviewed and edited the final manuscript. V.E.A. and D.A.E. supervised the project.
Corresponding author
Ethics declarations
Competing interests
The authors declare no competing interests.
Additional information
Publisher’s note Springer Nature remains neutral with regard to jurisdictional claims in published maps and institutional affiliations.
Rights and permissions
Open Access This article is licensed under a Creative Commons Attribution-NonCommercial-NoDerivatives 4.0 International License, which permits any non-commercial use, sharing, distribution and reproduction in any medium or format, as long as you give appropriate credit to the original author(s) and the source, provide a link to the Creative Commons licence, and indicate if you modified the licensed material. You do not have permission under this licence to share adapted material derived from this article or parts of it. The images or other third party material in this article are included in the article’s Creative Commons licence, unless indicated otherwise in a credit line to the material. If material is not included in the article’s Creative Commons licence and your intended use is not permitted by statutory regulation or exceeds the permitted use, you will need to obtain permission directly from the copyright holder. To view a copy of this licence, visit http://creativecommons.org/licenses/by-nc-nd/4.0/.
About this article

Cite this article
Abarca, V.E., Chavez, J., Eulogio, L. et al. Multimodal biomechanical dataset from transtibial amputees and able-bodied adults across five locomotion tasks. Sci Data 13, 155 (2026). https://doi.org/10.1038/s41597-025-06472-w
Received:
Accepted:
Published:
Version of record:
DOI: https://doi.org/10.1038/s41597-025-06472-w
