
Abstract
Advanced Cyber-Physical Systems (CPS) that facilitate seamless communication between humans, machines, and objects are revolutionizing industrial automation as part of Industry 5.0, which is being driven by technologies such as IIoT, cloud computing, and artificial intelligence. In addition to providing flexible, individualized production processes, this growth brings with it fresh cybersecurity risks including Distributed Denial of Service (DDoS) attacks. This research suggests a deep learning-based approach designed to enhance security in CPS to address these issues. The system’s primary goal is to identify and stop advanced cyberattacks. The strategy guarantees strong protection for industrial processes in a networked, intelligent environment. This study offers a sophisticated paradigm for improving Cyber-Physical Systems (CPS) security in Industry 5.0 by combining effective data preprocessing, thin edge computing, and strong encryption methods. The method starts with preprocessing the IoT23 dataset, which includes utilizing Gaussian filters to reduce noise, Mean Imputation to handle missing values, and Min-Max normalization to data scaling. The model uses flow-based, time-based, statistical, and deep feature extraction using ResNet-101 for feature extraction. Computational efficiency is maximized through the implementation of MobileNetV3, a thin convolutional neural network optimized for mobile and edge devices. The accuracy of the model is further improved by applying a Chaotic Tent-based Puma Optimization (CTPOA) technique. Finally, to ensure secure data transfer and protect private data in CPS settings, AES encryption is combined with discretionary access control. This comprehensive framework enables high performance, achieving 99.91% accuracy, and provides strong security for Industry 5.0 applications.
Introduction
The rapid adoption of embedded and IoT devices in CPS began during the fourth industrial revolution and is accelerating in the fifth industrial revolution. This transformation is technology-driven, impacting the development approaches of all industries. The gadgets are fundamental components that serve as the interface between the physical and digital worlds, facilitating data collection processes and performing actions almost instantaneously1,2. Industry 5.0 is anthropocentric and revolves around advanced technology that incorporates physical and software systems to enhance human capabilities. Smart spaces are founded on this principle and the enabling technologies of these systems are embedded systems and IoT devices3,4,5. This turns out to be very productive since through integration of IoT devices in the manufacturing processes, it becomes possible to perform Dynamic and reconfigurable manufacturing operations by initiating the Cyber-Physical systems in IOT devices. All these Machines, Gadgets, and a host of other physical things also generate substantial data that the integration of these systems creating subsystems containing lots of data that needs to be analyzed and leveraged in improving the functionality of such physical things6,7. The strategy of Industry 5.0 will also be strengthened by advanced machine learning and AI technologies oriented toward predictive maintenance, anomaly detection, or real-time decision-making8,9. Real-time operation and performance in harsh conditions are essential in numerous sectors10. The list of abbreviations is manifested in Table 1.
Furthermore, CPS integrates embedded systems and Internet of Things (IoT) devices to achieve sustainability and resilience objectives in Industry 5.011,12. The technologies allow the monitoring and controlling of the resources, energy, and environmental impact ensuring that the operations of the enterprises become green. The embedded systems are in charge of monitoring such relevant variables in real time and assisting with minimizing wastes, downtimes, and maximization of efficiency in13,14,15operations. To increase efficiency and scalability, the existing method makes use of Synergetic Control’s dynamic stability and seamless control transitions. By integrating with Direct Torque Control (DTC) and Support Vector Machine (SVM), it maximizes torque and flux management, reduces ripples, and increases accuracy. This strategy outperforms current approaches in terms of efficiency and scalability for Industry 5.0 applications, guaranteeing quicker reaction times, lower energy losses, and flexibility in real-time industrial scenarios. The concept of Industry 5.0 prompts the notion of creating viable, green, and intelligent systems with embedded systems and the Internet of Things (IoT)16. The architecture of Industry 5.0 is illustrated in Fig. 1.

Industry 5.0 architecture.
Industrial Revolution 5.0 exists in the field of embedded and IoT devices, in which the emphasis is on the augmentation of human abilities, rather than replacing them. This set of technologies is based on the so-called"human-in-the-loop” concept, meaning endowing such systems with human-level knowledge and tools and allowing for the implementation of any decision in a timely and effective manner. Advanced interfaces, real-time data visualization, and effective communication assist the workers in performing certain activities more accurately and in a short time17. Constant surveillance predicts and averts potential problems, ensuring a safer working environment. There’s a fusion of man and technology in Industry 5.0 that is largely made possible facilitated by embedded and IoT devices making the practices in the industries imaginative and innovative18. These devices outfitted on the factory premises in equipment and surrounding structures will execute deep learning techniques to analyze and interpret this enormous amount of data almost instantaneously. Revolutionizing this area of operation will be possible only with such complete automation and integration of various functions; maintenance and control will become predictive and adaptive respectively leading to higher efficiency of operations and resilience of the system19. As deep learning enables embedded and IoT systems to recognize patterns, identify anomalies, and make decisions, it draws a parallel to Industry 5.0’s end-user-centric design principles and allows industrial settings to become more intelligent and flexible20. In CPS, industrial process management and control are greatly aided by Supervisory Control and Data Acquisition (SCADA) systems28. These systems, especially in Industry 5.0, are vulnerable to cyberattacks due to their interconnection with IoT devices and other digital infrastructure29. Data integrity, privacy, and system availability can all be negatively impacted by security flaws in SCADA systems, which can result in disastrous breaches30,31,32. To avoid interruptions and provide secure, reliable operations in industries, SCADA security in CPS must be improved. For SCADA systems to be protected and CPS environments to remain intact, modern security measures like deep learning-based threat detection must be integrated33.
According to Al Haddar and his associates21, the primary aim of the study is to define and illustrate the a data gathering approach for the study purposes, including sample design, analysis and tools, and tools for adherence to ethical standards. Practically, this study utilized a mixed-method design combining qualitative and quantitative research, to provide a comprehensive understanding of the different aspects of the growth of Islamic education in Society 5.0 in South Kalimantan. The results were not as applicable to other areas or situations because they only focused on Islamic higher education establishments in South Kalimantan. Adel, A22 examined the integration of smart cities with Industry 5.0, highlighting the technological transformation of built environments. This included: cyber-physical systems, drones, fog computing, deep learning, green energy, digital investigation, information security, and artificial intelligence. The role of Industry 5.0 in smart cities has been assessed especially in its effectiveness towards advanced user interaction, management and analytics, business process automation, and security. However, it may not fully represent real-world challenges or consider contextual and regional variations.
According to Pistolesi et al.23 proposed an AI system to analyze worker postures in repetitive tasks, using inertial data from smartwatches and LiDAR. This system estimates upper and lower body postures relative to ISO 11,226 standards. It might overlook the complexity of various work surroundings and activities since it only evaluates posture in standardized tasks. Furthermore, the system’s reliance on LiDAR data and smartwatches may encounter difficulties in real-world situations because of environmental conditions, equipment availability, or calibration issues.
Vacchi et al.24, using a case study from a ceramic tile manufacturing company, have also tested the P-TSA methodological framework within the life-cycle perspective, based on ISO 14,040. Considering therefore the value chain concept, seven main activities were recognized for conducting a technical sustainability assessment in three areas of impact: IOA, TQ, and OP. The three generic metrics that formed the basis for the identification of the metrics under each of the effect areas included technology-related measures such as stock coverage rate, output quality ratio, and efficiency measures. These metrics were combined and expressed in a constructed index called a technical effect subindex. All three sub-indices were combined to form a Process Technological Sustainability Index. However, this model is limited to ceramic production and lacks testing in large-scale, real-world implementations. Hamouda, D25. proposed a novel framework together with with three models: a cGAN-based model for data augmentation, fine-tuning of local Critics for adversarial robustness, and a cyber threat targeting model. It might not accurately capture the variety of IIoT environments found in the real world. Furthermore, even if the method improves detection accuracy, it has not yet been evaluated in large-scale, real-time industrial situations.
In 2021, Khan et al.26 proposed the PC-IDS framework a privacy-preserving architecture using hybrid machine learning for SPNs. It had two main parts: an intrusion detection element that used a probabilistic neural network based on particle swarm optimization to detect and identify malicious events, and a data pre-processing part that cleaned and altered raw data to accomplish privacy conservation. The UNSW-NB15 and Power System datasets were used to assess the framework’s performance. The results of the experiments showed how well it protected SPN data and identified anomalies. The Power System dataset showed 96.03% DR and 0.18% FPR, whereas the UNSW-NB15 dataset showed 95.91% DR and 0.14% FPR. It makes use of two publicly accessible datasets, which could not adequately represent the variety and complexity of actual Smart Power Networks (SPNs). Furthermore, there has been no testing of the framework’s performance in dynamic, large-scale applications with real-time data.
In 2024, Khan et al.27 presented the Fed-Inforce-Fusion model a FL-based IDS for IoMT networks. The latent correlations in medical data were discovered through the use of a reinforcement learning technique. Then, a federated learning system was created to allow dispersed SHS nodes to work together to privately train an extensive IDS model. Furthermore, a fusion/aggregation approach was used to dynamically involve participating clients in the federation process, improving detection performance and reducing communication overhead. This method successfully integrated enhanced intrusion detection capabilities with privacy preservation. It might not adequately convey the intricacies and practical difficulties of applying the Fed-Inforce-Fusion concept in various, extensive IoMT networks. Additionally, the model’s scalability and computational efficiency when used on medical IoT devices with limited resources have not been assessed.
The integration of qualitative and quantitative approaches in methods is is applicable, but limitations exist. Qualitative methods are subjective and less generalizable. Methodological frameworks like TSA focus on data capture and processing. It is worth noting that one of the concerns regarding conditional generative adversarial networks is that they can generate individual data samples that are conditioned on specific attributes. These methods do not have that limitation as they provide more refined and varied sets of data. Still, the obstacles imposed by the efficiency of implementation and quality of available data were not bypassed.
The lack of effective security models for dynamic cyber threats in Industry 5.0’s networked CPS environment is a research gap. Existing frameworks lack real-time decision-making and cannot handle diverse data from embedded and IoT devices. Traditional techniques are resource-intensive for edge devices. Integrating deep learning for threat mitigation and anomaly detection is challenging. This study proposes a lightweight, real-time, and flexible deep learning-based security architecture for CPS in Industry 5.0. This work is motivated by the growing complexity of CPS in Industry 5.0, where edge computing, IoT, and AI increase security risks. Traditional measures may not protect against sophisticated attacks. Deep learning enables real-time threat detection and mitigation, ensuring CPS reliability and safety. The goal is to enhance security in Industry 5.0 using deep learning. The primary goals of this research are as follows:
-
The study presents a robust data preprocessing pipeline for the IoT23 dataset, that includes Min-Max Normalization for data standardization, Mean Imputation (MI) for handling missing values, and Gaussian filters for noise reduction. This contributes to improved data quality, enhancing the accuracy.
-
A multifaceted feature extraction method that incorporates statistical, time-based, and flow-based characteristics is suggested. The study also utilizes ResNet-101’s deep feature extraction capabilities, which improve the system’s capacity to identify intricate patterns and behaviors in data.
-
MobileNetV3 is employed to maximize edge device performance, which is essential for CPS Industry 5.0 applications. The model is ideal for real-time data processing at the edge without sacrificing accuracy because of its low computing cost, quick inference time, and economical use of resources.
-
The study presents a unique optimization method CTPOA, to enhance MobileNetV3’s accuracy and efficiency. By fine-tuning the model’s hyperparameters, this technique enhances generalization and lowers computing overhead.
-
The study incorporates discretionary access control techniques and AES encryption to secure data in CPS contexts. In Industry 5.0 applications, this guarantees the protection of private data, reducing the risk of cyberattacks while preserving system integrity.
In Sect. 2, we will introduce the methodology proposed for efficient and secured data transmission. In Sect. 3, we will provide results and a discussion of the proposed model over the existing models. In Sect. 4, a discussion of the study is described. Finally, Sect. 5 will be devoted to the conclusion and future work.
Materials and methods
The research work suggests a comprehensive strategy for improving performance and security in CPS applications, especially in Industry 5.0. To ensure high-quality, reliable data for more precise predictions, it starts with a strong data preprocessing pipeline for the IoT23 dataset that uses Gaussian filters to decrease noise, Mean Imputation (MI) to handle missing values, and Min-Max Normalization to standardize the data. In addition to deep feature extraction utilizing ResNet-101, the feature extraction procedure integrates statistical, time-based, and flow-based characteristics, which enhances the system’s capacity to recognize intricate patterns and behaviors. MobileNetV3 is used to maximize performance on edge devices. It is ideal for real-time data processing in CPS Industry 5.0 applications because it offers low computational cost, quick inference, and effective resource usage. Additionally, the work presents a new optimization method- CTPOA to optimize the hyperparameters of MobileNetV3, improving accuracy, generalization, and computing overhead. The incorporation of AES encryption and discretionary access control measures further protects data in CPS situations by reducing the risk of cyberattacks and preserving system integrity.
The system uses flow-based, time-based, and statistical data to identify various forms of DDoS attacks, including volumetric, protocol, and application layer attacks. In environments with restricted resources, MobileNetV3 guarantees effective real-time detection. The Chaotic Tent-based Puma Optimization (CTPOA) fine-tunes parameters to increase model accuracy. Additional security levels are provided via AES encryption and discretionary access control. Overall, by successfully recognizing and thwarting a variety of attack scenarios, the system improves cybersecurity. The complexity of the proposed model is determined by three important components: data preprocessing, deep learning model operations, and optimization. Data preprocessing, comprising Gaussian filtering, mean imputation, and Min-Max normalization, has a temporal complexity of \(\:O(N\bullet\:F),\) where \(\:N\) is the number of samples and \(\:F\) is the number of features. The depthwise separable convolutions used in the MobileNetV3 model, which is intended for edge devices, reduce complexity to \(\:O(N\cdot\:C\cdot\:H\cdot\:W),\) where \(\:C\), \(\:H\), and \(\:W\) stand for the number of channels, height, and width of the input, respectively. ResNet-101 feature extraction raises complexity to \(\:O\left(N\bullet\:H\bullet\:W\bullet\:L\right),\:\)where \(\:L\) is the model’s depth. The complexity of CTPOA, an optimization strategy that iterates across the population and feature dimensions, is \(\:O(N\cdot\:D\cdot\:T\)), where \(\:D\) is the number of dimensions and \(\:T\:\)is the number of iterations. When \(\:M\) is the number of data blocks, AES encryption adds to the \(\:O\left(M\right)\:\)complexity. Deep learning training and optimization account for the majority of the model’s difficulty, which scales with dataset size, model depth, and iterations. Space complexity is proportional to the amount of storage needed for the dataset, model parameters, and optimization population. The structure of the proposed system is illustrated in Fig. 2.

Architecture of the proposed Methodology.
Data collection
IoT23-dataset
The dataset named IoT23 is a real asset to security solution analysts and developers working on IoT devices, providing network traffic data. This dataset encompasses different kinds of IoT devices’ normal traffic such as sensors, actuators, real-time control, and home appliances. It has been annotated to represent a range of attack modes including DDoS, port scan, and botnet herding and consists of both normal and attack traffic. Each entry records the packet sizes, times of inter-packet flows, and the types of protocols used.
Pre-processing
The first stage of processing the IoT23 dataset is filtering which is used to eliminate noisy and irrelevant data, cleaning to select only relevant features, and data standardization to ensure uniform scaling. This model uses the combination of Gaussian filters, Mean Imputation, Min-Max normalization, and to preprocess the raw data collected from the IoT23 database. This process ensures that the input data to the deep learning models is devoid of noise, is normalized, and has no missing values, improving the quality of input and hence prediction accuracy.
Gaussian filter
In the specific context of the IoT23 dataset, Gaussian filtering corresponds to the smoothing techniques used to reduce noise and fluctuations in time series data regarding network traffic features. In contrast to the pixel operations involved in image processing, filtering in this case will be extended to sequential data points in features such as packet sizes, interpacket arrival times, or flow durations. In other words, the smoothed value is obtained by averaging the data points within a localized window of consideration, with the weighing function being a Gaussian. In contrast to the simple moving average where all the points in the window have an equal contribution, here the Gaussian filter assigns high weight to data points that lie close to the center of the window, thus keeping out noise while retaining the relevant trends. In particular, in working with a time series of the feature, say interpacket arrival time, for example, the Gaussian filter will smooth the sudden changes in packet timing. This will minimize any noise introduced due to temporary network anomalies or other irregular events and make patterns or trends within the network traffic visible. The noise reduction process is determined in Eq. (1).
Where: \(\:H\left(t\right)\)represents the weight applied to the data point at time \(\:t\), \(\:\sigma\:\)is the SD of the Gaussian distribution (the higher \(\:\sigma\:\), the higher the degree of the relevant data). The Gaussian filter is applied by convolving the time-series data with the Gaussian function, so that there is an averaging effect on the data points weighted according to the Gaussian function.
Mean imputation (MI)
The MI approach is considered one of the simplest methods used to address the missing data within the noise removed (after gaussian filtering) IoT23 database. As a result, this process replaces the missing value (When network traffic data, such as packet sizes or flow durations, contains missing values) with the mean of the available values of the database. It maintains the data’s integrity, making sure the deep-learning model receives full dataset for training. The mean imputation for handling missing values is determined in Eq. (2).
Where \(\:m\) signifies the number of observed (non-missing) values of data points,, while \(\:{y}_{j}\)representing the observed values.
Min-max normalization
Min-Max Normalization is used on the IoT23 data set for scaling all numerical features, such as packet sizes or inter-packet arrival times, into a common range, typically [0,1]. This is very important to resist the potential unwanted influences of features on the deep learning model since those features may differ in scale. In addition, this enables stable and efficient training of the model by making all features compatible. The mix-max 2ormalization is determined in Eq. (3).
Where: \(\:y\) indicates the original value (acquired after imputation), \(\:{min}\left(y\right)\)and \(\:{max}\left(y\right)\)represents the minimum and maximum values of the feature (acquired after MI), \(\:y{\prime\:}\)indicates the scaled value(final pre-processed outcome).
Feature extraction
Feature extraction is defined as the extraction of useful information from pre-processed network traffic data that could be found in the IoT23 dataset. This is done to convert raw data into a model-friendly format for efficient evaluation by the deep learning model. Statistical, time-based, flow-based, and deep learning-derived features are extracted for the purpose in this study. Instead of using those features individually, the characteristics of network traffic data behavior are combined into a comprehensive representation before feeding them onto the deep learning model.
Flow-based features
Flow-based features that are extracted from an IoT23 dataset, are the flow duration, packet count, and bytes per flow from network traffic flows. They are crucial for identifying patterns that distinguish normal network behavior from that of malicious activities (like DDoS attack). The definition of flow-based features relies on the packets transmitted between a source and destination within a specified time frame. These features are crucial for distinguishing between the normal behavior from the hostile one.
-
Flow Duration: The duration of a network flow, indicating the time spent in a specific communication session. This feature helps assess, whether the flow behavior is normal or potentially malicious.
-
Packet Count (per Flow): The total number of packets exchanged within a single network flow. Anomalous traffic may exhibit statistically higher or lower packet counts compared to normal traffic.
-
Bytes (per Flow): The total number of bytes transferred during a network flow. This feature helps identify excessive or minimal data transfer, which can indicate anomalies.
-
Packets per Second (PPS): The rate of packet transmission within a network flow. High PPS values can indicate denial-of-service attacks.
-
Bytes per Packet (BPP): The average number of bytes per packet within a network flow, providing insights into packet size distribution.
Time-based features
Time-based features extracted from the pre-processed IoT23 dataset, such as inter-packet arrival time, active time, and idle time help in detecting temporal anomalies that can signify malicious activity, like timing irregularities in communication patterns. Such features are effective in identifying such temporal anomalies in the data generated from the network.
-
Inter-packet Arrival Time: Time difference between packets belonging to the same flow and, with variable lengths of the intervals, this property can symbolize an abnormality due to irregular traffic flow.
-
Active Time: total duration for a connection. Bursty traffic is expected to show much higher or lower values of active time as compared to normal behavior in the given network.
-
Idle Time: The time that a connection goes inactive. When such intervals of idle times become too long in comparison with the normal pattern of network operation, it may be suggestive of some malicious endeavors.
Statistics features
Statistical features like the mean, variance, skewness and kurtosis from the pre-processed IoT23 dataset will help quantify the distribution of packet sizes and thus identify abnormal traffic behaviors, associated with specific attacks.
-
Moments (Mean and Variance of Packet Sizes): The average and variance of packet sizes within a flow, characterizing the packet size distribution and aiding in traffic classification.
-
Skewness and kurtosis statistics: Higher-order statistical measures that quantify the asymmetry and “tailedness” of the packet size distribution, respectively. Abnormal values of skewness or kurtosis may indicate specific attack patterns.
Feature fusion is employed to complement the information revealed by flow-based, time-based, and statistical features extracted from the IoT23 dataset. It helps in integrating those diverse features into a single representation, thus making the model capable of complex pattern definition and anomaly detection in network traffic. The construction of this single, higher (dimensional) vector was accomplished by concatenating feature vectors corresponding to each category, including flow, time, and statistical. The fused feature vector provides a holistic view of traffic across both temporal dynamics and statistical properties, hence improving the precision of anomaly detection. The input to the deep learning model (ResNet-101) is the fused feature vector, allowing it to be learned from a richer and more informative representation of the data. This fusion method becomes important in understanding the complex relationships of dependence that are found between the different facets of network traffic and create a more suitable robust type of detection of cyberattacks.
Deep feature extraction using resnet-101
Following feature fusion, the combined feature vector from the IoT23 dataset is fed into the ResNet-101 model for deep feature extraction. ResNet-101 is employed because of its excellent ability to extract deep and hierarchical features that detect complex patterns indicative of cyberattacks from network traffic. The ResNet-101 architecture consists of five major convolutional modules and one hundred convolutional layers, followed by an average pooling layer and a dense layer. The shortcut connections are meant to cope with the degradation problem that normally arises with increasing network depth. In the case of a standard configuration of the binary classification, the cross-entropy instead is incorporated into the logical cross-entropy loss term as in Eq. (4):
The ground truth as well as projected values for the \(\:{j}^{th}\)training database is indicated by \(\:{h}_{j}\)and \(\:{q}_{j}\). The CNN model backpropagates the loss value \(\:{k}_{\left({h}_{j},{q}_{j}\right)}^{d}\)and gradually optimizes its parameters (weights and biases) until it converges to a solution. Figure 3 illustrates the framework of ResNet-101 for deep feature extraction.

Architecture of ResNet-101.
The anomaly score measures how much data points deviate from typical behavior patterns following the extraction of deep features from the IoT23 dataset using ResNet-101.
Anomaly score based on distance metrics
The anomaly score measures how “far” the data is from a set of normal behavior patterns in the pre-processed IoT23 database. It uses distance-based measures to assess how different a given network flow or packet is from the predetermined baseline traffic characteristics. Mahalanobis distance is a common distance metric that varies based on the feature space. The Mahalanobis distance metric accounts for the correlations of the data set, which is particularly useful when the features are correlated and have different scales. The anomaly score using Mahalanobis distance is determined as per Eq. (5).
Here. \(\:x\) and \(\:y\) are the data points, and \(\:{S}^{-1}\) represents the inverse covariance matrix of the dataset. Following anomaly score computation based on distance metrics, the resulting feature vectors from the IoT23 dataset are fed into MobileNetV3.
Lightweight MobileNetV3 for edge computation
MobileNetV3 has been selected for this study because of its computationally efficient and lightweight design, which makes it perfect for resource-constrained edge devices, which are typical in Industry 5.0 Cyber-Physical Systems (CPS). MobileNetV3 employs depthwise separable convolutions, linear bottlenecks, and Squeeze-and-Excitation (SE) blocks to drastically lower model size and computational complexity while preserving high performance, in contrast to conventional convolutional neural networks (CNNs), which demand a substantial amount of processing power. In CPS, where resources at the edge are limited and quick decisions are crucial, this is especially crucial for real-time anomaly detection and security threat mitigation. Furthermore, MobileNetV3 has proven to be more robust and capable of handling complex tasks with minimal computational load in related domains, such as mobile and Internet of Things applications, where it has been successfully applied to tasks like object detection, face recognition, and visual asymmetry detection. MobileNetV3’s success in these domains suggests that it will enhance CPS security by processing massive amounts of data effectively for attack identification and anomaly detection without overloading edge devices.
MobileNetV3 is built to be a compact & performant CNN model for mobile and edge use cases. It also leverages some of the advancements made in MobileNetV1 and V2, while also achieving some improvements in terms of processing and time efficiency. The input data is subjected to a standard convolutional layer with a considerably larger kernel size. These include a series of depthwise separable convolutions interleaved with linear bottlenecks. Each convolution operation consists of several stages of depthwise convolutional operation that applies a single filter for each channel \(\:X\) for the input tensor and which is output after depthwise convolution called \(\:{X}_{dw}\)convoluted tensor.
Equation (6) is followed by a pointwise convolution (\(\:1\times\:1\) convolution to combine channels) as defined in Eq. (7), in which
Linear bottleneck layers include a linear layer without non-linearity to help maintain the representational capacity of the model. Moreover, Squeeze-and-Excitation (SE) blocks are used to recalibrate channel-wise feature responses, allowing the network to focus on more informative features. The squeeze operation is applied as given in Eq. (8), in which \(\:S\) represents a vector representing the global average pooling of the input tensor \(\:X\).
Equation (9) defines the excitement operation, in which \(\:{W}_{1}\) and \(\:{W}_{2}\) specify the learning parameters, and \(\:\sigma\:\) signifies the sigmoid activation function.
The scaling operation is explained in Eq. (10), in which \(\:{X}^{{\prime\:}}\) stands for the output of the SE block after scaling the input \(\:X\) with the excitation vector \(\:Z\).
The final layer ends with a few fully connected (FC) layers or a global average pooling layer, followed by a classification head (sigmoid layer) as shown in Eq. (11), in which \(\:\sigma\:\left(X\right)\) means to sigmoid function applied to \(\:X\).

MobileNetV3 architecture.

Lightweight model with Quantization and Pruning architecture.
Thus, MobileNetV3 integrates all these strategies in a manner that achieves a good level of accuracy while minimizing the computational resources used. This makes it very appropriate for use at the edges where there are limited computational devices. The introduction of depthwise separable convolutions, linear bottlenecks, and SE blocks helps to minimize the size and computation of the model without performance deterioration. The fundamental structure of MobileNetV3 is illustrated in Fig. 4. Figure 5 shows the lightweight Architecture of the proposed model. The parameters and their corresponding values are shown in Table 2.
-
Model Quantization.
Quantization is reducing the number of bits used for the model’s weights and activations (e.g., converting 32-bit floating-point values to 8-bit integers). This reduction assists in decreasing model size and simultaneously accelerating the inference speed by utilizing the hardware optimized for the lower-bit procedures. The main conceptual contribution of quantization is to reduce the memory storage and computation requirements for deep learning models so that they can be effectively utilized on edge devices where resources are limited, a setting very common in Cyber-Physical Systems (CPS). Generally, quantization allows for somewhat diminished precision of the presented model; in return, quantization preserves an acceptable level of accuracy of the model that makes it an important optimization technique for edge applications.
Regarding the quantization of a weight tensor (\(\:V\)) with the floating-point values, the values are converted to lower-bit integers as shown in Eq. (12).
Where: \(\:{V}_{int}\)represents the quantized weight tensor, \(\:{V}_{float}\) represents the original floating-point weight tensor, \(\:{min}\left({V}_{float}\right)\) as well as \(\:{max}\left({V}_{float}\right)\)remains the minimum as well as maximum values within \(\:{V}_{float}\), \(\:a\) serves as the number of bits utilized for quantization. Enhances the inference performance by incorporating integer-optimized hardware.
-
Model Pruning.
Pruning reduces the complexity of a model by eliminating neurons or weights that are below a predefined threshold. This makes the model more computationally efficient without sacrificing important features by lowering the number of parameters. Pruning is appropriate for real-time applications since it speeds up inference and lowers computing costs. Up to 50% of the model’s size can be decreased using this method without noticeably affecting performance. Pruning makes it possible for lightweight, quicker models that function well on devices with limited resources in the context of CPS security. Some of the techniques under pruning include the process of removing some of the least significant weights or neurons in the model. This strategy helps cut down the number of variables required as well as the number of computations that need to be made, which improves the model’s performance. Of these, the most widely used are the magnitude pruning and the organized pruning. The magnitude Pruning Equation (utilized in this research) is given by Eq. (13).
Where: \(\:V\) indicates the original weight tensor, \(\:V{\prime\:}\)represents the trimmed weight tensor, a threshold the specified number below which weights are pruned. It effectively Saves the model size and also the computation required to predict the target variable. However, this model contains an entropy loss function as stated in Eq. (14).
Where: \(\:{x}_{ld}\) indicates the ground truth, \(\:{\widehat{x}}_{ld}\) represents the anticipated probability of class \(\:d\)for the\(\:{j}^{th}\) sample, \(\:M\) represents the number of samples, \(\:D\) represents the number of classes. In an Industry 5.0 environment, aided by quantization and pruning, the lightweight design of MobileNetV3 supports the scaling of the system to cope with increasing volumes of data while maintaining light loads on edge devices. Distributed edge computing further accelerates data processing to ensure low latency and high efficiency. After performing the process of feature extraction, calculation of distance and the initial stages of processing on MobileNetV3, the model performance gains a further boost via Chaotic Tent-based Puma Optimization (CTPOA) algorithm.
Fine-tuned using chaotic Tent-based Puma optimization (CTPOA)
CTPOA is one of the variants of the Puma Optimization Algorithm, an optimization technique that draws inspiration from the hunt behavior of pumas. This POA-enabled procedure essentially manages a balanced exploration or exploitation trade-off that becomes pertinent in optimizing the highly complex and high-dimensional parameter space of a deep learning model such as MobileNetV3. These features and abilities lead to a computationally light algorithm capable of running in highly resource-constrained environments such as edge devices. The convergence speed and accuracy of the algorithm are further enhanced by the chaotic tent map, in particular, making it suitable for efficiently fine-tuning models in a highly dynamic Industry 5.0 environment.
The CTPOA algorithm initializes a population of pumas in the search space with arbitrary locations, which represent potential solutions to the optimization problem to be solved. Then it sets values for its parameters, such as control variables, acceleration factors, and maximum iterations. A fitness function is defined to evaluate the different solutions, which typically corresponds to the loss function of the deep learning model in question (MobileNetV3 in this case). The fitness function allows us to assess how fit each puma present in the population is, in terms of the quality of the candidate solution. Within this context, the fitness function defined in Eq. (15) serves to determine the minimization of the loss function of MobileNetV3:
POA is a metaheuristic algorithm inspired by the pumas’ hunting and social behavior in the wild.
Stalking behavior
In this phase, the pumas change their positions in the search space in the direction of the prey (i.e., the best solution found so far) defined in Eq. (16)
Where: \(\:{Y}_{j}\left(r\right)\)represents the position of the \(\:{j}^{th}\)puma at iteration \(\:r\), \(\:{Y}_{best}\left(r\right)\)represents the best solution found so far, \(\:{t}_{1}\)and \(\:{t}_{2}\)are random numbers in the range [0, 1], \(\:\alpha\:\)and \(\:\beta\:\) are control variables.
Hunting behavior
Puma cats actually rush forward on better speed, cutting the prey insightfully so that K increases, as expressed in Eq. (17).
Where: The puma’s velocity is represented by \(\:{W}_{j}\left(r\right)\), where \(\:\gamma\:\) and \(\:\delta\:\) are acceleration factors \(\:{t}_{3}\) and \(\:{t}_{4}\) random standards within the range [0, 1].
Pouncing behavior
According to equation number (18), pumas perform a fast pounce on their prey.
Where: \(\:{Y}_{prey}\) represents the prey’s position, whereas \(\:\eta\:\) is a pouncing factor that determines the amplitude of the jump. The processing algorithm will iterate through these phases, updating the positions until a termination criterion is met (e.g., maximum generations or convergence in space fitness).
Chaotic tent map
The chaotic tent map combines this nonlinearity and unpredictability to prevent the algorithm from trapping in local minima, thus improving exploration. It is mathematically defined as shown in Eq. (19)
Where: \(\:{y}_{m}\)represents the system’s state at iteration \(\:m\), \(\:b\) denotes a parameter that normally lies in the range (0,1). The Tent Map provides a sequence of variables within the interval [0,1] that can display chaotic behavior based on \(\:b\).The final solution is the best position found after all iterations. Table 3 shows the pseudocode of the proposed CTPOA.
Advantages of CTPOA:
-
The chaotic tent map greatly improves convergence speed and prevents premature convergence to local optima.
-
CTPOA balances the exploration of the search space with exploitation of promising solutions.
-
Effective in computational efficiency: it is light in computation, suitable for edge devices.
-
CTPOA is robust under complex, high-dimensional optimization problems.
-
As fine-tuning specificity, CTPOA excels at fine-tuning the parameters of the already trained MobileNetV3 model.
Following the anomaly detection and classification performed by MobileNetV3, fine-tuned by CTPOA, the security of the processed data within the Cyber-Physical System (CPS) is further enhanced using AES encryption and Discretionary Access Control (DAC).
AES encryption discretionary access control for data security
AES encryption is effective against DDoS attacks because it guards against illegal access and data manipulation, guaranteeing data confidentiality and integrity in CPS. Discretionary Access Control (DAC) ensures that only authorized users can interact with vital systems by restricting access to sensitive data. By limiting user access and safeguarding communication, the AES and DAC work together to protect CPS from outside threats. AES (Advanced Encryption Standard) is one of the most used encryption techniques that secure data with the help of a symmetric key. It was created through the United States NIST in 2001 to succeed the DES and is considered to be fast, secure, and efficient. In CPS scenarios, the confidentiality and integrity of sensitive data are guaranteed by the combination of AES encryption and discretionary access control (DAC). AES is a popular, quick, and reliable encryption system that is essential for protecting data sent over potentially weak networks. AES encryption’s computational complexity causes latency, which impact real-time applications, particularly when handling massive amounts of data. This effect causes responses to time-sensitive operations to be delayed in contexts with limited resources, such as edge devices. AES-128 reduces this delay without compromising security.
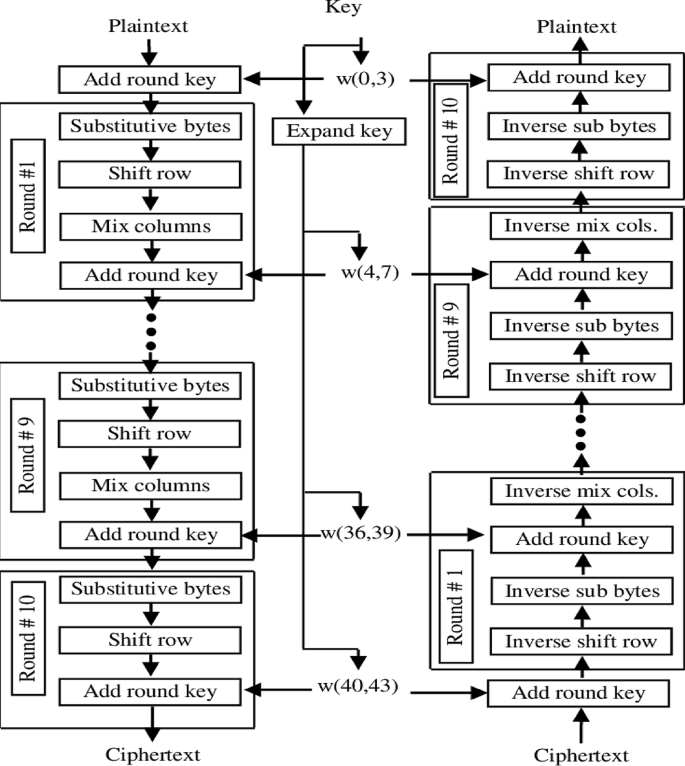
AES operates on 128 binary digits of data as well as can take key sizes of 256 bits. The encryption process involves several transformations and the amount of these transformations hangs on the key scope – 10 for the 128-bit key, 12 for the 192-bit key, as well as 14 for the 256-bit key. Every round has multiple operations, such as Each round has multiple operations, such as:
✰ SubBytes: Strategy in which a non-linear substitution step replaces every byte in the block by an S-box or substitution box.
✰ ShiftRows: A transposition step cyclically shifting the rows of the state.
✰ MixColumns: Combines the columns in the state to provide diffusion.
✰ AddRoundKey-Step in which one round key derived from the original cryptographic key is added.
Decryption reverses these steps to recover the plaintext.
Security of AES
AES is considered highly safe and is the standard method of encryption used in many different applications from the protection of data in government communications to the encryption of data on consumer devices. Its security is based on its ability to resist certain types of attacks that are known as cryptanalytic, for example, linear and differential ones. The several key size variations make it difficult for an attacker to guess the correct key therefore preventing brute force attacks. Figure 6 shows the AES workflow.
Architecture of AES.
The proposed system’s security framework is validated using formal and informal security evaluations. ProVerif, a tool for formal analysis, is employed to confirm the integrity, confidentiality, and authentication of the cryptographic protocols, specifically the AES encryption applied to the processed data. ProVerif uses applied π-calculus to model the AES encryption and data flow, testing for vulnerabilities such as data leaks or unauthorized access to the outputs of MobileNetV3. Additionally, Scyther is used to display attack traces in finite sessions, assessing protocol security against risks like replay or man-in-the-middle attacks, ensuring the secure transmission of the model’s predictions and optimized parameters. These formal analysis tools work together to guarantee that the communication and cryptography protocols are secure and resilient to rigorous examination. For informal analysis, threat modeling is conducted to identify potential hazards, including DDoS attacks, spoofing, and insider threats that could compromise the data processed by MobileNetV3. The system’s durability under severe conditions is tested through simulations, validating the efficacy of AES encryption and Discretionary Access Control (DAC) measures in realistic attack scenarios. This dual-layered strategy, combining formal verification and informal testing, strengthens the security validation of the entire system, ensuring the protection of the data and insights derived from the optimized MobileNetV3 model.
Discretionary access control (DAC)
Discretionary Access Control (DAC) is a prevalent access control model that enhances the security of information systems, including those processing data from MobileNetV3 and optimized by CTPOA. DAC controls user access to information resources based on their identity and the permissions assigned by the resource owner. In the context of our system, this means that access to the outputs of MobileNetV3, the optimized parameters from CTPOA, and the underlying data within the IoT23 dataset is managed based on user roles and permissions.
This model is among the primary and most flexible access control architectures, allowing the owner to control access to resources and specify their usage. Under the DAC system, control access permissions for any resource (whether it is a file, folder, database entry, or in this case, the results of the deep learning model) rests solely on the owner or creator of that resource. Users are either allowed or disallowed to access content based on the owner’s discretion. The permissions are typically categorized as follows:
-
Read: Allows users to view the contents of the resource, such as the classification results from MobileNetV3.
-
Write: Allows users to modify or delete the resource, such as updating optimized parameters from CTPOA.
-
Run: Allows users to execute the resource, such as running a script that utilizes the model’s outputs.
-
Full Control: Grants users the authority to alter permissions and take ownership of the resource, encompassing all other permissions.
Discretionary Access Control provides a user-centric approach to data security, ensuring that only authorized individuals can access and manipulate the sensitive data and model outputs generated by the system. This is crucial for maintaining the integrity and confidentiality of the insights derived from MobileNetV3 and CTPOA, especially in resource-constrained edge environments.
The scalability of the proposed algorithm in handling the increasing number of IoT devices and high data volumes in CPS settings remains an important consideration. Table 4 shows the summary of the proposed method with its advantages and limitations. While MobileNetV3 ensures computational efficiency for edge devices, its performance in large-scale networks with diverse devices and dynamic data traffic needs further analysis. The Chaotic Tent-based Puma Optimization (CTPOA) may face challenges with increased parameter tuning complexity in extensive deployments. Additionally, the preprocessing pipeline’s computational overhead could become a bottleneck as data scales up. Future research should test the system’s performance in bigger, actual CPS networks to assess its scalability.
Interpretability and explainability of the model’s recommendations
To foster understanding and trust in the deep learning-based security model’s recommendations, interpretability and explainability are paramount. Our model generates actionable recommendations for mitigating cyber risks in CPS by providing insights into its decision-making process.
Specifically, after the initial feature extraction using ResNet-101 and the subsequent processing by MobileNetV3, this study employs techniques like Class Activation Mapping (CAM) to visually represent the input data features that most significantly influenced the model’s predictions. This allows users to understand why the model made a particular decision, enhancing transparency.
Moreover, the CTPOA-guided optimization method provides additional insight into the model’s behavior by enabling us to trace the impact of specific hyperparameters on the model’s output. This allows for a deeper understanding of how the model’s performance is affected by different parameter settings.
By integrating these explainability techniques, beyond simply identifying and mitigating risks, our model fosters trust and provides valuable insights for practical applications. This facilitates a clearer comprehension of the recommendation-generation process, making the model more accessible and reliable for users in real-world CPS environments.”
Results
The proposed CPS-based security model was implemented using Python. For validation, the model utilized the standard IoT23 dataset. The dataset was divided into training, validation, and testing sets in an approximate 60/20/20 ratio, as pre-defined by the dataset’s host. This partitioning was based on the volume of generated logs and log activity, with the key distinction that only the testing set contained ransomware samples. Additionally, to evaluate the model’s performance under varying data distributions, the dataset was further split into training and testing sets using 70:30 and 80:20 ratios.
Evaluation metrics
The metrics used for comparing the proposed with existing work are accuracy, precision, recall, specificity, encryption, etc. The formulation for evaluation metrics is determined using Eqs. (20–23).
-
Accuracy: It is the proportion of correctly predicted instances (both positive and negative) out of the total instances.
-
Specificity: It measures the proportion of actual negatives that are correctly identified as such. It helps evaluate how well the model identifies the negative class.
-
Sensitivity: It measures the proportion of actual positives that are correctly identified by the model. It is particularly important in scenarios like cyber-attack detection where we want to catch as many attacks as possible, even if it means sometimes falsely identifying normal behavior as an attack.
-
F-Measure: It is the harmonic mean of Precision and Sensitivity. It provides a balance between the two metrics, considering both false positives and false negatives and is especially useful when there is an uneven class distribution.
Performance and comparison analysis
The efficiency of the proposed model is discussed and validated in this section. Figure 7 illustrates the training and validation on the IoT23 dataset. Figures 7(a) and (b) display the accuracy and loss respectively.

Training and validation of the Proposed Model for (a) Accuracy and (b) Loss.
To achieve a compact model, training was carried out for 8 epochs. During this, the model obtained an extraordinary training accuracy of 99.45%, which speaks well of its performance on training samples. High accuracy indicates the model learned the patterns from the given training data of IoT23 fairly well. During the training, the ever-decreasing training loss-from the ordinates of the model predictions and true labels-was also monitored. As expected, the training loss was on a steady decline throughout the training epochs, indicating improvement within the model. This means that the lower the loss, almost better the predictions converge. The model was evaluated for generalization ability and overfitting with the help of validation accuracy and loss. High accuracy and low loss on both training and validation datasets over 8 epochs strongly suggested that there is no overfitting of the model onto training data. The aforementioned phenomena suggest that the model would remain robust for real-world applications, especially in CPS security contexts using similar data as the IoT23 dataset. In Fig. 8, the graph shows the ratio of Encryption time (ET) to Decryption time (DT) to represent the efficiency of the implemented security framework with respect to AES Encryption and Decryption.

Comparison of Proposed and Other models for (a) ET, and (b) DT.
The achieved performance can be ascribed to the prevailing conditions of the Encryption Time (ET), being the time that elapses between taking plaintext and running it through specific encryption methods to generate a ciphertext message. ET forms an important metric by means of which the effectiveness of any encryption design is evaluated. Reducing the encryption time becomes very important in real-time applications. This should, however, be balanced with the program’s security requirements to render it a fair avenue of protection against unauthorized access. Decryption Time (DT) is the total time absorbed by a data transformation technique to translate ciphertext into human-readable plaintext. The DT, again, is dependent upon the complexity of the encryption algorithm, the amount of data being decrypted, and the processing power available at decryption devices. Figure 9 thus provides a comparison of the proposed model trained-and-tested on the IoT23 dataset with existing techniques. The performance accuracy of the proposed model is 31.65%, 37.85%, 34.32%, and 35.41% higher than that of InceptionV3, EfficientNet, ShuffleNet, and NASNet, respectively, as shown in Fig. 9(a). In Fig. 9(b), it can be seen that given precision is in favor of the proposed model: 18.65% over InceptionV3, 19.88% over EfficientNet, 21.51% over ShuffleNet, and 24.32% over NASNet. This represents a greater percentage of correct classification of instances from the IoT23 dataset by the proposed model than by the models compared against, confirming the overall superiority of the proposed model. The reason for these improvements is many-dimensional. First, the proposed model operates on the architecture of MobileNetV3, a model type designed for resource-constrained devices, thus enabling it to successfully carry out the task in the IoT23 dataset with network traffic characteristics. Second, the use of Chaotic Tent-based Puma Optimization (CTPOA) enabled the fine-tuning of many of the model parameters, thus improving the accuracy and precision. Because CTPOA maintains a balance between exploration and exploitation, it allows the model configurations to achieve optimal values, thus improving the model performance for complex pattern recognition in the IoT23 dataset. Moreover, the strong feature extraction process, which combines flow-based, time-based, statistical, and deep learning features, enhances the well-rounded understanding of network traffic characteristics the model possesses. The full suite of features considered for the given nature of the IoT23 dataset ensures that the model distinguishes normal behavior from malicious behavior. Improvements are derived from test results in which the proposed model was compared against baseline models such as InceptionV3, EfficientNet, ShuffleNet, and NASNet, based on each of these evaluation metrics. Similarly, the proposed model demonstrates superior performance regarding the sensitivity, specificity, and F1 score, as illustrated in Figs. 9(c), 9(d), and 9(e), respectively. This strong performance attests to the efficacy of the proposed model in providing security in the CPS Industry 5.0 environment when applied in the analysis of network traffic data from datasets such as IoT23.

Comparison of Proposed and Existing Techniques for (a) Accuracy, (b) Precision, (c) Sensitivity, (d) Specificity, and (e) F1-Score.
Table 5 reveals a comprehensive analysis of performance indicators for several models such as the Digital Twin model (DT), Privacy-Conserving Intrusion Detection System (PC-IDS), Fed-Inforce-Fusion model (FIF), and Artificial Intelligence-induced Constructive Resilience Model (AI-CRM) which have been trained from 70% of the data. The proposed model proves its superiority by outperforming all the other models with 99.91% accuracy, 93.65% precision, 95.72% sensitivity, 97.5% specificity, and 95.69% F1-score achieved during its performances captured from the model. These authentic metrics show how much accurate the model is to both classes’ positive and negative, thus providing it reliability and effectiveness for the objective in mind. On top of that, the proposed encryption and decryption time is about 4.5 s for encryption and 3.3 s for decryption. These turns out to manifest great difference compared to those of the other models. The DT model, on the other hand, has good metrics with more than an average accuracy of 95.30%, but longer encryption and decryption times of 5.8 s and 5.4 s, respectively. The well-known trustworthy PC-IDS model, which is devoted purely to privacy, gives also a fair fate lower than that of the proposed model because encryption takes 5.1 s and decryption 8.2 s. So are the FIF and AI-CRM models, which show somewhat similar behavior, with the difference being the level of accuracy along with a significantly longer encryption and decryption time. The AI-CRM model also keeps 6 s as decryption time. Such kinds of comparisons further indicate that the best-performing model is also very well in terms of accuracy and classification giving in securing the most efficient encryption and decryption processes for better security and computational efficiency.
When comparing the performance indicators of different models trained on 80% of the IoT23 data, the results are shown in Table 6. The performance of the proposed model stands out in all metrics, having the best accuracy of 99.95%, with 94% precision, 96.1% sensitivity, 97.9% specificity, and 96% F1 score. These indicate that the model excels at classifying positive and negative cases within the IoT23 dataset. Also, further security computations are done efficiently by the proposed model. It consumes 4.9 s for encryption and 3.7 s for decryption; both highlight the precision and effectiveness of the model. The Digital Twin (DT) model achieved around acceptable accuracy at 96.5%. At the same time, it has slower encryption (6 s) and decryption times (5.63 s) with slightly lower precision (92.3%), sensitivity (94.8%), and specificity (95.35%) than the proposed model. Although the Privacy-Conserving Intrusion Detection System (PC-IDS) model has presented good metrics and achieved an accuracy of 95.8%, it consumes slightly longer for encryption (5.35 s) and requires a very long time for decryption, at 8.6 s. The Fed-Inforce-Fusion (FIF) and the Artificial Intelligence-induced Constructive Resilience Model (AI-CRM) show marginally lower overall performances but have significantly longer encryption and decryption times. Most notably, the AI-CRM model consumes the longest time for decryption, that is, 6.281 s. The proposed model is superior to all other competitors because of several reasons. First, it makes use of the lightweight yet very effective architecture called MobileNetV3, especially optimized for edge computing regions such as where IoT23 is analyzed. Secondly, incorporating Chaotic Tent-based Puma Optimization (CTPOA) ensures fine tuning of parameters within the model as well as greater efficacy in classification accuracy. The ability of CTPOA to navigate through complex spaces makes the model more competent in adapting to the patterns unique to the IoT23 dataset. The model derives an even better anomaly detection as it also expresses holistic network traffic representation through complete feature extraction processes, including flow-based, time-based, statistical, and deep learning features. It provides a reasonable compromise in a trade-off between classification performance and computational efficiency, but best in its class for CPS security applications with network traffic workloads such as that found in the IoT23 dataset.
Analysis on complexity and robustness
A comparative analysis of different models is given in Table 7, based on some of the important metrics related to computational complexity, robustness, and performance with respect to Cyber-Physical Systems (CPS) security. The Proposed Model (MobileNetV3 + CTPOA) has been proven to be more efficient and robust compared to the existing techniques, which makes it an ideal choice for real-time CPS applications in Industry 5.0.
The Proposed Model (MobileNetV3 + CTPOA) has the lowest complexity of all; it is only 1.8 GFLOPs, making it very computationally light and suitable for edge devices in CPS environments. On the other hand, the AI-CRM requires much more complexity at 3.8 GFLOPs, and FIF has the same ability at 3.5 GFLOPs, making both of them inefficient in real-time applications as they consume much more processing power. The DT35 model (3.2 GFLOPs) also has high complexity compared to the proposed model, hence higher cost of computation. Lower GFLOPs mean lowering energy use and faster inference times, making MobileNetV3-based solutions best for use under Industry 5.0. According to this Proposed Model, it is determined to be the best in terms of the least inference time (4.5 ms), which is needed for real-time attack detection in cyber-physical systems. The AI-CRM has the highest inference time of 10.5 ms, which makes it unfit for real-time application requiring fast threat-seeking. The lower inference time speaks for better real-time performance and quick response to the cyber threat. The Proposed Model ensures minimal energy consumption (6.2 mJ/sample) and is often deployed in battery-powered applications in CPS systems. AI-CRM will consume maximum energy (14.1 mJ/sample), rendering it less effective for edge deployment applications. Less energy means prolonged uptime for operation for CPS devices.
The drop in accuracy for the Proposed Model with adversarial attacks is the least, at 1.8%, proving superior robustness towards cyber threats, while AI-CRM exhibits 6.1% drop in accuracy; hence making it most vulnerable to adversarial attacks. The strength of robustness is augmented by the incorporation of CTPOA optimizations and AES encryption thereby thwarting attack vectors. The Proposed Model has the least encryption time of 4.5 ms using an AES encryption optimized with discretionary access control. AI-CRM has the highest encryption time of 6.8 ms, therefore rendering it an inefficient approach to real-time security of CPS. The Proposed Model guarantees low decryption delay (3.3 ms), permitting rapid data access in real-time CPS environments. PC-IDS (8.2 ms) and FIF (9.0 ms) have a considerably higher decryption delay that is detrimental in latency-sensitive applications. The Proposed Model has the lowest FPR (0.25%), which means high detection reliability. The AI-CRM has the highest FPR (3.0%), indicating a greater propensity for false alarms.
The Proposed Model has the minimum size of 14 MB, thereby ensuring maximum efficiency at the edge deployment. AI-CRM has the largest model size (32 MB), thereby making it less suited for resource-constrained devices. The Proposed Model has the least training time of 42 s/epoch, which makes it feasible for rapid training and adaptation, whereas AI-CRM takes the maximum of 72 s/epoch for training, thus consuming more computational resources. The Proposed Model (MobileNetV3 + CTPOA) always outperforms all others on efficiency, security, and robustness, thus making it suitable for Industry 5.0 CPS applications.
Discussion
Receiver Operating Characteristics or ROC curve is a two-dimensional representation of binary classification on the basis of changing thresholds for this classifier. It plots TPR (True Positive Rate) against FPR (False Positive Rate) at threshold levels, showing the accuracy with which the model can distinguish between positive and negative cases in the IoT23 dataset. The better will be the relationship of the ROC curve with the upper left corner of the graph thus indicating a better performance for any model in particular. The value of area under curve AUC measures the ability of the model to separate classes, and an AUC score of 0.98 is quite laudable, given that it illustrates good discrimination between the positive and negative classes of IoT23. AUC score is higher than both positive and negative errors at the various thresholds, indicating the strong reliability, accuracy, and trustworthiness of the model. This means that the model is, therefore, very good for the task of detection on network traffic anomalies which exist within the IoT23 dataset. There are a number of reasons that can be attributed to the exceptional quality of the ROC and AUC. The first will be the very robust feature engineering, wherein the processes of extraction from the IoT23 dataset are flow-based, time-based, statistical, and deep learning. With these, one can build rich representations of network traffic characteristics, which help the model discriminate well between normal and anomalous patterns. Besides, MobileNetV3, which is edge computing optimized, ensures that most of the inherent data for network traffic in the IoT23 dataset is processed efficiently. Moreover, the model is well fine-tuned to the patterns of the IoT23 dataset through the use of Chaotic Tent-based Puma Optimization (CTPOA) for model parameter tuning. In utilizing MobileNetV3 and optimization techniques like CTPOA, the model runs efficiently in resource-constrained environments typical of edge devices analyzing IoT23 data in industrial settings. Furthermore, AES encryption and DACs form the security wall of the CPS network from threats due to cyber or deferred access and lay a security blanket over confidential data and businesses due to cyber threats. Figure 10 shows the ROC curve for this research as applied to the IoT23 dataset. The model’s accuracy at 99.91%, being trained and tested against IoT23, validates its capability of real-time identification and mitigation from complex cyberattacks, such as DDoS.

ROC curve.
Conclusion
This study proposed a simple but highly effective deep learning-based architecture aimed at securing Cyber-Physical Systems (CPS). This framework offers a completely multi-staged approach to the major security issues with CPS-from data capture and preprocessing, where the raw data from embedded sensors is cleaned and its significant characteristics-flow, time-, statistical, and deep-are extracted using ResNet-101. This was also to bring the entire deployment on resource-constrained edge devices, utilizing MobileNetV3 as a lightweight deep learning model which optimized performance through quantization and pruning techniques. Further performance optimization was attained through an algorithm based on Chaotic Tent-based Puma Optimization Algorithm (CTPOA) that adjusted the parameters of the model for efficiency and effective data processing. Robust data protection was ensured with AES encryption and Discretionary Access Control (DAC)-the security of sensitive information and the protection of operational integrity. The model was verified using rigorous evaluation on the IoT23 dataset. The model has demonstrated extreme achievements in performance enhancement compared to baseline models by achieving 31.65% improved efficiency over InceptionV3, 37.85% over EfficientNet, 34.32% over ShuffleNet, and 35.41% over NASNet. These results also mark great both classification accuracy and efficiencies related to classifying complex cyberattacks, such as DDoS, in real-time. Even with such strong praiseworthy aspects of this study, it still recognizes challenges in deep learning models, mainly in their black box nature and the constant need for retraining to meet the evolving nature of cyber threats. Future works ought to dwell on improving the interpretability of the decisions taken in the model, thus examining different access control models and enhancing data protection with even more sophisticated cryptographic measures, such as post-quantum cryptography. All these innovations will strengthen the security and resiliency of CPS networks against future cyber threats moving forward, ensuring their reliability in Industry 5.0 environments.
Data availability
Data Availability: The datasets used in this study are publicly available as follows: Dataset : The BETH Dataset, used for the validation of the proposed CPS-based security model, is publicly available and can be accessed at https://www.kaggle.com/datasets/katehighnam/beth-dataset. The dataset is utilized in accordance with its licensing agreements.
References
Rani, S. & Srivastava, G. Secure hierarchical fog computing-based architecture for industry 5.0 using an attribute-based encryption scheme. Expert Syst. Appl. 235, 121180 (2024).
Hamouda, D. New Technologies for Security and Privacy Issues in the Era of Industry 5.0 (Doctoral dissertation). (2024).
Verma, A. et al. Blockchain for industry 5.0: vision, opportunities, key enablers, and future directions. Ieee Access. 10, 69160–69199 (2022).
Chander, B., Pal, S., De, D. & Buyya, R. Artificial intelligence-based internet of things for industry 5.0. Artif. intelligence-based Internet Things Syst., 3–45. (2022).
Jain, D. K. et al. Enabling unmanned aerial vehicle borne secure communication with classification framework for industry 5.0. IEEE Trans. Industr. Inf. 18 (8), 5477–5484 (2021).
Pant, P. et al. Using machine learning for Industry 5.0 efficiency prediction based on security and proposing models to enhance efficiency. In 2022 11th International Conference on System Modeling & Advancement in Research Trends (SMART) (pp. 909–914). IEEE. (2022), December.
Raja Santhi, A. & Muthuswamy, P. Industry 5.0 or industry 4.0 S? Introduction to industry 4.0 and a peek into the prospective industry 5.0 technologies. Int. J. Interact. Des. Manuf. (IJIDeM). 17 (2), 947–979 (2023).
Ayub, M. F. et al. Secure consumer-centric demand response management in resilient smart grid as industry 5.0 application with blockchain-based authentication. IEEE Trans. Consum. Electron. (2023).
Jan, M. A. et al. Lightweight mutual authentication and privacy-preservation scheme for intelligent wearable devices in industrial-CPS. IEEE Trans. Industr. Inf. 17 (8), 5829–5839 (2020).
Chen, C. M., Miao, Q., Khan, F., Srivastava, G. & Kumari, S. Sustainable secure communication in consumer-centric electric vehicle charging in industry 5.0 environments. IEEE Trans. Consum. Electron. (2023).
Fatima, Z., Tanveer, M. H., Waseemullah, Zardari, S., Naz, L. F., Khadim, H., … Tahir,M. (2022). Production plant and warehouse automation with IoT and industry 5.0. Applied Sciences, 12(4), 2053.
Taj, I. & Zaman, N. Towards industrial revolution 5.0 and explainable artificial intelligence: challenges and opportunities. Int. J. Comput. Digit. Syst. 12 (1), 295–320 (2022).
Leng, J. et al. ManuChain II: blockchained smart contract system as the digital twin of decentralized autonomous manufacturing toward resilience in industry 5.0. IEEE Trans. Syst. Man. Cybernetics: Syst. 53 (8), 4715–4728 (2023).
Ramachandran, K. K. et al. Innovative cyber security solutions built on block chain technology for industrial 5.0 applications. In 2023 International Conference on Artificial Intelligence and Smart Communication (AISC) (pp. 643–650). IEEE. (2023), January.
Shrestha, R., Mishra, A., Bajracharya, R., Sinaei, S. & Kim, S. 6G network for connecting CPS and industrial IoT (IIoT). In Cyber-Physical Systems for Industrial Transformation (17–38). CRC. (2023).
Javaid, M., Haleem, A., Singh, R. P. & Suman, R. An integrated outlook of Cyber–Physical systems for industry 4.0: topical practices, architecture, and applications. Green. Technol. Sustain. 1 (1), 100001 (2023).
Bhat, F. A. & Parvez, S. Emerging challenges in the sustainable manufacturing system: from industry 4.0 to industry 5.0. J. Institution Eng. (India): Ser. C, 1–15. (2024).
Pal, S. Artificial Intelligence-Based IoT-Edge environment for industry 5.0. In IoT Edge Intelligence 111–148 (Springer Nature Switzerland, 2024).
Das, P., Ray, S., Sadhukhan, D. & Govil, M. C. 6G communication technology for industry 5.0: prospect, opportunities, security issues, and future directions. In Secure and Smart Cyber-Physical Systems (pp. 104–117 ). CRC.
Sharma, M., Sehrawat, R., Luthra, S., Daim, T. & Bakry, D. Moving towards industry 5.0 in the pharmaceutical manufacturing sector: challenges and solutions for Germany. IEEE Trans. Eng. Manage. (2022).
Al Haddar, G., Haerudin, H., Riyanto, A., Syakhrani, A. W. & Aslan, A. The revolution of Islamic education thought in the era of society 5.0: corrections and analysis of studies in Islamic higher education institutions in South Kalimantan. Int. J. Teach. Learn. 1 (4), 468–483 (2023).
Adel, A. Unlocking the future: fostering human–machine collaboration and driving intelligent automation through industry 5.0 in smart cities. Smart Cities. 6 (5), 2742–2782 (2023).
Pistolesi, F., Baldassini, M. & Lazzerini, B. A human-centric system combining smartwatch and lidar data to assess the risk of musculoskeletal disorders and improve ergonomics of industry 5.0 manufacturing workers. Comput. Ind. 155, 104042 (2024).
Vacchi, M., Siligardi, C. & Settembre-Blundo, D. Driving manufacturing companies toward industry 5.0: a strategic framework for process technological sustainability assessment (P-TSA). Sustainability 16 (2), 695 (2024).
Hamouda, D., Ferrag, M. A., Benhamida, N., Seridi, H. & Ghanem, M. C. Revolutionizing intrusion detection in industrial IoT with distributed learning and deep generative techniques. Internet Things. 26, 101149 (2024).
Khan, I. A. et al. A privacy-conserving framework based intrusion detection method for detecting and recognizing malicious behaviours in cyber-physical power networks. Appl. Intell., 1–16. (2021).
Khan, I. A. et al. Fed-inforce-fusion: A federated reinforcement-based fusion model for security and privacy protection of IoMT networks against cyber-attacks. Inform. Fusion. 101, 102002 (2024).
Rabie, O. B. J. et al. A security model for smart grid SCADA systems using stochastic neural network. IET Generation Transmission Distribution. 17 (20), 4541–4553 (2023).
Rabie, O. B. J., Balachandran, P. K., Khojah, M. & Selvarajan, S. A proficient ZESO-DRKFC model for smart grid SCADA security. Electronics 11 (24), 4144 (2022).
Khadidos, A. O. et al. Integrating industrial appliances for security enhancement in data point using SCADA networks with learning algorithm. Int. Trans. Electr. Energy Syst. 2022 (1), 8685235 (2022).
Khadidos, A. O. et al. A classy multifacet clustering and fused optimization based classification methodologies for SCADA security. Energies 15 (10), 3624 (2022).
Shitharth, S. et al. An enriched RPCO-BCNN mechanisms for attack detection and classification in SCADA systems. IEEE Access. 9, 156297–156312 (2021).
Sangeetha, K., Shitharth, S. & Mohammed, G. B. Enhanced SCADA IDS security by using MSOM hybrid unsupervised algorithm. Int. J. Web-Based Learn. Teach. Technol. (IJWLTT). 17 (2), 1–9 (2022).
Abuhasel, K. A. A linear probabilistic resilience model for Securing critical infrastructure in industry 5.0. IEEE Access. 11, 80863–80873 (2023).
Jiang, Y., Wang, W., Ding, J., Lu, X. & Jing, Y. Leveraging digital twin technology for enhanced cybersecurity in Cyber–Physical production systems. Future Internet. 16 (4), 134 (2024).
Acknowledgements
Acknowledgement: The author extends the appreciation to the Deanship of Postgraduate Studies and Scientific Research at Majmaah University for funding this research work through the project number (R-2025-1558).
Author information
Authors and Affiliations
Contributions
M.A. Contributed in Conceptualization, Methodology, Data Curation, Formal Analysis, and Writing—Original Draft.
Corresponding author
Ethics declarations
Competing interests
The authors declare no competing interests.
Additional information
Publisher’s note
Springer Nature remains neutral with regard to jurisdictional claims in published maps and institutional affiliations.
Rights and permissions
Open Access This article is licensed under a Creative Commons Attribution-NonCommercial-NoDerivatives 4.0 International License, which permits any non-commercial use, sharing, distribution and reproduction in any medium or format, as long as you give appropriate credit to the original author(s) and the source, provide a link to the Creative Commons licence, and indicate if you modified the licensed material. You do not have permission under this licence to share adapted material derived from this article or parts of it. The images or other third party material in this article are included in the article’s Creative Commons licence, unless indicated otherwise in a credit line to the material. If material is not included in the article’s Creative Commons licence and your intended use is not permitted by statutory regulation or exceeds the permitted use, you will need to obtain permission directly from the copyright holder. To view a copy of this licence, visit http://creativecommons.org/licenses/by-nc-nd/4.0/.
About this article

Cite this article
Aleisa, M.A. Enhancing Security in CPS Industry 5.0 using Lightweight MobileNetV3 with Adaptive Optimization Technique. Sci Rep 15, 18677 (2025). https://doi.org/10.1038/s41598-025-00496-3
Received:
Accepted:
Published:
Version of record:
DOI: https://doi.org/10.1038/s41598-025-00496-3
