
Abstract
In this study, we present an artificial intelligence (AI)-driven framework for predicting the microstructural texture of polycrystalline materials after a specific deformation process. The microstructural texture is defined in terms of the orientation distribution function (ODF) which indicates the volume density of crystal orientations. Our approach leverages an encoder-decoder model with Long Short-Term Memory (LSTM) layers to model the relationship between processing conditions and material properties. As a case study, we apply our framework to copper, generating a dataset of 3125 unique processing parameter combinations and their corresponding ODF vectors. The resulting predictions enable the calculation of homogenized properties. Our AI-driven framework outperforms traditional material processing simulations, yielding faster results with limited error rates (< 0.3% for both the elastic matrix C and the compliance matrix S), making it a promising tool for the expedited design of microstructures with tailored properties.
Introduction
Polycrystalline materials play a vital role in a wide range of industrial applications due to their versatile properties and cost-effectiveness. These materials exhibit complex microstructures, which have a significant impact on their mechanical and physical properties. Understanding the relationship between processing, structure, property, and performance (PSPP) in polycrystalline materials is crucial for the development of advanced materials with tailored properties, enabling better performance in various applications such as aerospace, automotive, and electronics industries1,2,3,4,5,6,7,8,9,10.
However, traditional experimental approaches to exploring the optimum processing routes for a specific texture are often laborious, time-consuming, and expensive, as they rely heavily on trial and error. In recent years, computational methods have emerged as a promising alternative to replace experimental approaches, expediting the design of microstructures with desired textures. The fast and accurate prediction of texture evolution during processing holds the key to bridging the gap between material design and manufacturing efforts for polycrystalline materials. Sarkar et al.11 devised a surrogate model for zirconia-toughened alumina (ZrO2-Al2O3) ceramics to estimate sinter density and grain size based on sintering heat treatment process parameters. In a different study, Tapia et al.12 constructed a Gaussian process regression-based surrogate model for the heat treatment process of nickel-titanium (NiTi) shape-memory alloys. This model takes the heat treatment temperature, duration, and initial nickel composition as input parameters, and predicts the final nickel composition after heat treatment.
A process simulator of microstructure evolution can be employed to learn the evolution of microstructures under each elementary process, utilizing the orientation distribution function (ODF) as a means to represent microstructure texture. The ODF describes the volume density of crystals of different orientations in a microstructure, allowing for a comprehensive representation of the material’s texture. Given an arbitrary initial texture (ODF) and a set of processing parameters, the future sequential ODF can be predicted using the process simulator. However, the simulation is still time-consuming because of complex physical calculations.
In recent years, artificial intelligence (AI) and machine learning (ML) techniques have emerged as promising tools for accelerating the understanding of material behavior and guiding the development of new materials with desired properties13,14,15,16,17,18,19,20,21. These techniques have demonstrated success in various material science applications, such as predicting crystal structures, estimating mechanical properties, and simulating deformation processes. Several machine-learning approaches have been employed to model the microstructural evolution in different materials, such as metals, alloys, and composites. Lu et al.22 proposed a machine-learning-based method to enhance the parameter identification process for crystal plasticity models by accurately mapping macroscopic stress–strain data to underlying constitutive parameters, enabling efficient and transferable crystal plasticity finite element (CPFE) simulations across various face-centered cubic metals. Wen and Wei23 proposed a machine-learning-based constitutive modeling framework that enables high-resolution, efficient simulation of deformation localization phenomena, such as shear banding in metallic glasses, by capturing critical thermomechanical interactions across scales. Wang et al.24 proposed a machine learning-based algorithm to efficiently and accurately identify active slip systems in crystal plasticity models, offering a promising alternative to traditional methods with demonstrated success across face-centered cubic (FCC), body-centered cubic (BCC), and hexagonal close-packed (HCP) metals. Farizhandi and Mamivand25 proposed a Predictive Recurrent Neural Network (PredRNN) model for microstructure prediction, which extends the inner-layer transition function of memory states in Long Short-Term Memory (LSTM) to spatiotemporal memory flow, offering a fast and accurate alternative to traditional simulation tools for predicting microstructure evolution. Montes et al.26 proposed a data-driven surrogate model that combines phase-field and history-dependent machine learning techniques, offering a computationally inexpensive and accurate approach for predicting microstructural evolution in various systems. This approach, which employs either a time-series multivariate adaptive regression splines autoregressive algorithm or a LSTM neural network, has demonstrated promising results in predicting nonlinear microstructure evolution during spinodal decomposition, significantly accelerating high-fidelity phase-field simulations. Hasan et al.27 developed a process modeling approach using LSTM networks to model the relationship between processing conditions and microstructure evolution. Their work focused on capturing the process-microstructure relationship without involving the prediction of material properties. In contrast, our study not only models the process-microstructure relationship but also extends it to design and investigate the resulting material properties.
In this study, we propose an AI-based framework utilizing an encoder-decoder model with LSTM layers for predicting changes in the ODF of polycrystalline materials following a specific deformation process. The orientation distribution function is a statistical representation of the crystallographic orientations within a polycrystalline material, which directly affects its overall properties. Copper is an essential metal widely used in various industries due to its excellent electrical and thermal conductivity, high ductility, and resistance to corrosion28,29. Additionally, it possesses good mechanical properties, making it a suitable choice for numerous applications, such as electronics, telecommunications, power generation, and building construction. In this study, we use copper as an example material. The dataset is generated from the material processing simulation30 containing 3125 unique combinations of processing parameters, including a sequence of ten ODF vectors for each combination as the output of the processing. The proposed framework takes the initial ODF and corresponding processing parameters as input and predicts the texture evolution in terms of ODF for that deformation process. Then, homogenized properties can be calculated using the predicted ODF.
The proposed AI-driven framework provides a fast, cost-effective, and accurate method for predicting texture evolution in polycrystalline materials, ultimately paving the way for optimized microstructures with tailored properties, outperforming the material processing simulation with only a minimal compromise in accuracy. A conference version of this work appeared in Ref31. This article using updated simulation software, significantly builds upon previous work by incorporating using more historical ODF information, conducting additional experiments, and providing a deeper analysis of the results. It also offers new insights and a more comprehensive discussion.
Results
Dataset
We generated a dataset for this study using a strain-rate independent crystal plasticity simulation30. The deformation simulation can be performed for tension/compression and shear forces in XY, YZ, and XZ planes. The strain rate is varied for each deformation process. In order to cover a wider range of real data distribution, we generate process data by taking the strain rate values from a list of (0, 0.25, 0.5, 0.75, 1) for each process, resulting in \(5^5 = 3125\) (five options for each parameter, and a total of five parameters) unique combinations. For every combination of processing parameters, the simulator provides the final deformed ODF with nine intermediate steps of ODF evolution. As a result, we generate a sequence of ten ODF vectors, labeled \(ODF_1, ODF_2, ODF_3,......, ODF_{10}\). Each ODF vector has 76 dimensions to represent the FCC copper microstructures. All these ODF vectors originate from the same initial ODF vector (\(ODF_0\)), in which 76 dimensions are assigned identical values. To satisfy the normalization constraints of the ODF (normalization constraint refers to the sum of independent crystal volume fraction should be one8), each dimension is set to a value of 2.432.
We randomly divided the dataset, consisting of ODF vectors and their corresponding processing parameters, into training and test sets, with proportions of 70% and 30%, respectively. This division ensured that our model was trained and tested on independent and representative data samples.
Experimental settings
The model was trained using the Adam optimizer and a mean squared error (MSE) loss function. The learning rate was set to 0.001, and the batch size was set to 32. The teacher-forcing probability \(p_t\) was set to 0.2. We randomly divide the training set into the training set and a validation set with proportions of 70% and 30%, respectively. We select the best model in the validation set as the model to predict the results of the testing set. The performance of the model was evaluated on the test set. We compared the performance of our proposed model with that of several baselines, including a linear regression model, a ridge model, and a feedforward neural network.
Evaluation metrics
We employed the ODF_ave_ave_mape metric to compare predicted ODF. First, we calculated the mean absolute percentage error (mape) for each predicted ODF of each processing combination. Then, we computed the average mape value of F ODF as the ave_mape of each processing combination. Finally, we determined the average ave_mape of all testing processing combinations to obtain the ODF_ave_ave_mape, as shown in Eq. (1). P is the number of testing set of processing combinations. F denotes the number of future ODF vectors that the decoder is tasked with predicting. This represents the forecasted evolution of the microstructure over future time steps. N is the number of dimensions for each ODF vector, which is 76. This metric allowed us to compare the ODF prediction performance of different models, as demonstrated in the “ODF mape” column in Tables 1 and 2.
After obtaining the predicted ODF, we derived property matrices C and S using homogenization. We designated these as predicted C and predicted S. As these matrices were not predicted directly by the models but were calculated using homogenization, they had fewer errors compared with predicting property directly. We adopted a similar method to evaluate the performance of predicted properties. For instance, for each processing combination, we calculated the mape of every element of F predicted C matrices. Subsequently, we computed the average mape of all processing combinations. In this manner, we obtained a \(6\times 6\) matrix representing the average mape of every element of predicted C. These results are shown in the “Property mape” column in Tables 1 and 2. We determined the average mape of predicted S matrices using the same method.
Meanwhile, we utilize the Selected_property_mape to assess the predicted C matrix using a single value. The Selected_property_mape is computed from nine specific elements of the stiffness matrix: \(C_{11}, C_{22}, C_{33}, C_{44}, C_{55}, C_{66}, C_{12}, C_{13}, C_{23}\) for orthotropic material. We choose these elements because the diagonal components (\(C_{11}, C_{22}, C_{33}, C_{44}, C_{55}, C_{66}\)) are the most significant in determining the material’s response along principal directions. Additionally, the elements \(C_{12}, C_{13}\) and \(C_{23}\) from the upper-left \(3\times 3\) submatrix are included due to the symmetric nature of the stiffness matrix and their importance in capturing the material’s orthotropic behavior. For each predicted C matrix corresponding to a specific processing combination, we can determine the mape of the selected elements (where \(N=9\)) as a representation of the error in that predicted C matrix. Subsequently, we calculate the average mape value for F predicted C matrices as the average_mape for that particular processing combination. Lastly, we compute the average of the average_mape values for all testing processing combinations to obtain the C_ave_ave_mape of the predicted C matrices, which can be expressed as Eq. (2).
We can derive the S_ave_ave_mape using an analogous method, which can be represented as Eq. (3). Both C_ave_ave_mape and S_ave_ave_mape assist in comparing the performance of different models in predicting property matrices. These values can be found under the “Selected_property mape” column in Tables 1 and 2.
Evaluation on ten predicted ODF using only initial ODF (F = 10)
We employed the Linear Regression model, Ridge model, and neural networks to predict ten ODF using only the initial ODF and corresponding processing parameters. Consequently, the input feature dimension is 81 (76+5). During both the training and testing phases, we normalize the input features to unit norm using scikit-learn’s preprocessing methods. The results can be found in Supplementary Table S1. It is evident that the neural network (NN) model outperforms the others in terms of ODF mape and Selected_property mape for both C and S matrices, with an ODF mape of 8.17%. Therefore, we utilize the NN model as a baseline for comparison with the proposed seq2seq model in subsequent experiments.
Evaluation on nine predicted ODF using two initial ODF (F = 9)
In Table 1, we compare the results of the NN model and seq2seq model using \(H=2\) and the processing parameters as inputs. As a result, the input feature dimension is 157 (\(76\times 2+5\)). We can observe that the seq2seq model achieves a significantly lower ODF mape than the NN model (2.43% vs. 7.99%) and a lower Selected_property mape for both C and S matrices. This demonstrates that the proposed seq2seq model can achieve better results by learning the time-series relationship, capturing not only the values of future ODF but also the trend of every dimension in the sequence of ODF.
Evaluation on six predicted ODF(F = 6)
In Table 2, we compare the performance of the seq2seq model with \(H=2, 3, 4, 5\). To ensure a fair comparison, we evaluate only the six predicted ODF (from \(ODF_5\) to \(ODF_{10}\)). We observe that when \(H=5\), the model achieves the best ODF mape and a lower Selected_property mape for both the C and S matrices. This demonstrates that incorporating longer historical information enables the model to learn more effectively, resulting in improved prediction performance. However, using a history length H greater than 5 significantly increases the running time. Therefore, we select \(H=5\) for the final seq2seq model to balance performance and computational efficiency.

Example portion of ODF for the seq2seq model with processing parameters = 0.75, 0.25, 0.5, 0, 0.5. an example of a portion of the dimensions of sequence ODF predicted by the seq2seq model, with processing parameters set to 0.75, 0.25, 0.5, 0, 0.5. The y-axis shows the dimension value across ten time steps. The results show that the proposed seq2seq model effectively predicts the ODF for future steps. Both accurate trend predictions and less accurate trends are included for illustration. However, even in cases where the trend prediction is less precise, the error percentage remains small across all dimensions when considering the range of the y-axis. This figure was generated using Python 3.7 with Matplotlib 3.9.032.
Illustrative sequence ODF, property matrices
Figure 1 presents an example of a portion of the dimensions of sequence ODF predicted by the seq2seq model, with processing parameters set to 0.75, 0.25, 0.5, 0, 0.5. The results show that the proposed seq2seq model effectively predicts the ODF for future steps. Both accurate trend predictions and less accurate trends are included for illustration. However, even in cases where the trend prediction is less precise, the error percentage remains small across all dimensions when considering the range of the y-axis. Overall, Fig. 1 highlights the predictive capability of the proposed seq2seq model.
Figure 2 provides a comparative representation of simulated and predicted ODF at the final time step in Rodrigues orientation space for various processing parameters. Each pair of images displays the simulated ODF (left) and the predicted ODF (right) corresponding to a specific set of processing parameters. The high degree of similarity between the simulated and predicted ODF for each processing set demonstrates that our proposed AI method achieves accurate predictions.
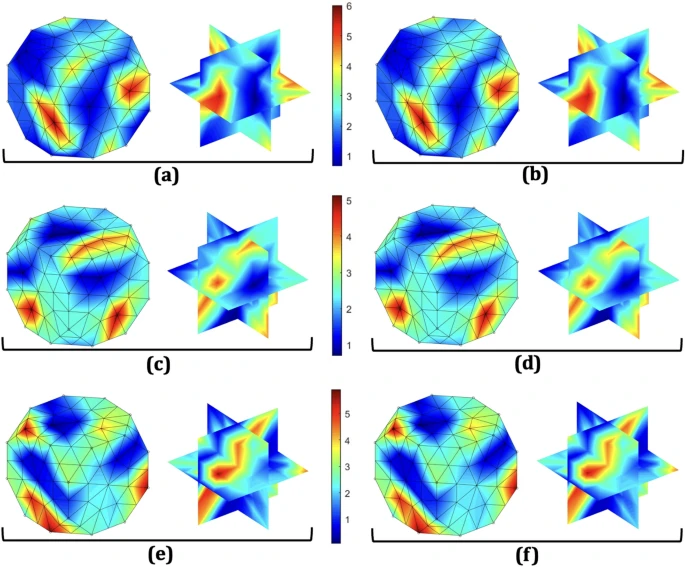
Comparative representation of simulated and predicted ODF at the final time step in Rodrigues orientation space for various processing parameters. Each pair of images illustrates the simulated ODF (left) and the predicted ODF (right) for a specific set of processing parameters: (a) and (b) for parameters 0, 0.75, 1, 0.25, 0.5; (c) and (d) for 0.75, 0.25, 0.5, 0, 0.5; (e) and (f) for 0.5, 0, 1, 0.25, 1. The visualization was created using MATLAB R2024 software.

An example of the Selected_C with a minimum mape of 0.02%. The processing parameters used are 0.75, 0.25, 0.5, 0, 0.5. This figure was generated using Python 3.7 with Matplotlib 3.9.032.
Figure 3 presents an example of the Selected_C with a minimum mape of 0.02%. The processing parameters used in this case are 0.75, 0.25, 0.5, 0, 0.5. Supplementary Fig. S1 shows another example where the median mape is 0.18%, with processing parameters of 0, 0.75, 1, 0.25, 0.5. Supplementary Fig. S2 illustrates a case with a maximum mape of 1.16%; the processing parameters for this example are 0.5, 0, 1, 0.25, 1. These figures illustrate that the seq2seq model can effectively capture the trend, and the predicted values are close to the actual values, considering the small y-axis range.
Discussion
In this study, we have presented a novel approach for predicting the sequence of deformed ODF and their corresponding property matrices (C and S) after load application based on the seq2seq model with LSTM. Our results demonstrate the effectiveness of the proposed seq2seq model in capturing complex trends and predicting accurate values. The results of our experiments show that the seq2seq model consistently outperforms traditional machine learning models and the NN model in predicting ODF and property matrices. This superior performance is attributed to the ability of the LSTM seq2seq model to learn and capture the time-series relationship in the input data. These findings have important implications for materials science and engineering, where accurate predictions of microstructure and properties are crucial for material design and optimization.
In contrast to simulation-based approaches, our seq2seq model achieves accurate results while reducing computation time. The superior performance of proposed seq2seq model stems from its ability to capture long-term dependencies through LSTM cells and its encoder-decoder structure that effectively transforms historical ODF sequences into future predictions while preserving essential temporal relationships. Traditional simulation methods require approximately one minute to process a single set of parameters, whereas proposed seq2seq method’s prediction time is less than 0.015 seconds. This advantage is particularly important in material design and optimization processes, where numerous iterations and simulations are often required to identify optimal material properties and processing conditions. The reduction in running time can be attributed to the seq2seq model’s ability to learn and generalize the underlying patterns in the input data, enabling it to make predictions on unseen data without the need for extensive simulations. This efficiency makes the proposed method a promising alternative to traditional simulation code, particularly in scenarios where time and computational resources are limited.
In conclusion, the proposed seq2seq model not only provides superior performance in predicting sequence ODF and property matrices but also offers the added advantage of reduced running time compared to traditional simulation code. This combined benefit has the potential to significantly advance material design and optimization processes in materials science and engineering. The proposed seq2seq model can be utilized in various applications, such as material processing, property prediction, and optimization, ultimately leading to more efficient and cost-effective material development.
Despite the promising results, our study has several limitations. Firstly, our study focused on a specific set of materials and processing conditions. The generalizability of our approach to other materials and processing conditions needs to be further investigated. Future work will focus on extending the validation to other polycrystalline materials such as aluminum alloys and titanium. This extension will help establish the broader applicability of our approach and its potential impact across different material systems. Moreover, the performance of the seq2seq model with different types of input features, such as crystallographic information or process parameters, could be explored to enhance prediction accuracy. Additionally, while our current model effectively utilizes ODF vectors and processing parameters, the incorporation of additional crystallographic features such as slip systems and grain boundary characteristics could potentially enhance prediction accuracy. These microstructural features play crucial roles in deformation behavior and texture evolution. Future work could explore the integration of these features into the model architecture, potentially through additional input channels or modified network layers that can process crystallographic information alongside the existing ODF data.
Methods
Deformation process modeling with ODF approach
Polycrystalline materials are composed of multiple crystals with various crystallographic orientations, which determine the microstructural texture. This texture is mathematically described by the ODF33,34,35, which allows for efficient deformation process modeling compared to computationally expensive finite element solvers. The ODF, represented by \(A({\bf {r}}, t)\), indicates the volume density of the crystals in the orientation space, \({\bf {r}}\), at a specific time t.
Refs8,36. provide a method for calculating the volume-averaged (homogenized) properties of polycrystalline materials by integrating their single-crystal properties with microstructural orientation information. The following equation (Eq. (4)) can be used to calculate the volume-averaged elastic characteristics \({\bf {C}}^{avg}\) of polycrystalline metals.
Here, C is the stiffness tensor of each crystal and \(<.>\) is the symbol of averaging. Similarly, if any property of a single crystal \(\chi ({\bf {r}})\) is dependent on the crystal orientations, then the homogenized polycrystal property \(<\chi>\) can be determined by performing the averaging over the ODF, that could be written as Eq. (5):
Here \(\chi ({\bf {r}})\) represents the orientation dependent single-crystal material properties. The relation between Rodrigues orientation vector, \({\bf {r}}\), the rotation, \({\bf {R}}\) can be expressed by Eq. (6).
After the crystallographic symmetries (hexagonal, cubic) are enforced, the integration is conducted in the fundamental region, \(\Omega\), of the orientation space. The homogenized (volume-averaged) properties of the microstructures are obtained using the given expression in Eq. (7)8,37. The discretization of the ODF contains N independent nodes with \(N_{elem}\) finite elements and \(N_{int}\) integration points per element.
where \(A({\bf {r}}_m)\) is the ODF value at the \(m^{th}\) integration point with global coordinate \({\bf {r}}_m\) of the \(n^{th}\) element, \(|{\bf {J}}_{n}|\) is the Jacobian matrix of the \(n^{th}\) element, \(\omega _m\) is the integration weight of the \(m^{th}\) integration point, while the Rodrigues parameterization metric is given by: \(\frac{1}{(1+{\bf {r}}_m\ \cdot {\bf {r}}_m\ )^2}\). Equation (4) can also be expressed in the linear form as \(<\chi>={\bf {P}}^{T}{\bf {A}}\), where A is the column vector of the ODF values at the independent nodes in the ODF mesh and \({\bf {P}}\) is the property matrix, which is a product of single-crystal properties and orientation-dependent parameters.
Furthermore, the ODF must satisfy the normalization constraint defined by \({\bf {q}}^{T}{\bf {A}}=1\). This constraint ensures that the sum of the probabilities for all crystallographic orientations equals one, reflecting a complete representation of the material’s orientation space. Here, \({\bf {q}}\) is a constant column vector derived from the finite element discretization.
During the deformation process, the ODF evolve due to the reorientation of grains within the material. This evolution transforms the initial ODF at time \(t=0\) into the final deformed ODF at time \(t=t_{final}\). The change in ODF values is governed by the ODF conservation equation. Equation (8) presents the Eulerian rate form of this conservation equation in the crystallographic orientation space, incorporating a gradient operator as described by Ref.36.:
where \(v({\bf {r}}, t)\) is the reorientation velocity. The texture evolution can be calculated by the microstructure constitutive model in terms of a velocity gradient (L) definition (see Eq. (9) below), which is linked to \(v({\bf {r}}, t)\) by the Taylor macro-micro linking hypothesis38. A rate-independent constitutive model is adopted to compute the reorientation velocity36. The evolution of current texture \(A({\bf {r}},t)\) from the initial texture \(A({\bf {r}},0)\) is solved by the constitutive model and finite element representation in the Rodrigues orientation space.
During deformation processes such as tension, compression, and shear, applying a load over a specific period causes the ODF to evolve. The crystal plasticity solver employs the macro velocity gradient \({\bf {L}}\) associated with a particular process to investigate how the ODF changes during that deformation. For a crystal oriented along \({\bf {r}}\), the velocity gradient can be expressed as:
where S represents the lattice spin, \({\bf {R}}\), indicates the lattice rotation, \(\dot{\gamma ^{\alpha }}\) and \(\bar{{\bf {T}}}^{\alpha }\) indicate the shearing rate and Schmid tensor for the slip system \(\alpha\), respectively.
The macro velocity gradient expression of Eq. (9) can be written in the following matrix form for the tension/compression process Eq. (10) and its derivation is skipped here for brevity which can be found in Ref36..
Each matrix in Eq. (10) defines a deformation process, e.g. tension/compression (\(\alpha _{1}\)), plane strain compression (\(\alpha _{2}\)), and shear modes (\(\alpha _{3}, \alpha _{4}, \alpha _{5}\)).
Proposed AI model architecture
We proposed a sequence-to-sequence (seq2seq) architecture, specifically utilizing an encoder-decoder framework with LSTM layers39,40,41 for both encoding and decoding processes. The encoder-decoder model is a type of neural network architecture that has been widely used in various fields, including natural language processing42,43,44 and computer vision45,46,47. It consists of two main components: an encoder and a decoder. The encoder takes an input sequence and maps it to a fixed-length vector representation, which captures the most relevant information from the input sequence. This vector representation is then passed to the decoder, which generates an output sequence based on the encoded information.
One type of neural network layer commonly used for time series data in the encoder-decoder model is the LSTM layer. LSTM is a type of Recurrent Neural Network (RNN) that is designed to handle sequential data by allowing information to persist over time. LSTMs have the ability to selectively retain or forget information from previous time steps, making them well-suited for modeling sequences with long-term dependencies. This allows the encoder-decoder model to effectively capture the temporal dynamics of sequential data and generate accurate predictions of future sequences.
In the context of this work, the deformation problem being addressed inherently involves sequential data where long-term relationships are critical. The temporal evolution of the microstructure during deformation depends not only on the immediate input conditions but also on the history of prior states and processing parameters. This requires a model capable of remembering and leveraging information over long time intervals, which is a key advantage of LSTM layers compared to basic RNNs. While RNNs can capture sequential dependencies to some extent, they often suffer from issues such as vanishing gradients, limiting their ability to model long-term dependencies. LSTMs overcome these challenges through their gated architecture, which allows for more effective learning of the temporal dynamics crucial for accurately predicting future sequences in this problem domain.
The proposed model is an encoder-decoder architecture that uses LSTM layers for both encoding and decoding. Figure 4 shows the architecture of the proposed encoder-decoder LSTM model. The encoder receives as input H ODF vectors generated by simulation, along with the processing parameters. Here, H represents the number of initial ODF vectors used as input to the encoder. These are the historical ODF vectors that the model uses to understand the initial state of the microstructure. The processing parameters are embedded using a linear layer, and the resulting feature vector is concatenated to the ODF vectors. The hidden layer of the encoder is fed into the decoder, which generates a sequence of future ODF vectors. The decoder takes the initial H ODF vectors and processing parameters combination as input.

Encoder-decoder LSTM architecture. The encoder receives as input H ODF vectors generated by simulation, along with the processing parameters. Here, H represents the number of initial ODF vectors used as input to the encoder. The processing parameters are embedded using a linear layer, and the resulting feature vector is concatenated to the ODF vectors. The hidden layer of the encoder is fed into the decoder, which generates a sequence of future ODF vectors. The decoder takes the initial H ODF vectors and processing parameters combination as input.
Teacher-forcing is a technique used in sequence-to-sequence models, such as the encoder-decoder model, during training to improve the accuracy of the generated output sequence48,49,50. In teacher-forcing, the correct output sequence at each time step is provided to the decoder as input instead of using the generated output from the previous time step. This allows the model to learn from the correct output sequence and make more accurate predictions in the future. The use of teacher-forcing during training can also prevent the model from getting stuck in a loop where it generates incorrect output sequences that are then fed back into the model as input, resulting in a compounding error that gets worse over time.
While teacher-forcing can be an effective training technique, it can also lead to issues during testing when the model is generating output sequences without the availability of the correct output sequence at each time step. Therefore, it is important to balance the use of teacher-forcing during training with other techniques, such as scheduled sampling, to improve the model’s performance during testing. In this work, teacher-forcing is used to provide the correct output from the previous time step as input with probability \(p_t\). During testing, the decoder generates its own output at each step based on the previous output and processing parameters.
Data availability
The code and data can be found at https://github.com/YuweiMao-NU/AIMicrostructurePrediction.
Change history
15 September 2025
The original online version of this Article was revised: In the original version of this Article Reference 31 was incorrectly given as Reference 50. The correct Reference 31 is: Mao, Y. et al. A deep learning framework for time-series processing-microstructure-property prediction. In 2023 International Conference on Machine Learning and Applications (ICMLA), 890–893. https://doi.org/10.1109/ICMLA58977.2023.00131 (2023). As a result, the subsequent references have been renumbered. The original Article has been corrected.
References
Agrawal, A. & Choudhary, A. Artificial intelligence for accelerating materials discovery. Artif. Intell. Accelerat. Mater. Discov. 24, 431–443 (2023).
Gupta, V., Liao, W.-K., Choudhary, A. & Agrawal, A. Evolution of artificial intelligence for application in contemporary materials science. MRS Communications 13, 754–763 (2023).
Mao, Y. et al. A deep learning-based crystal plasticity finite element model. Scripta Mater. 254, 116315 (2025).
Huang, Y., Zhang, L., Deng, H. & Mao, J. Njmat: Data-driven machine learning interface to accelerate material design. J. Chem. Inf. Model. 64, 6477–6491 (2024).
Mahmood, M. A., Ishfaq, K. & Khraisheh, M. Inconel-718 processing windows by directed energy deposition: A framework combining computational fluid dynamics and machine learning models with experimental validation. Int. J. Adv. Manuf. Technol. 130, 3997–4011 (2024).
Olson, G. B. Computational design of hierarchically structured materials. Science 277, 1237–1242 (1997).
Agrawal, A. & Choudhary, A. Perspective: Materials informatics and big data: Realization of the “fourth paradigm’’ of science in materials science. APL Mater. 4, 053208 (2016).
Sundararaghavan, V. & Zabaras, N. Linear analysis of texture-property relationships using process-based representations of Rodrigues space. Acta Mater. 55, 1573–1587 (2007).
Mao, Y. et al. Ai for learning deformation behavior of a material: predicting stress-strain curves 4000x faster than simulations. In 2023 International Joint Conference on Neural Networks (IJCNN), 1–8 (IEEE, 2023).
Mao, Y. et al. Generative adversarial networks and mixture density networks-based inverse modeling for microstructural materials design. Integrat. Mater. Manuf. Innov. 11, 637–647 (2022).
Sarkar, D., Reddy, B. S. & Basu, B. Implementing statistical modeling approach towards development of ultrafine grained bioceramics: Case of zro2-toughened al2o3. J. Am. Ceram. Soc. 101, 1333–1343 (2018).
Tapia, G. et al. Bayesian calibration and uncertainty quantification for a physics-based precipitation model of nickel-titanium shape-memory alloys. J. Manuf. Sci. Eng. 139, 071002 (2017).
Gregoire, J. M., Zhou, L. & Haber, J. A. Combinatorial synthesis for AI-driven materials discovery. Nat. Synth. 2, 493–504 (2023).
Liu, Y. et al. Generative artificial intelligence and its applications in materials science: Current situation and future perspectives. J. Materiomics 9, 798–816 (2023).
Nguyen, T.-D. et al. Artificial intelligence algorithms for prediction and sensitivity analysis of mechanical properties of recycled aggregate concrete: A review. J. Build. Eng. 66, 105929 (2023).
Raabe, D., Mianroodi, J. R. & Neugebauer, J. Accelerating the design of compositionally complex materials via physics-informed artificial intelligence. Nat. Computat. Sci. 3, 198–209 (2023).
Ramesh, S. et al. Influence of fibre direction on the mechanical properties and artificial intelligence-based performance prediction of hybrid abaca-jute amino composites. Mater. Res. Express 11, 075302 (2024).
Agrawal, A. et al. Exploration of data science techniques to predict fatigue strength of steel from composition and processing parameters. Integrat. Mater. Manuf. Innov. 3, 90–108 (2014).
Ward, L., Agrawal, A., Choudhary, A. & Wolverton, C. A general-purpose machine learning framework for predicting properties of inorganic materials. NPJ Computat. Mater. 2, 1–7 (2016).
Liu, R. et al. Context aware machine learning approaches for modeling elastic localization in three-dimensional composite microstructures. Integrat. Mater. Manuf. Innov. 6, 160–171 (2017).
Agrawal, A. & Choudhary, A. Deep materials informatics: Applications of deep learning in materials science. MRS Communications 9, 779–792 (2019).
Lu, S. et al. Machine learning-based constitutive parameter identification for crystal plasticity models. Mechanics of Materials. 105263 (2025).
Wen, J. & Wei, Y. Top-down constitutive modelling to capture nanoscale shear localization. J. Mech. Phys. Solids 187, 105629 (2024).
Wang, Z., Chen, X., Wen, J. & Wei, Y. Determining plastic slips in rate-independent crystal plasticity models through machine learning algorithms. Extreme Mech. Lett. 71, 102216 (2024).
Farizhandi, A. A. K. & Mamivand, M. Spatiotemporal prediction of microstructure evolution with predictive recurrent neural network. Comput. Mater. Sci. 223, 112110 (2023).
Montes de Oca Zapiain, D., Stewart, J. A. & Dingreville, R. Accelerating phase-field-based microstructure evolution predictions via surrogate models trained by machine learning methods. NPJ Computat. Mater. 7, 3 (2021).
Hasan, M., Ender Eger, Z., Senthilnathan, A. & Acar, P. Microstructure-sensitive deformation modeling and materials design with physics-informed neural networks. AIAA J. 62, 1864–1874 (2024).
Ramos-Zúñiga, J., Bruna, N. & Pérez-Donoso, J. M. Toxicity mechanisms of copper nanoparticles and copper surfaces on bacterial cells and viruses. Int. J. Mol. Sci. 24, 10503 (2023).
Robinson, N. J. & Winge, D. R. Copper metallochaperones. Annu. Rev. Biochem. 79, 537–562 (2010).
Billah, M. M. et al. MicroProcSim: A software for simulation of microstructure evolution. Integr. Mater. Manuf. Innov. https://doi.org/10.1007/s40192-025-00405-6 (2025).
Mao, Y. et al. A deep learning framework for time-series processing-microstructure-property prediction. In 2023 International Conference on Machine Learning and Applications (ICMLA), 890–893, https://doi.org/10.1109/ICMLA58977.2023.00131 (2023).
Hunter, J. D. Matplotlib: A 2d graphics environment. Comput. Sci. Eng. 9, 90–95. https://doi.org/10.1109/MCSE.2007.55 (2007).
Hasan, M. M., Senthilnathan, A. & Acar, P. Machine learning reinforced multi-scale modeling of microstructures under uncertainties. In AIAA Scitech 2021 Forum, 1140 (2021).
Hasan, M. et al. Data-driven multi-scale modeling and optimization for elastic properties of cubic microstructures. Integrat. Mater. Manuf. Innov. 11, 230–240 (2022).
Hasan, M. & Acar, P. Microstructure-sensitive stochastic design of polycrystalline materials for quasi-isotropic properties. AIAA J. 60, 6869–6880 (2022).
Sundararaghavan, V. & Zabaras, N. On the synergy between texture classification and deformation process sequence selection for the control of texture-dependent properties. Acta Mater. 53, 1015–1027 (2005).
Acar, P. & Sundararaghavan, V. Utilization of a linear solver for multiscale design and optimization of microstructures. AIAA J. 54, 1751–1759 (2016).
Taylor, G. I. Plastic strain in metals. J. Inst. Metals 62, 307–324 (1938).
Malhotra, P. et al. Lstm-based encoder-decoder for multi-sensor anomaly detection. arXiv preprint arXiv:1607.00148 (2016).
Park, S. H., Kim, B., Kang, C. M., Chung, C. C. & Choi, J. W. Sequence-to-sequence prediction of vehicle trajectory via lstm encoder-decoder architecture. In 2018 IEEE Intelligent Vehicles Symposium (IV), 1672–1678 (IEEE, 2018).
Bappy, J. H., Simons, C., Nataraj, L., Manjunath, B. & Roy-Chowdhury, A. K. Hybrid lstm and encoder-decoder architecture for detection of image forgeries. IEEE Trans. Image Process. 28, 3286–3300 (2019).
Kalusivalingam, A. K., Sharma, A., Patel, N. & Singh, V. Leveraging bert and lstm for enhanced natural language processing in clinical data analysis. International Journal of AI and ML 2 (2021).
Srinivas, A. C. M. V., Satyanarayana, C., Divakar, C. & Sirisha, K. P. Sentiment analysis using neural network and lstm. In IOP Conference Series: Materials Science and Engineering, Vol. 1074, 012007 (IOP Publishing, 2021).
Tan, K. L., Lee, C. P., Anbananthen, K. S. M. & Lim, K. M. Roberta-lstm: A hybrid model for sentiment analysis with transformer and recurrent neural network. IEEE Access 10, 21517–21525 (2022).
Zheng, Y., Han, L., Yu, J. & Yu, R. Driving risk assessment under the connected vehicle environment: a CNN-LSTM modeling approach. Digital Transp. Saf. 2, 211–219 (2023).
Moon, J. & Shim, B. LSTM-based beam tracking using computer vision. In 2022 IEEE VTS Asia Pacific Wireless Communications Symposium (APWCS), 66–69 (IEEE, 2022).
Hossain, M. M. et al. Cardiovascular disease identification using a hybrid CNN-LSTM model with explainable AI. Inf. Med. Unlocked 42, 101370 (2023).
Williams, R. J. & Zipser, D. A learning algorithm for continually running fully recurrent neural networks. Neural Comput. 1, 270–280 (1989).
Li, S., Wang, T., Li, G., Skulstad, R. & Zhang, H. Short-term ship roll motion prediction using the encoder-decoder bi-LSTM with teacher forcing. Ocean Eng. 295, 116917 (2024).
Rafi, S. & Das, R. Rnn encoder and decoder with teacher forcing attention mechanism for abstractive summarization. In 2021 IEEE 18th India council international conference (INDICON), 1–7 (IEEE, 2021).
Acknowledgements
This work was supported primarily by National Science Foundation (NSF) CMMI awards 2053929/2053840. Partial support from NIST award 70NANB24H136, NSF award OAC-2331329, DOE award DE-SC0021399, and Northwestern Center for Nanocombinatorics is also acknowledged.
Author information
Authors and Affiliations
Contributions
Y.M.: Writing, Review, Editing, Visualization, Validation, Methodology, Conceptualization. M.H.: Writing, Review, Editing, Visualization, Validation, Methodology, Conceptualization. M.B.: Writing, Review, Editing, Visualization, Validation, Methodology, Conceptualization. Y.L.: Writing, Review, Editing, Methodology, Conceptualization. S.C.: Writing, Review, Editing, Methodology, Conceptualization. C.L.: Writing, Review, Editing, Methodology, Conceptualization. K.W.: Writing, Review, Editing, Methodology, Conceptualization. M.K.: Writing, Review, Editing, Methodology, Conceptualization. V.G.: Writing, Review, Editing, Methodology, Conceptualization. W.L.: Writing, Review, Editing, Supervision, Resources, Funding acquisition. A.C.: Writing, Review, Editing, Supervision, Resources, Funding acquisition. P.A.: Writing, Review, Editing, Supervision, Resources, Methodology, Funding acquisition, Conceptualization. A.A.: Writing, Review, Editing, Supervision, Resources, Methodology, Funding acquisition, Conceptualization. All authors reviewed the manuscript.
Corresponding author
Ethics declarations
Competing interests
All authors declared that there are no conflicts of interest.
Additional information
Publisher’s note
Springer Nature remains neutral with regard to jurisdictional claims in published maps and institutional affiliations.
Supplementary Information
Rights and permissions
Open Access This article is licensed under a Creative Commons Attribution-NonCommercial-NoDerivatives 4.0 International License, which permits any non-commercial use, sharing, distribution and reproduction in any medium or format, as long as you give appropriate credit to the original author(s) and the source, provide a link to the Creative Commons licence, and indicate if you modified the licensed material. You do not have permission under this licence to share adapted material derived from this article or parts of it. The images or other third party material in this article are included in the article’s Creative Commons licence, unless indicated otherwise in a credit line to the material. If material is not included in the article’s Creative Commons licence and your intended use is not permitted by statutory regulation or exceeds the permitted use, you will need to obtain permission directly from the copyright holder. To view a copy of this licence, visit http://creativecommons.org/licenses/by-nc-nd/4.0/.
About this article

Cite this article
Mao, Y., Hasan, M., Billah, M.M. et al. An AI framework for time series microstructure prediction from processing parameters. Sci Rep 15, 24074 (2025). https://doi.org/10.1038/s41598-025-06894-x
Received:
Accepted:
Published:
Version of record:
DOI: https://doi.org/10.1038/s41598-025-06894-x
