
Abstract
The rapid advancement of sensor technologies has sparked significant interest in intelligent physiotherapy monitoring systems, which hold immense potential for improving assessment quality. Despite this promise, existing sensor technologies for physiotherapy evaluation often need to be expanded in their versatility and robustness. This research introduces an innovative approach using spike train feature extraction to enhance patient progression tracking for physiotherapy assessment. developed a novel approach that reveals distinctive patterns for each physiotherapy exercise by implementing spike trains as the primary feature extraction method. The methodology used three datasets: UI-PRMD, K3Da, and a Self-Collected dataset, which were encoded into spike train formal representations, generating around 415 unique spike patterns. The study uses raster plot patterns as inputs for a sophisticated Deep Learning framework to assess pattern uniqueness. A key innovation was utilising spike occurrence frequency (firing rate) to differentiate movement correctness, where the derived mean error percentage (MPE) was used as a supportive metric complementing the classification process, and validated against DL evaluation metrics. The proposed framework demonstrated exceptional performance, achieving recognition rates of 99.44% (UI-PRMD), 98.21% (K3Da), and 100.00% (self-collected datasets) across various convolutional neural network architectures. Comprehensive evaluation metrics were used to validate the effectiveness of the rehabilitation movement assessment, including accuracy, precision, recall, and F1-score. Spike-train encoding combined with a tailored CNN is promising for physiotherapy movement recognition and correctness assessment, but clinical utility remains provisional and requires validation in patient populations like stroke and Parkinson’s disease.
Introduction
Physiotherapy, a critical healthcare intervention, addresses movement challenges faced by patients with severe medical conditions. This therapeutic approach aims to enhance patients’ functional capabilities and quality of life by developing personalised treatment strategies tailored to individual movement impairments. While traditional physiotherapy typically requires in-person hospital visits, this model presents significant logistical challenges, particularly for elderly, bedridden, or geographically distant patients.
The conventional assessment and treatment process often places substantial burdens on both patients and caregivers. Patients must navigate transportation difficulties, time constraints, and physical limitations while caregivers coordinate complex scheduling and transportation arrangements. Moreover, the one-size-fits-all approach to movement prescriptions fails to acknowledge patients’ unique physiological and functional variations1, highlighting the need for more adaptive and accessible rehabilitation methodologies. These limitations underscore the critical importance of developing innovative physiotherapy monitoring systems that provide more flexible, personalised, and patient-centric rehabilitation solutions.
On top of that, in 2021, there were almost 3.14 million patients undergoing physiotherapy in clinics or rehab centres2, incorporating a multitude of disciplines of serious illnesses, such as stroke, Parkinson’s, post-surgery, etc. This figure results in a huge ratio of 20,000 physiotherapists per 100,000 population with 1:5000 respectively3. Based on Fig. 1, Malaysia has the lowest number of physiotherapists, 0.05 per 1000 population, compared with other countries.

Number of physiotherapists per 1,000 population for Professionally Active Professions in OECD Countries, in 20203.
Patient monitoring during rehabilitation is crucial to ensure proper movement execution and track therapeutic progression. Traditional physiotherapy models, however, face significant challenges due to limited expert availability, which can lead to delayed sessions and increased patient and caregiver stress. Technological innovations emerge as a potential solution to these systemic constraints, offering alternative approaches to rehabilitation management. Home-based rehabilitation represents a transformative paradigm, providing patients with greater flexibility, convenience, and continuity of care. This approach has increasingly attracted research interest, particularly in leveraging machine learning technologies to develop sophisticated exercise monitoring and classification methodologies. Researchers have been exploring diverse machine learning algorithms that recognise and analyse complex physiotherapeutic movements by identifying and tracking specific body parts and movement patterns. The convergence of advanced computational techniques and rehabilitation science promises to address critical gaps in traditional physiotherapy delivery, potentially revolutionising patient care through more accessible, personalised, and data-driven therapeutic interventions4.
A range of studies has explored the use of technology in home-based rehabilitation. Bernini et al.5 developed a HomeCoRe system for Telerehabilitation in mild or major neurocognitive disorders. Cognitive rehabilitation works well to prevent cognitive decline in older adults and to slow the development of functional disability in those with cognitive impairment. Rehabilitation systems increasingly incorporate Deep Learning (DL) algorithms to enhance patient care and outcomes. DL methods, such as posture estimation and limb motor function rehabilitation assistance systems, have been proposed to monitor conditions like cervical spondylosis, aiding therapists in assessing rehabilitation progress6. Additionally, smart walkers are being developed with RGB-D cameras and DL algorithms to decode human motion for early action recognition, improving human-robot interaction and aiding in gait disabilities treatment7. Furthermore, a DL-based autonomous limb evaluation system has been designed for online consultation and remote rehabilitation training, allowing patients to assess their limb states at home and connect with doctors for diagnostic opinions, showcasing the integration of DL in modern healthcare practices8. These advancements highlight the significant role of DL in optimising rehabilitation assistance systems for better patient care and outcomes.
Thus, this paper proposed a novel for movements’ classification which is also valid for movements’ correctness. Spike trains were implemented as feature analysis, which is highly informative for action recognition and DL to validate their effectiveness, as spike trains have their own significance patterns for each movement.
The main contributions of this work are:
-
1.
Derived firing rates of each exercise to estimate a MPE, which quantifies movement correctness as an auxiliary indicator. This MPE is not a separate regression objective but rather a complementary measure that aligns with and supports the overall classification framework.
-
2.
Developed a visually significant spike pattern for each exercise from a set of spike trains of neurons.
-
3.
Train for spike patterns for exercise classification by adopting several Convolutional Neural Network (CNN) models and able to achieve high accuracy.
-
4.
This approach also achieved an accuracy of 0.9 and above with different layers of CNN.
The present evaluation is conducted on healthy volunteers (10–54 subjects across datasets). While this setting is appropriate for feasibility testing, claims about clinical utility are preliminary; pathological movement patterns may differ substantially. Therefore, the frame contribution as methodological evidence of potential rather than established clinical effectiveness.
Literature review
Machine learning has emerged as a promising approach to guide different engineering problems9,10,11,12. This includes rehabilitation sessions, particularly in home-based rehabilitation contexts, offering advanced movement recognition and classification capabilities. Biomedical applications increasingly leverage these techniques to analyse body part movements and exercise patterns with unprecedented precision. Significant research has explored various machine learning algorithms in rehabilitation assessment. Zhu et al.13 demonstrated the effectiveness of the K-Nearest Neighbours (KNN) algorithm in rehabilitation prediction, notably outperforming Canada’s clinical assessment protocol. Their subsequent investigation with Support Vector Machines (SVM)14 aimed at improving predictive accuracy, interestingly revealed no statistically significant enhancement over KNN. Muniz et al15. conducted a comparative analysis of SVM, Probabilistic Neural Network (PNN), and logistic regression for discriminating between normal and Parkinson’s disease subjects through walking posture monitoring. Their findings highlighted PNN’s superior performance, particularly in classifying ground reaction forces.
The comparative landscape by evaluating four pose classification approaches: Backpropagation Neural Network (BNN), SVM, Decision Tree, and Naïve Bayes. Their research revealed BNN and SVM as the most promising methodologies. Complementing these findings16, utilised SVM for fall detection during home-based rehabilitation, demonstrating its potential to identify normal versus anomalous movements. However, it is crucial to acknowledge the inherent limitations of these approaches, particularly SVM’s constraints in computational speed and scalability. These challenges underscore the ongoing need for innovative machine learning techniques in rehabilitation research.
DL algorithms have been widely used and are slowly replacing conventional algorithms. This phenomenon is not only in the fields of computer vision, speech recognition, and text mining but also in human-computer interaction (HCI). Recently, the performance of DL has improved as DL takes an end-to-end learning approach and learns both feature extractors and classifiers. Hence, this efficiency enables analysis of DL when compared to the existing algorithms. Lately, attempts have been made to examine the motion of physical activity using DL algorithms. Research has been carried out on significant features extracted from clip17the movement prediction of joints has been conducted. Apart from that, several studies employed data collected via sensors. The works analysed movements by inputting sensor data into a multilayer perceptron neural network18. Further research on this includes radial basis function neural networks19. while20,21,22 adopting Artificial Neural Networks, feed-forward neural networks23 PNN24 PNN and DNN25 have been proposed and performed.
Among these, the CNN has been applied mainly to process images and demonstrate high performance in behaviour recognition26,27. Pioneering human pose and activity recognition research has leveraged advanced DL architectures. Beyond image and video-based methods, human activity recognition (HAR) in physiotherapy has increasingly adopted skeleton data from sensors or pose estimation. These structured joint representations reduce dimensionality and directly capture human kinematics. Graph-based models, such as graph convolutional and spatio-temporal graph convolutional networks, effectively learn spatial, temporal dependencies across joints, while sequence models including recurrent and long short-term memory networks capture motion dynamics, often enhanced with time, frequency features or heatmaps28,29,30. Our approach introduces spike train encoding, a biologically inspired representation that transforms motion into sparse spike events. This emphasizes temporally significant features and supports DL classifiers, while offering interpretability for assessing movement correctness in physiotherapy31,32. Table 1 present comparison of modeling approaches in HAR for physiotherapy.
While historically inspired by neural processes, DL fundamentally differs from biological neural systems in structure, computational mechanisms, and learning principles. Biological neurons communicate through spike trains temporally sparse signals rich in informational content39. In contrast, contemporary artificial sensors predominantly generate electrical analogue or digital outputs, prompting researchers to develop various spike encoding methodologies40.
Neural encoding enables researchers to investigate neuronal behaviours through electrophysiological techniques, capturing neuronal responses to specific stimuli. Peri-stimulus time histograms represent a fundamental approach to spike train analysis, as previously discussed41. Spike train features have demonstrated remarkable versatility across domains, including:
-
Speech recognition: Converting speech signals into distinctive spike train signatures
-
Object recognition: Classifying handwritten characters using SVM42.
-
Texture analysis: Transforming analogue signals from human skin mechanoreceptors into spike trains, achieving a remarkable 97% classification accuracy43.
CNN have emerged as a predominant deep artificial neural network architecture, excelling in diverse applications such as video and image recognition, natural language processing, and speech processing. CNN’s architectural design, characterized by interconnected nodes across layers, offers significant advantages: reduced parameter complexity, mitigation of overfitting, and inherent computational invariance. Contemporary research increasingly focuses on DL architectures characterized by multiple trainable parameter layers, demonstrating unprecedented performance across machine learning and artificial intelligence domains. This study proposes leveraging spike train capabilities within a DL framework to develop an innovative architecture combining established deep networks’ high-performance characteristics with bio-inspired, energy-efficient computational platforms.
Recently, transformer-based architectures have been introduced for HAR, leveraging self-attention to model long-range dependencies in skeleton or multimodal data. For instance, Pattern recognition proposed a skeleton-transformer hybrid achieving superior recognition accuracy on large HAR datasets44,45. Similarly, IEEE JBHI reported that attention-enhanced transformer frameworks outperform conventional CNN-LSTM approaches in rehabilitation monitoring tasks46. Beyond vision-based HAR, wearable sensors have become increasingly popular in physiotherapy contexts. In47 demonstrated the use of inertial measurement units for real-time posture correction, while48 presented an EMG-driven deep learning framework for rehabilitation progress monitoring. These approaches offer high temporal fidelity but require sensor instrumentation, which may limit practicality in home-based settings.
Rehabilitation movement classification
The proposed work is structured into three primary components: data collection, spike generation, and spike classification. Fig. 2 provides a visual representation of the framework’s general overview. The data collection segment elucidates the experimental setup for self-data collection and the utilisation of two online databases incorporated into this study. The spike generation part includes both firing rate derivation and spike trains. Spike trains are represented in raster plots, where these have been defined in previous studies41 It will provide the feature needed for the movement classification, which will be fed to CNN. The purpose of firing rate derivation is to define movement correctness by computing the mean firing rates between the correct and incorrect data captured. Finally, the classification results of firing rates and spike trains will be compared based on physiotherapy assessment. Each subtopic has provided a more thorough explanation of each framework component.

General overview of proposed framework.
Data collection
These days, there are a tonne of publicly accessible datasets about human movements49 that are widely utilized for tasks like stance estimation, fall detection, and action and gesture recognition. Furthermore, most of these data sets employ optical motion capturing systems for recording the movements, for example, CMU Multi-Modal Activity (CMU-MMAC)50, and Berkley MHAD (Multi-Modal Human Action Dataset)51. Additionally, the Microsoft Kinect sensor has been used to create a variety of data sets on normal human movements. These include the MSR (Microsoft Research) Action 3D data set and the University of Dallas at Texas Multi-Modal Human Action Dataset52,53. Since this study focused on data sets of therapy movements, some datasets are limited either in the movements or in the provided data format. For instance, HPTE (home-based physical therapy exercises)54 is a data set of therapy movements containing eight shoulder and knee exercise movements performed six times by five subjects, recorded with a Kinect camera. However, the HPTE data set only provides video and depth streams from the Kinect sensor. Hence, there are no corresponding body joint positions or angles provided, and although it is possible to extract the joint information from the video and depth frames, it is not an easy task. It would require implementing an image processing method, which complicates the overall process. Next, the EmoPain dataset55 was designed to focus on pain-related emotions in physiotherapy and contains high-resolution face videos, audio files, and electromyographic (EMG) signals from back muscles. Another data set recorded by EMG is the work of56, where nine subjects are only allowed to conduct three lower limb activities. Additionally, there are a number of related data sets that concentrate on tracking physical activity, such as through the use of inertial measurement units and heart rate monitors57.
Nonetheless, this study focused on the Kinect camera dataset recorded version. Hence, the secondary data was adopted from the University of Idaho and Manchester Metropolitan University, and both datasets correspond to this research approach very well. These datasets are associated with general exercises performed by patients in physical rehabilitation programs and hospital environments. The objective of these datasets is to evaluate patient consistency while performing the prescribed rehabilitation exercises. All datasets used in this study consist of healthy adult volunteers; no clinical diagnoses were included. The details of each dataset are explained in the subtopics below.
University of Idaho – physical rehabilitation movements data Set (UI-PRMD)
This work utilises the University of Idaho – Physical Rehabilitation Movements Data Set (UI-PRMD), recognised as a widely used and specialised dataset for studying rehabilitation activitie41. The UI-PRMD dataset comprises movements commonly practiced in physical therapy and rehabilitation programs, collected at the Integrated Sports Medicine Movement Analysis Laboratory (ISMMAL) in collaboration with the Department of Movement Sciences at the University of Idaho. It encompasses measurements of angles and positions for 10 exercises performed by 10 healthy individuals. Each exercise was repeated ten times, captured by two motion sensor devices: a Vicon Optical Tracker and Microsoft Kinect Sensor, operating at frame rates of 100 Hz and 30 Hz, respectively. However, this study exclusively focuses on data obtained from the Kinect sensor.
In addition, in this dataset, there are sets of incorrect movements performed by the subjects, such as performing incorrect ways for deep squats where the upper torso is not being kept vertical during the squat, knees are not being aligned or loss of balance. On the other hand, correctly performed movements are assisted by experts and rehabilitation professionals. Thus, this dataset is applicable to be utilised in mathematical derivation with the goal of mathematically modelling the therapy movements and establishing performance measures for the evaluation of patient persistence in performing prescribed rehabilitation exercises.
In this study, utilised 6 out of the 10 available exercises: Deep Squat, Hurdle Step, Inline Lunges, Sit to Stand, Standing Active Leg Raise, and Standing Shoulder Extension. The selection was motivated by (i) their clinical relevance in physiotherapy programs (involving large lower- and upper-limb joints), (ii) their suitability for spike train encoding due to clearer movement patterns, and (iii) consistency with several prior HAR studies that also focus on subsets of UI-PRMD for methodological benchmarking. The remaining 4 exercises were excluded in this work as they involved subtler trunk/upper body movements, which produced less distinctive spike patterns, but are acknowledged as a direction for future extension, as per depicted in Fig. 3 respectively.

Sample of exercises and raw data from UI-PRMD Datasets58.
The dataset provides both Cartesian joint positions (XYZ) and orientation angles (Euler YXZ). This study utilised only the joint position data to generate spike trains, as spatial coordinates are more directly suited for rasterization and spike encoding. Orientation features were not fused into the present model to avoid additional complexity, though they remain a promising direction for future work to improve multimodal robustness in rehabilitation movement classification. The Kinect skeletal model records 22 joints, as illustrated in Fig. 4. Finger joints are not part of the Kinect output and thus were not available in the dataset. Consequently, our analysis is based on these 22 tracked body joints, which are sufficient for assessing the correctness of the rehabilitation movements considered in this study. For UI-PRMD, correct trials participate in the 6-class exercise recognition task, whereas incorrect trials are reserved for the correctness assessment analysis (firing-rate metrics and correctness prediction). Consequently, UI-PRMD results are reported both as 6-class recognition (for comparability with other datasets) and as correctness assessment (binary). The YXZ triplet of Euler angles is used to indicate the angle outputs for every joint.

Joints in the skeletal model of the Kinect-recorded data.
Kinect 3D active (K3Da) dataset
Kinect 3D Active dataset (K3Da)59, which is a pragmatic clinically human action dataset on some relevant exercises’ movement prescribed to patients based on standard clinical assessments used to assess movements in disease and frailty. This dataset contains skeleton and depth data of 13 movements performed by 54 participants of young and older adults (aged 18–81) with various weights (44 kg – 133 kg) and heights (148 cm – 190 cm). The participants were given a maximum of three attempts to complete each exercise and were prompted by a countdown timer to start. Data throughout the session were recorded and stored automatically. The movements are based on the Short Physical Performance Battery (SPPB)60 protocols recorded in a lab-based indoor environment with a single Kinect One 3D sensor connected with Microsoft Windows Software Development Kit synchronised capture of depth and skeleton stream at 30fps.
Depth data contains 16 bits, which includes 13 bits for depth and 3 bits to identify the person index. For the skeleton data, 25 joints are being tracked with given joint positions as x, y, and z coordinates in meters, and the values are stored in.txt format. For the sample of the dataset, as in Fig. 5. K3Da consists of 525 tests from 54 subjects resulting in over 225,000 frames of depth and skeleton data. However, these studies only focus on five main movements on skeleton data: balancing with open eyes, Chair Stand, jumping with maximal power, One Leg Balance, and walking towards Kinect. Fig. 5 illustrates the environment of the recording session where the Kinect One Sensor was attached horizontally to a tripod at a height of 0.7m and the example output of the K3Da dataset.

(a) Environmental setup for the recording session; (b) Example output; (c) Sample data of the K3Da dataset61.
Self-collected dataset
The self-collected Dataset was developed in-house by the Computer Engineering Department, Faculty of Electrical and Electronic, Universiti Tun Hussein Onn Malaysia (UTHM) in 2019. This collection aims to employ the Kinect sensor for capturing body movements during rehabilitation sessions and automatically evaluate patient performance and adherence to the recommended exercises. The data collection was held indoors at the Computer Networking Laboratory, UTHM. The data collection consists of 5 rehabilitation movements performed by ten healthy subjects (aged 20–31 years old). The exercises performed in this dataset are depicted in Fig. 6.

Data collection environment for the Self-Collected dataset using Kinect Xbox One (RGB-D; skeletal joint tracking). Participants’ faces are blurred to preserve anonymity. Camera height ≈ 0.80 m, distance ≈ 2 m, frame rate =30 fps. Exercises: (1) Deep Squat,(2) Hurdle Step, (3)Inline Lunge, (4) Sit-to-Stand, (5) Standing Leg Raise, Standing Shoulder Extension.
Each movement in the collection was first shown to a subject before they completed three repetitions of it; at the conclusion of the repetitions, the subjects were not requested to maintain their body posture. The motivation for selecting the movements is from several related works that are similar to this research goal, the evaluation of rehabilitation exercises. For61, the work adopted a data set consisting of lower limb movements, such as deep squats, sit-to-stand, knee flexion, hip flexion, and straight leg raise for the development of automated segmentation of the repetitions in each exercise using the machine learning method. On the other hand, in62, the study reported a technique for evaluating the consistency of completing several physical therapy exercises: deep squats, inline lunges, sitting knee extension, and standing knee extension. Besides, another motivation in selecting the movements is because clinicians commonly use the movements as part of rehabilitation programs or as a component of physical examinations for a variety of illnesses, including upper and lower body ailments and recuperation from surgery. This dataset’s movement selection was not meant to address rehabilitation for particular medical or musculoskeletal disorders.
The movements are directly recorded two meters away in front of a sensor device, Kinect Xbox One, at 30fps with real-time capture by MATLAB software. The device was fixed to a tripod with a height of 0.8 m and was placed 2 meters away from the subject, as illustrated in Fig. 7.

Environmental setup for self-collected dataset.
This is to ensure the device can fully track the whole skeleton joints for a subject. If it is being placed too close (less than 2 meters), some joints might be opted out, or if it is being placed too far (more than 2 meters), it will be difficult to distinguish small movements visually.
The motivation for collecting this dataset was to complement the UI-PRMD and K3Da datasets by providing a controlled, smaller-scale collection under local conditions. While UI-PRMD includes 10 repetitions per exercise with more subjects, in dataset offers fewer repetitions and participants, making it more representative of scenarios where limited patient data is available, such as early-stage rehabilitation or home-based monitoring. Additionally, the exercises selected (squat, lunge, heel raise, sit-to-stand, leg raise) are among the most commonly prescribed in physiotherapy, ensuring clinical relevance. This dataset also allowed us to validate the proposed spike-train encoding framework in a new environment (university lab with Kinect Xbox One), demonstrating that the method generalizes across different collection settings, subject populations, and dataset scales. Thus, the dataset adds value not by scale but by practicality, complementarity, and validation under realistic constraints.
Spike generation
This work investigated a number of CNN classification models and proposed an algorithm that incorporates spike train features into a DL technique. The experiment was carried out using a normal CPU, and the computational time was varied based on the CNN layers. Spikes Techniques for monitoring large-scale neuronal spiking activity are thriving, leading to increased demand for neuronal encoding algorithms. Fig. 8 shows the pipeline used for spike generation.

Spike-train generation and analysis pipeline. Raw skeletal joint positions (XYZ) are centered (hip-referenced) and z-normalized, then temporally differenced; per-joint adaptive thresholds convert motion magnitudes into binary spikes. Spikes are rasterized (joints×frames) and windowed (length WWW, overlap α\alphaα). Windows feed a CNN for 6-class exercise recognition; firing-rate features support correctness assessment on UI-PRMD. Evaluation uses subject-aware CV (UI-PRMD and Self: LOSO; K3Da: repeated Group 10-Fold) with 5 seeds; metrics reported as mean ± std and 95% CI.
Raster plot formal representation of spike trains
Previously, two such time-resolved measures have been proposed: ISI-distance (DI)36 and SPIKE-distance (DS)33, which both rely on instantaneous estimates of spike train dissimilarity, which make it possible to track changes in fast clustering. Both metrics, which are defined as the temporal average of the corresponding time profile, have already been applied extensively in a variety of scenarios:
The ISI distance and SPIKE distance are bounded in the interval [0,1], where the limit value of 0 is obtained only for perfectly identical spike trains. These measures are conceptually simple, computationally efficient, and easy to visualise in a time-resolved manner.
Another timescale-independent and time-resolved method is event synchronisation, a sophisticated coincidence detector of the quasi-simultaneous appearance of spikes where it is used only for bivariate context. However, to involve substantial changes in the original event synchronisation, a SPIKE-synchronization, SC34, were introduced and defined as the average value of this profile:
with M = \(\sum_{n}^{N}{M}_{n}\) indicating the pooled spike train’s total number of spikes. SC measures the percentage of coincident spikes in spike trains; it is zero for spike trains with no coincidences and one if and only if spike trains include coincident spike pairs. The SPIKE-synchronization is only defined at the times of spikes. However, a better visualisation can be achieved by accumulating the dots in a raster plot, which leads to a significant spike pattern.
With all these measures, spike trains can be analysed on different spatial and temporal scales; accordingly, there are several levels of information extraction. In the most detailed representation, one instantaneous value is obtained for each pair of spike trains. The most condensed representation of successive temporal and spatial averaging leads to one significant pattern that describes the overall level of synchrony for a group of spike trains over a given time interval.
A raster plot, as illustrated in Fig. 9, is a simple method to visually presenting spike trains, where each black bar or short vertical line represents one spike or action potential, and each row of black bars (or a spike train) represents the spiking activity of a neuron over a period of time.

A raster plot of a set of spike trains.
Firing rates derivation
The process of converting data from physical space into neural space is known as neural encoding. Neural space includes the characteristics of neurons, such as firing rate, population, and dendritic spine density, whereas physical space includes the physical attributes of objects, such as direction, joint angle, speed, colour, and loudness. As seen in Fig. 10, a tuning curve is a straightforward graphical depiction of neuronal encoding in which the physical space is represented by the x-axis.

Example of the tuning curve.
In contrast, the y-axis represents the neural space. Simulating spike trains into the tuning curve is solely to understand the significance of the firing rate in neural encoding. This study illustrates an average firing rate by plotting another fundamental, a tuning curve for the spike trains of each exercise performed by a subject. The tuning curve eventually gives the average firing rate of the spike trains across trials and throughout a stimulus. To calculate this average rate, a more straightforward formula was implemented, trial-averaged rate, ⟨r⟩_trials which is:
Where ⟨r⟩_trials also denoted as the value of the average firing rate for the corresponding set of spike trains of an exercise. Hence, to evaluate the movement correctness value, this study adopts two statistical analyses to calculate the comparison between two average rates: a ground truth and a test value, Mean Percentage Error (MPE) as shown in equation 4, and Mean Absolute Deviation (MAD) as denoted in equation 5.
where \({a}_{t}\) is the correct angle value of the exercise performed, \({f}_{t}\) is the incorrect angle value, and \(n\) is the number different for which exercise is performed.
Where \(n\) is the number of sequences of each movement; therefore, this calculation is able to estimate the dispersion or how spread the incorrect movement is from the correct movement.
Spike classification using convolutional neural network
In this study, spiking representations can outperform conventional representations, or at least the spike trains are even as good as the conventional ones. To verify this issue, a simple classification task is constructed, and the performance of each approach is compared.
CNNs are powerful neural network architectures specializing in image-related tasks. They excel in image recognition, classification, and generating image captions. CNNs are crucial in technologies like robotic vision and autonomous driving, featuring a unique architecture that differs from traditional neural networks. Their design enables more efficient processing and pattern recognition of visual data.
CNN layers are arranged in three dimensions: depth, breadth, and height. Furthermore, a layer’s neurons only associate with a subset of neurons rather than all of them. Therefore, a single vector of probability scores created along the depth dimension is all that remains of the final output. Convolutional, pooling, and fully connected layers are the three primary layer types found in CNN architecture. These layers are stacked together to perform a complete CNN architecture. There are also supporting layers, such as the Rectified Linear Unit and the Normalization layer. Fig. 11 illustrates an example of CNN architecture.

Example of CNN architecture.
This section describes the CNN architectures adopted in this study: ImageNet, GooLeNet, ResNet18, ResNet101, and proposed CNN, contain different depths as the architectures employed different numbers of convolution and pooling layers. Note that one of the goals of this study is to propose a CNN-based module that is computationally efficient to train and recognise spike significance patterns. The model parameters of each CNN architecture employed in this study are shown in Table 2. The original input images are 798×720×3 and are being downsampled according to the specification of the CNN architectures in order to reduce memory requirements. From visual observation, downsampling the images does not lose any critical structure as compared to the original images.
The proposed CNN architecture has almost the same architecture as ResNet18 and ResNet101. This choice was motivated by the strong empirical performance observed in prior studies behind the excellent performance of these architectures is that these architectures do not learn large weights and biases in order to learn input/output mapping. However, ResNet18 layers are undersized to train a bulk of data despite the low time consumption on training time, while ResNet101 is excessively large where it requires some time to train corresponding to its depth.
Hence, the proposed CNN is fifty-one layers deep and composed of forty-nine convolutional layers, an average pool end with two fully connected layers containing 1000 nodes with a dropout with the probability set to 0.5 and a linear softmax layer that outputs the probability of each of the five exercises. Table 3. summaries the proposed CNN architecture, Table 4. explains the structure of identity blocks, and Fig. 12 illustrates the architecture of the proposed CNN, as explained in Table 3.

Architecture of the proposed CNN model, with connected layers with a dropout probability of 0.5 and a final softmax layer for classification.
As from Table 3, the proposed CNN architecture contains the following elements: A convolutional with a kernel size of 7×7 and 64 different kernels, all with a stride of size 2, counts as 1 layer. Next, the architecture is followed by 4 convolutional layers where, each of them was three layers deep and then repeated with identity blocks of 2, 3, 5, and 2, respectively. The three layers are 1×1, 3×3 and 1×1 convolutions, where the 1×1 layers reduce and increase dimensions, which results in smaller input/output dimensions Conv block. total up together with 16 convolutional layers × 3 layers deep, resulting in 48 convolutional layers.
At the end of a CNN, the output of the global average pooling layer acts as an input to fully connected layers. It supplies the result to the input of each unit in the fully connected layer with a 0.5 probability dropout applied. Dropout is applied to avoid the proposed CNN from overfitting as the technique turned off some neurons from the fully connected layers forcing the layers to learn the same concept in different ways.
(a)
For dataset partitioning, the adopted a 70:30 train–test split, consistent with common practice HAR research66,67. This ratio provides sufficient training data while retaining a robust test set for evaluation. Other ratios (80:20, 60:40) were explored during preliminary experiments but yielded less stable performance. Regarding architecture, the proposed 51-layer CNN was designed as a variant of ResNet, incorporating residual connections for stable gradient flow. Unlike the standard ResNet-50, which is tuned for large-scale natural images, in model was adapted specifically for rasterized spike-train inputs by integrating two fully connected layers with dropout regularization. This design was chosen to balance representational power with computational efficiency, avoiding underfitting observed in ResNet-18 and overfitting observed in ResNet-101. As a result, the customized 51-layer model achieved the best trade-off in recognition accuracy and efficiency across all datasets.
This study employs two fully connected layers as the higher number of fully connected layers leads to more complex and powerful NN architecture. However, this condition was too risky for overfitting. Thus, two fully connected layers are enough and a safe amount to avoid overfitting. Overfitting is identified by validating the accuracy of the training, which usually increases until a point that stagnates and starts declining when the model is affected by overfitting. Lastly, a softmax layer was placed as an output of the fully connected layer depicted in Fig.12(b). The softmax layer calculates exercise probability, identifying the highest probability exercise as the recognized one, and outputs the exercise label to the final node for visual purposes.Task setup. adopt a two-stage formulation: (i) a 6-class exercise recognition model trained and evaluated on UI-PRMD, K3Da, and the Self-Collected dataset; and (ii) a movement correctness assessment module evaluated where incorrect trials exist (UI-PRMD). The correctness module uses spike-train firing-rate features (MPE/MAD) and a correctness prediction head. It is not by merging exercise identity and correctness into a single 12-class label space because (a) K3Da and the Self-Collected dataset lack incorrect labels, and (b) a two-stage design aligns with clinical workflows (first recognize the exercise, then assess correctness).
Evaluation protocol and robustness
Eevaluate robustness using subject-independent cross-validation and multiple random initializations. For UI-PRMD and the Self-Collected dataset, adopting Leave-One-Subject-Out (LOSO) cross-validation (10 folds). For K3Da, by employing Group 10-Fold cross-validation with subject IDs as grouping variables, repeated 5 times with different random seeds to stabilize fold assignments. Within each fold, by training the classifier S = 5 times with different random initializations and data shuffles. the report Accuracy (mean ± std), macro-F1, and 95% confidence intervals aggregated across seeds and folds. All splits are subject-level to preclude any leakage of trials from the same participant into both train and test sets. An internal validation set is drawn only from the training subjects for early stopping and model selection. Results reported earlier as single-run point estimates are replaced by cross-validated mean ± std (and CI) to reflect variance across runs and folds.
Experimental outcomes and discussion
This section presents the results of the physiotherapy movement’s recognition problem throughout the research. The proposed framework is evaluated through three datasets discussed in the previous section where each has a different level of complexity; however, the proposed framework can be implemented on all of them.
Significant pattern of spike train
Pattern recognition forms the basis of learning and action for all living things in nature as patterns are all around us, from human fingerprints, zebra crossing, etc. People grow up by recognizing various objects around us and learning to know, understand, and respond to identified things. Hence, this study develops a significant pattern for each of the exercises in order to differentiate each of the exercises by utilising the benefit of spike trains. The amount of information transmitted by a neuron, which is the spike trains, depends on assumptions about how the movement is read off. This study distinguished between exercise decoded according to the spike patterns. Spike patterns are as a “word” made up of a sequence of “letters”, considering each letter signifying the presence or absence of a spike, 1 or 0.
The information in the spike pattern was obtained by subdividing a window of frames from the cumulative frames or sequences—each of the datasets having different window sizes and is discussed thoroughly in each subchapter below. Overall, the movements definitely had a unique and significant pattern, which was very reliable for further analysis.
UI-PRMD dataset results
UI-PRMD dataset consists of segmented and unsegmented movements. To illustrate the patterns, this make use of the segmented movements in which each of the subjects performs ten episodes for each exercise. However, the sequences’ number for each exercise may vary from 100 to 150 frames. Hence, to standardize the number, the first 100 sequences are extracted per exercise. As illustrated in Fig. 13, some patterns are quite similar to each other. Note that all the patterns are correct movements. On 12-class alternatives. While UI-PRMD enables a 12-class (exercise correctness) framing, in cross-dataset design (including K3Da and Self-Collected without incorrect labels) and clinical interpretability motivated a two-stage approach. Future work could train a 12-class model on UI-PRMD and explore transfer of correctness cues via semi-/self-supervised adaptation to datasets lacking incorrect labels.
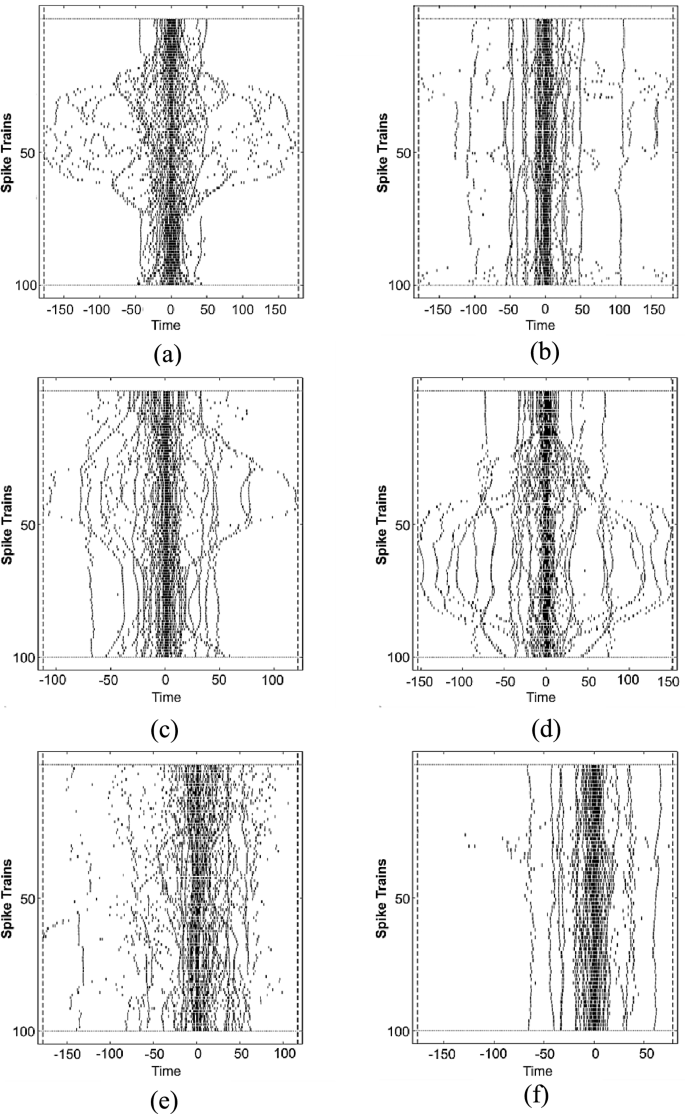
(a) Deep Squat; (b) Hurdle Step; (c) Inline Lunges; (d) Sit-to-Stand; (e) Standing Shoulder Extension; (f) Leg Raise. Phase-aligned bursts differentiate downward/upward phases; upper- vs lower-limb activation contrasts are visible. Time scale unified across panels.
For example, Patterns for Deep Squat (Fig. 13a), Inline Lunges (Fig.13c), and Sit to Stand (Fig. 13d) are look-alike due to the same direction of the exercises, which is up to down direction including the knee flexion and extension movements. While Hurdle Step (Fig.13b) is a reverse direction of them, which makes it differ from the mentioned figures. Shoulder Extension (Fig. 13e) and Leg Raise (Fig. 13f) can be said identical to each other, as there is a straight standing movement with no knee flexion and extension. Hence, the patterns for three of the exercises quite resembled each other. Although the patterns look the same, there are slightly different as spikes in the Shoulder Extension patterns entirely disperse than Leg Raise patterns. This is because the exercises involve different movements for each of them, such as Shoulder Extension implies an extended arm with straight elbow and wrists while Leg Raise, raising a straight leg with no upper limb movement.
K3Da dataset results
K3Da dataset is an RGB-D data containing clinically essential movements. Different from the UI-PRMD dataset, K3Da has a more abundant number of sequences within 300 to 600 frames where there is no break between the repetitions of a movement. Thus, this study standardizes the sequence number to 300 frames each except for the “Walking towards Kinect” movement, where it has smaller sequences than the others. As mentioned earlier, only five movements have been selected for this study.
Fig. 14 depicts five examples of significant patterns of the movements for a subject. The figure illustrates the fact that each of the movement carried a unique pattern for itself. From the figure, the movements can be clearly recognized. For example, Balance (Open Eyes) is depicted in Fig. 14 (a), which is had a similar pattern with Fig. 14(d) for One Leg Balanced (Open Eyes). Just that, for One Leg Balance movement, the pattern showed it is quite unstable for a person to stand with one leg, especially for someone with poor postural control as the person need to keep the Central of Mass (CoM) over the Base of Support (BoS).
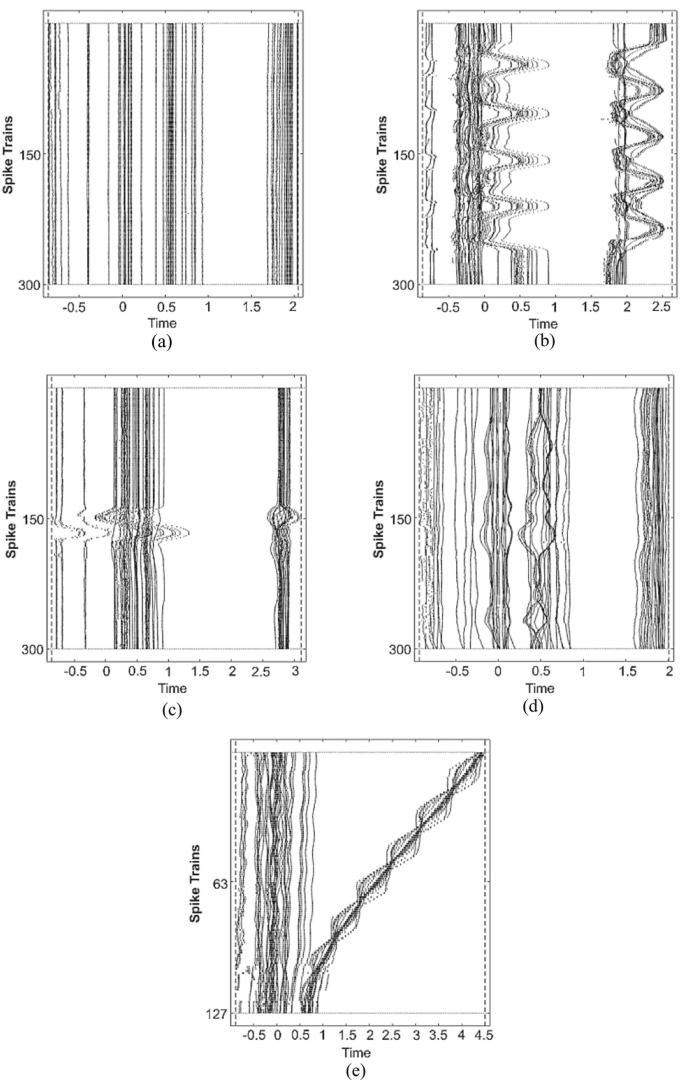
(a) Balance (Open Eyes); (b) Chair Stand; (c) Maximal Jump; (d) One-Leg Balance (Open Eyes); (e) Walk-towards-Kinect. Longer sequences (300–600 frames) show distinct temporal envelopes; repeated sit–stand cycles vs single explosive jump are visible in the raster patterns. Sample patterns of spike train in raster plot for K3Da dataset.
Next, the Chair Stand is illustrated in Fig. 14 (b), and the maximal jump is in Fig. 14 (c). For both patterns, Chair Stand showed repeatedly stand and sit movements, thus resulting in the pattern in Fig. 14 (b). However, for the Maximal Jump, the movement starts with a standing position and jumps with maximal energy, leading to a big wave on the straight-line pattern. Finally, walking towards Kinect is shown as in Fig. 14 (e), which is the shortest length of time for a movement. The spiking activities in all the movements make it worth producing a unique and significant pattern that can be visually categorized the patterns into the respective classes.
Self-collected dataset results
Among the three datasets, the self-collected dataset has the least number of sequences as only 25 to 30 sequences per movement were captured. Thus, this study standardizes the sequences to 25 frames each movement. The movements still showed a unique pattern for each of them. Although it is difficult to recognize the exercises visually, still, each of the patterns has its own way to portray the movement. Fig. 15 shows the patterns for five movements adopted in this dataset.
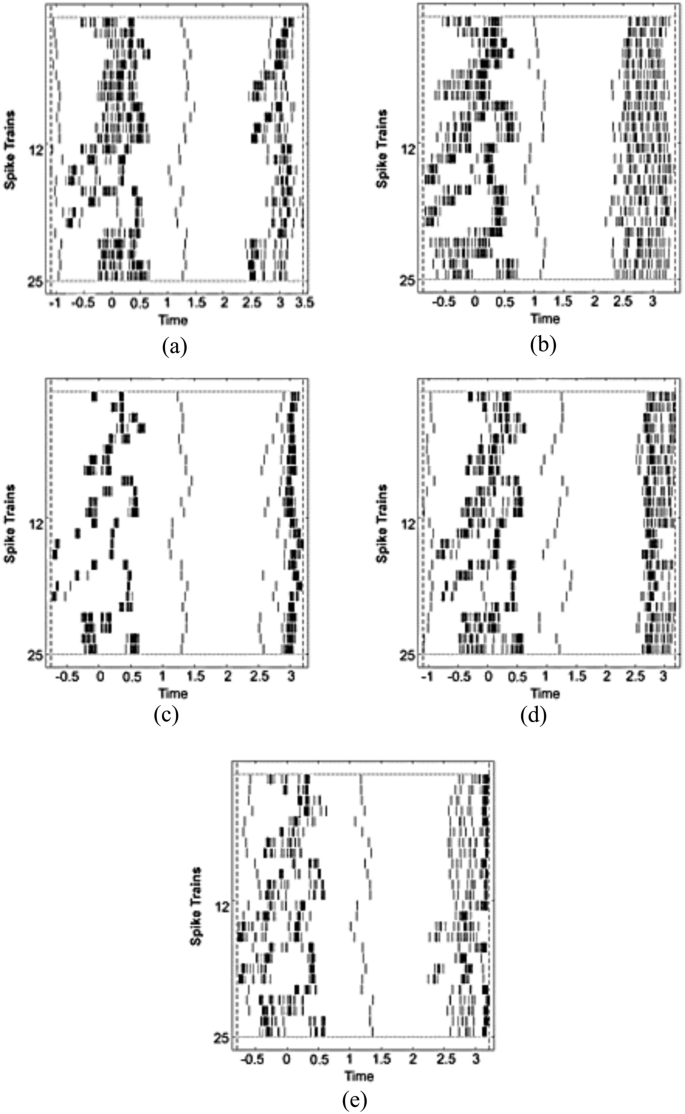
(a) Squat; (b) Lunges; (c) Heel Raise; (d) Sit-to-Stand; (e) Leg Raise. Despite short sequences (~25 frames/movement), each class exhibits a characteristic spike signature suitable for recognition.
Accurate movement by adjusting average firing rate curves
The tuning curve, which illustrates the connection between a neuron’s output and stimuli, is an essential part of neural information encoding. Three factors should be taken into consideration while optimising tuning curves to enable neurons to encode information efficiently: the definition of information efficiency, the computation of energy assumption, and the input probability distributions. The first two approaches were considered in this study, where the orientation of movement was considered the information efficiency and the average firing rate was considered the energy consumption.
The plot of the tuning curve of such neurons gives the average firing rate of the neurons as a function of the orientation of the oriented movement. This average typically represents both an average over time and an average of several trials of the identical movement. Other than the tuning curve characterising the average activity of a neuron’s response to a movement, this study is also interested in knowing more about the exact nature of the neuron’s response rate as follows:
-
1.
How does the rate of neuron firing during a movement performed differ over orientation?
-
2.
How regular or irregular is the spacing between individual spikes during a trial?
-
3.
How different are the trials of exercises from another?
This study proposed a movement correctness feature by calculating MPE and MAD from the tuning curve of average firing rates for a movement to answer the mentioned arguments. This is to validate the movements’ progression of a subject towards the ground-truth value, where the subtle differences between subjects’ performance and a ground-truth value are classified. A ground-truth value is chosen among the subjects with healthy and correct movement within the dataset. However, the ground truth value is only applicable to K3Da and the self-collected dataset only. For UI-PRMD, this study compares the incorrect movement of subjects to the correct movements, as the incorrect movements were provided in the dataset. Each of the subjects basically had a different number of frames while doing the exercises, but the firing spikes were still similar to each other.
UI-PRMD dataset results
UI-PRMD Dataset is a physical rehabilitation movement which comprises 100 instances of 10 rehabilitation movements where the primary goals of this dataset are to mathematically model the therapy movements and establish performance measures for clinically evaluating patients’ progression in performing prescribed rehabilitation exercises. Besides, the dataset also provides examples of the movements performed incorrectly for every subject. Incorrect movements include the wrong direction of movements, subjects’ faults, etc. The patterns of firing rates for each exercise are quite different from one another. Hence, this study compares the average firing rates of the incorrect movement to the corresponding correct movement for a subject.
Fig. 16 compares six correct and incorrect movements; the blue line marker is used for the correct movement, whereas the red line symbolises incorrect movements. This study takes into account five subjects for the evaluation of movement correctness; however, only graphs by a subject are displayed in this section as a sample. The graph shown shows exercises performed by a subject, who is a male graduate student from the University of Idaho. He is slightly overweight, with a body mass index of 26.6. As from the figures, the rate of neuron firing has slightly differed for each movement across orientations. The hurdle Step (Fig. 16(b)) and Standing Active Leg Raise (Fig. 16(f)) might have similar spike trends as physical exercises have the same gesture of movement. Also, the graph of the firing rate for the movements fluctuates vigorously due to the repetition of full-body movements. Thus, this shows that there are high regularity spikes firing between spaces for both correct and incorrect movements.

Average firing rates for a subject’s six right and wrong movements are compared.
Table 5. summarizes the results of the comparison for each movement, including the MPE, MAD, and movement correctness percentage, where it shows that the subject has the highest error on the Shoulder Extension movement and the lowest error on the Inline Lunges movement. This indicates that the subject might be having difficulties with the upper limbs instead of the lower limbs. Plus, from Fig. 13 (e), the tuning curve for the incorrect movement was very discouraging as it reversely inverted from the correct movement. Hence, the MAD value for shoulder extension is the lowest, indicating that the incorrect movement firing rates have deviated away from the correct movement.
K3Da dataset results
K3Da dataset consists of 13 movements adopted from SPPB, TUG, and additional tests of balanced output. As mentioned in the previous section, this study only employed five movements: Balance open eyes, chair stand, maximal jump, one leg balance open eyes, and walking towards Kinect. These clinically relevant assessments were led by the experts following standardized protocols. However, this dataset does not include incorrect movements. Hence, this study proposed to set a ground truth value among the fifty-four subjects in the dataset. A young, healthy, fit, and athletic subject has been chosen for the ground truth value due to the correct performance of the exercises by him. Five subjects have been chosen to be evaluated and assessed based on the likelihood of the individual sequences from a ground truth subject.
The analysis of five exercises, as illustrated in Fig. 17 reveals variations in movement performance across subjects. The balance open eyes exercise (Fig. 17a) showed minimal firing rate fluctuations, with slight variations due to individual differences and sensor positioning. Chair Stand movements (Fig. 17b) exhibited more significant firing rate changes, with subjects demonstrating different movement patterns and potential balance challenges around 60-degree orientation. The Maximal Jump exercise (Fig.17c) highlighted differences in balance, with the ground truth showing a smooth tuning curve, while Subject 1 displayed small fluctuations. One Leg Balance exercise (Fig. 17d) demonstrated frequent firing rate fluctuations, indicating balance difficulties, with most subjects experiencing sways. The Walking Towards Kinect exercise (Fig. 17e) showed decreased firing rates as subjects approached motion sensors. Table 6 provides comprehensive metrics including MPE, MAD, and movement correctness, quantitatively supporting the visual observations in Fig. 17 and revealing the nuanced performance differences across exercises and subjects.

Comparison of Average Firing Rate of five subjects based on ground truth for (a) Balanced Open Eyes; (b) Chair Stand; (c) Maximum Jump; (d) One Leg Standing Open Eyes; (e) Walking towards Kinect.
Self-collected dataset results
The self-collected dataset consists of five movements chosen from full-body exercises for muscle strengthening exercises to increase muscle strength and gain better balance, mobility, and ability in order to enjoy a healthy lifestyle. The five movements are squat, lunges, heel raise, sit to stand, and leg raise. These exercises are movements utilised by most patients, e.g., stroke patients or people who were aiming to control or reducing weight.
As per the previous dataset, this dataset also does not include incorrect movements. Hence, this study proposed to set a ground truth value among the ten subjects in the dataset. A young, healthy, fit, and athletic subject has been chosen for the ground truth value due to the correct performance of the exercises. Four subjects have been chosen to be evaluated and assessed based on the likelihood of the individual sequences from a ground truth subject. Most of the subjects are young and healthy; hence there is not much discrepancy in the likelihood. In this section, the graphs of five movements evaluated are discussed, and correctness metrics are tabulated, respectively.
The comparison of firing rates of five exercises (Squat, Lunges, Heel Raise, Sit to Stand, and Leg Raise) illustrated in Fig. 18 and detailed average correctness metrics in Table 7. reveals nuanced variations in subjects’ movement performance. The Squat exercise showed similar firing rate trends across subjects, with slight orientation differences attributed to varying frame rates. Lunges exercise demonstrated minimal spiking event variations between subjects and ground truth. Heel Raise exercise exhibited neuron spikes closely following ground-truth values, with an average percentage error of 22.65 but a high likelihood of matching ground truth. The Sit to Stand exercise revealed uniform neuron spiking, with Subject 4 showing the highest error (PE = 46.18). The Leg Raise exercise, performed while seated, showed the least aggressive neuron spike fluctuations, with Subject 1 closely following the ground truth (PE = 1.99) and Subject 3 experiencing significant rate drops. Table 7. quantitatively supports these observations, highlighting individual subject variations in MPE, Mean Absolute Deviation (MAD), and overall movement correctness across different exercises.

Comparison of Average Firing Rate of four subjects based on ground truth for (a) Squat; (b) Lunges; (c) Heel Raise; (d) Sit to Stand; (e) Leg Raise.
Recoginition rate
Recognition rate, also known as the accuracy of a DL classification algorithm, is one way to measure how often the algorithm classifies a data point correctly. The recognition rate is the number of correctly identified images out of all the images. Consider a classification algorithm decides whether to classify an image to its class; the algorithm is trained with several images and its label. Then, the efficiency of the algorithms to classify a new image to its class is evaluated.
To prepare it for training, the data sample is first divided into two disjoint groups for this study: training data and test data, respectively, using a standard ratio. This ensures that CNN has sufficient learning samples, which are acquired through the weight update procedure. The test samples are used to assess the generalization ability of the network. Supervised mode is used since each training sample has a label associated to it. The experime30nt makes use of Matrix Laboratory (MATLAB) software.
For the classification phase, this study trains using several CNN models and compare the classification method with five different number of layers: 25, 72, 144, 177, and 347 layers with respect to 6 epochs for all the classifiers. An adequate number of epochs is important and needs to be considerately chosen to avoid underfitting and overfitting. A number of epochs depends on the dataset trained; different datasets might have a different number of epochs. A lack number of epochs leads to underfitting, and too many epochs cause overfitting to take place. The last fully connected layer of each of the models has been modified to befit the dataset—the validation time increases as the number of layers gets bigger.
Fig. 19 depicts the overall physiotherapy movement recognition for all datasets, UI-PRMD, K3Da, and self-collected together with the five CNN models adopted in this study. Proposed CNN outperformed the other models with the highest recognition rate of 0.9944 for UI-PRMD, 0.9821 for K3Da, and 1.00 for self-collected data. Details on the results were being discussed in these sub-sections.

Overall physiotherapy performance recognition rate.
UI-PRMD dataset results
Table 8 tabulates the recognition of UI-PRMD datasets classified by several CNN architectures, and Fig. 20 illustrates the comparison of recognition among the five of them.

UI-PRMD Recognition Rate by CNN architectures.
As a result, the proposed CNN over performs as shwon Fig. 21 The proposed CNN classifier for 6-class exercise recognition on UI-PRMD achieved a RR of 0.9944, with a confusion matrix showing similar spike patterns in Deep Squat and Inline Lunges, with slight shifts to Sit to Stand.
Confusion Matrix of recognition rate by proposed CNN for UI-PRMD dataset (RR = 0.9944).
In24, a DL framework has been demonstrated for assessing UI-PRMD datasets. There are three deep NN architectures being compared in work, which are CNNs, recurrent neural networks (RNNs), and hierarchical neural networks (HNNs). To the extend of my knowledge, this work can be said as the first framework that employs deep NNs for assessment of rehabilitation exercises. Three of the networks utilize skeletal joint coordinate data as the input; however, for HNN, the input is parted by five divisions: right arm, left arm, trunk, right leg, and left leg. Table 9. tabulates the comparison results for each exercise based on different approaches.
Despite the excellent performance, there are several limitations to this approach. A significant source of the restriction is due to the rehabilitation exercises collected that were performed by healthy subjects instead of patients in the rehab program. This study also falls short of addressing medical experts’ ground-level evaluation of the movement quality.
K3Da dataset results
Table 10. tabulates the recognition of K3Da datasets classified by several CNN architectures, and Fig. 22 illustrates the comparison of recognition among the five of them.

K3Da recognition rate by CNN architectures.
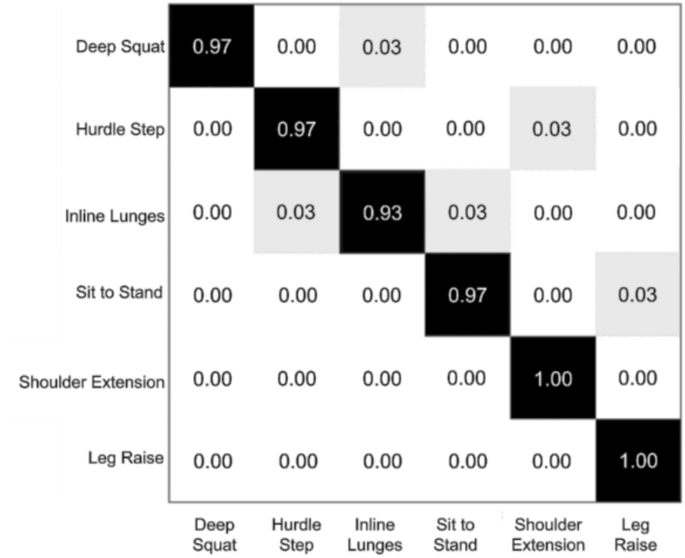
For K3Da, proposed CNN still overperforms other layers with 0.9821 accuracy. Fig. 23 explained the shifted recognition rate in a confusion matrix for the proposed CNN classifier. It achieved to classify all the classes correctly with 1.00 accuracy each of the exercises except for one leg balance exercise with 0.90 accuracy with a slight shift of 0.10 to the Jump exercise.
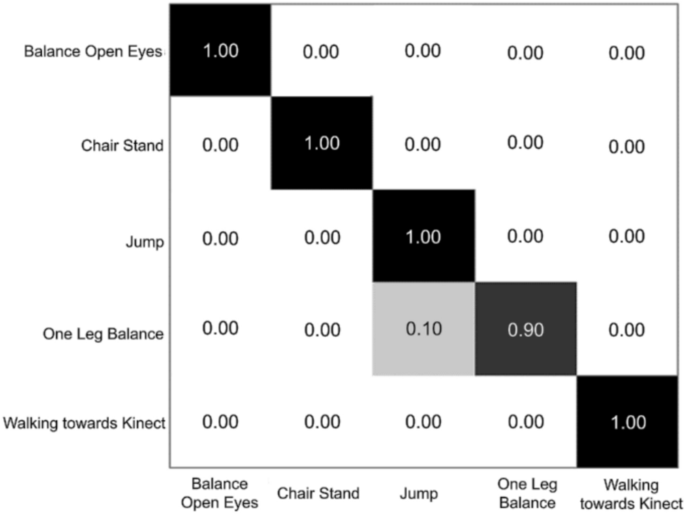
Matrix of recognition rate by proposed CNN for K3Da dataset (RR = 0.9821).
This is due to the similarity of both patterns, as compared in Fig. 24. For Jump movements, there is a wave on the spike patterns (as highlighted in the red box), where it is a natural pattern for One Leg Balance Exercise. Hence, a slightly shifted of one leg balance pattern to Jump are acceptable.

Jump and One Leg Balance pattern comparison.
In51, a bench marking identification rate of the K3Da datasets is developed to evaluate the ability to identify each test case. Daniel et al. adopted approached that are implemented in other engineering problems such as SVM, Random Forest (RF)69,70, Artificial Neural Networks (ANN)71,72,73, and Gaussian Restricted Boltzmann Machines (GRBM)74,75,76 with additional 10-fold cross-validation on each method for the preliminary evaluation. These works remove irrelevant information, resulting in a minimal training set. To generate a more representative result, the study randomly selecting a 40/60 training and testing set relying on the selection of k parameter for k-means. While for77, propose a hybrid of CNN for classification and implementing K-Mean Clustering to convert a time-series into a set representative pose. Table 11. summarised the results of both works discussed in this section and compared to the proposed CNN. Note that not all movements adopted in the study being evaluated in the compared work. Hence, the comparison only for the movements adopted in the proposed framework and the compared works as well.
Out of three movements compared, proposed CNN achieved a significant accuracy, and the obtained values are acceptable; thus, this study demonstrated that spike train features with DL approaches are able to outperform traditional methods. These results are encouraging and promising for further works.
Self-collected dataset results
Table 12. tabulates the recognition of K3Da datasets classified by several CNN architectures, and Fig. 25 illustrates the comparison of recognition among the five of them.

Self-collected recognition rate by CNN architectures.
From the results compared, it is clearly stated that proposed CNN outperforms others model by achieving 1.000 accuracy. Confusion matrix for proposed CNN has been drawn as in Fig. 26.
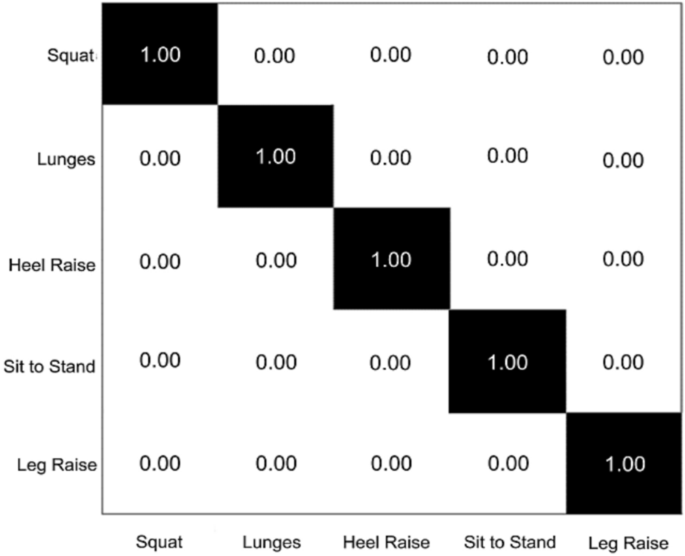
Confusion matrix of recognition rate by proposed CNN for self-collected datasets (RR = 1.000).
Since the self-collected datasets is primary data, there is no previous work on this datasets. However, this study intends to classify and compare the performance with several traditional machine learning. The data were split to 70:30 ratio of training and test, respectively. The results of the performance as tabulated in Table 13. From the results, proposed framework, again, outperform other algorithms, plus this also proves that spike train features were fitted to be classified on various classifier with the favorable recognition rates.
Physiotherapy assessment validation
There is a demand for tools and equipment to support home-based rehabilitation, also a new improvement in rehab centres, to reduce the burden for both patients and experts, such as robotic assistive devices, exoskeletons, haptic devices, and virtual gaming environments. Along with the rising motion capture sensors such as Microsoft Kinect, various Kinect-based rehabilitation assessments were developed, such as KiReS (Kinect Rehabilitation System) and VERA (Virtual Exercise Rehabilitation Assistant). Hence, the study also focused on physiotherapy assessment, where this study makes use of Kinect skeletal joint data from three datasets, where two of the datasets were public and a primary self-collected datasets.
As per the previous section, proposed CNN shows promising results in recognizing three datasets that adopted in this study as proposed CNN achieved the accuracy of 0.9944 for UI-PRMD, 0.9821 for K3Da, and 1.000 for the self-collected dataset. Hence, this study adopts proposed CNN as the primary DL architecture for physiotherapy assessment. This section produces correctness metrics for the subjects and exercises based on the training classifier. The details of the results and the validation of the assessment were explained details in each of the sub-section below.
UI-PRMD dataset results
Firstly, the proposed framework is validated by using UI-PRMD six incorrect movements of five selected subjects. The spike train patterns of incorrect movements are validated with the training classifier and the correctness metrics; accuracy, hereafter being known as correctness prediction, precision, recall, and F1-score, has been predicted.
Next, to validate the effectiveness and reliability of the proposed framework for physiotherapy assessment, this study compares the correctness metrics predicted by DL with the previously manually calculated MPE and MAD from tuning curves of average firing rates for the six movements. The validation of the physiotherapy assessment is tabulated in Table 14. and illustrated in Fig. 27, where the correctness metrics predicted by DL and the movement correctness from the firing calculation were plotted together.

Physiotherapy assessment validation for UI-PRMD.
As from Fig. 27, deep squat and inline lunges may have a slight discrepancy between the movement correctness and the correctness metrics predicted. However, the deviation is acceptable as the difference between the value of movement correctness and correctness prediction is under acceptable range which is less than 10% where 7.5% and 6.97% for deep squat and inline lunges respectively, while other values were grouping correctly and validate that the physiotherapy assessment for UI-PRMD is reliable and effective.
K3Da dataset results
Next, the spike train patterns of 5 subjects from K3Da, were validated with the training classifier and the correctness metrics; correctness prediction, precision, recall, and F1-score has been predicted. To validate the effectiveness and reliability of the proposed CNN of physiotherapy assessment, this study compares the correctness metrics predicted by DL with the previous manually calculated MPE and MAD from tuning curves of average firing rates for the five movements. The validation is tabulated in Table 15. and illustrated in Fig. 28, where the correctness metrics predicted by DL and the movement correctness from the firing calculation were plotted.

Physiotherapy assessment validation for K3Da.
As from Fig. 28, Balance open eyes and maximal jump may have a slight discrepancy between the predicted movement correctness and the correctness metrics. However, the deviation is acceptable, while other values were grouped correctly and validated that the physiotherapy assessment framework for K3Da is robust and trustable.
Self-collected dataset results
Lastly, the proposed physiotherapy assessment framework was validated using a self-collected dataset for five movements of four subjects. As per previous datasets, this study validates the effectiveness and reliability of the proposed framework of physiotherapy assessment by comparing the correctness metrics predicted with the previously manually calculated MPE and MAD from tuning curves of average firing rates for the five movements. The validation is tabulated in Table 16. and illustrated in Fig. 29, where the correctness metrics predicted by DL and the movement correctness from the firing calculation are plotted.

Validation of physiotherapy assessments for self-collected datasets.
From Fig. 29, all five movements values of predicted correctness metrics and calculated movement correctness were plotted. There is not much deviation of movement correctness from the correctness metrics. Hence, this study can conclude that the proposed framework is reliable and practical to assess physiotherapy movements in home-based or rehab centres.
Discussion
The results demonstrate that spike-train encoding combined with a tailored CNN architecture achieves superior recognition accuracy compared to conventional CNNs across multiple physiotherapy datasets. In particular, in approach achieved 0.9944 accuracy on UI-PRMD, 0.9821 on K3Da, and 1.000 on the self-collected dataset, substantially outperforming prior spike-train-based work 0.77 on UI-PRMD41,65. These findings highlight the effectiveness of bio-inspired temporal representations in HAR, especially in rehabilitation contexts where movement correctness is critical. Interpretation. Unlike skeleton-based graph models such as ST-GCNs, LSTMs, which model temporal dependencies explicitly, spike-train encoding emphasizes temporal sparsity and event timing, which appear particularly well-suited to capturing deviations in movement correctness. This bio-inspired representation therefore provides a complementary perspective to more conventional HAR models.
Limitations. Several limitations must be acknowledged. First, there are no obvious clinical claims because the datasets only include healthy volunteers with small sample sizes (10–54 people). Second, movement phenotypes specific to a condition were not included in the examination. Clinical validation studies are planned to address these limitations. First, only six of the ten UI-PRMD exercises were used, which restricts comparability with full-dataset studies even though it is therapeutically important. Second, representational richness may be limited by concentrating on joint position data rather than combining position and orientation modalities. Third, although though multiple-seed cross-validation was used, dataset sizes are still tiny when compared to large-scale HAR benchmarks, which could limit generalizability. Lastly, rather than being a 12-class exercise×correctness arrangement, The correctness assessment job was framed as a separate analysis in a future study, and future research should extend spike-train encoding to include additional tasks.
(i) incorporate multimodal skeletal features (positions + orientations);
(ii) evaluate a 12-class joint exercise–correctness classification pipeline;
(iii) test on larger-scale and more diverse rehabilitation datasets to validate generalization.
(iv) explore integration with transformer or graph-based architectures for hybrid modeling.
(v) investigate real-time implementations in home-based rehabilitation systems.
Taken together, the findings suggest that spike-train encoding provides a promising new avenue for rehabilitation movement recognition, with the potential to complement existing skeleton-based HAR methods and enhance clinical feedback systems.
Conclusions and future work
The main aim of this study was to develop a robust spike train algorithm for physiotherapy assessment using DL approaches. To accomplish the aim, this study addressed three simultaneously achieved objectives. A summary of the objectives and the findings are briefly explained in this section. The initial goal is to create feature extraction algorithms using spike trains for physiotherapy movement recognition and assessment, utilizing spike train analysis to identify spike significance patterns and tuning curves.
-
1.
Each exercise has unique spike significance patterns that can be recognized and assessed by DL architectures.
-
2.
Tuning curves are used to compare movement correctness by calculating MPE and MAD of average firing rates of each exercise for a subject.
Next, the second objective is to determine the most optimum classifier based on the proposed framework for classifying the features with several CNN architectures. This is fulfilled through the validation on three datasets. All the CNN models perform well in recognising the patterns, but the proposed CNN outperformed the others for all the datasets. Lastly, corresponding to objective 3, evaluate and validate the effectiveness of the study proposes a framework for predicting and verifying the correctness of rehabilitation movements using DL approaches and Rehabilitation Movement Classification, resulting in two performance metrics.
-
1.
Firing rates of tuning curves calculation.
-
2.
Correctness metrics predicted by DL, including correctness prediction, precision, recall, and F1-score.
According to the study, there is little variation from correctness metrics when using the suggested framework to evaluate physiotherapy movements at home or in rehabilitation facilities. Two performance measures are produced by the study’s methodology for predicting and confirming the accuracy of rehabilitation movements utilising DL methods and rehabilitation movement classification. In particular, there is a lack of observational studies of any changes in the spatial characteristics of skeleton joints or skeleton angle points that might have occurred in recent decades. Future studies might, for example, look for details on specific lower limb angle measurements of physiotherapy movements the proposed spike-train framework shows promise for clinical decision support, but prospective validation in patient populations is required to establish generalizability and clinical applicability. The studies highlight several areas for further research, urging researchers to expand their investigation in these areas.
-
1.
The research was limited to the research of Kinect-based physiotherapy. However, further investigation should cover other sensory cameras and produce a comparison to understand the issue from different aspects wholly. How accurate of the sensory camera compared to Kinect? Is the proposed framework compatible with another sensory camera? This would help confirm and possibly verify the proposed framework discussed in this study.
-
2.
A decision support system can be suggested for the findings of this research for corrective actions of physiotherapy assessments in DL approaches.
-
3.
Qualitative research can be extended in order to have a comparative study on various motion sensors for physiotherapy assessment.
Data availability
The datasets used and/or analysed during the current study available from the corresponding author on reasonable request.
References
Rashid, F. A. N., Suriani, N. S., & Nazari, A., Kinect-based physiotherapy and assessment: A comprehensive review, Indonesian J. Elect. Eng. Comput. Sci. 11 1176–1187. https://doi.org/10.11591/ijeecs.v11.i3.pp1176-1187(2018).
M. Health Informatics Centre Planning Division, Ministry of Health, Health Facts 2022, Ministry of Health Malaysia 22 1–19 (2022).
Ministry of Health Malaysia, Human resource for health country profiles 2019-2021, 2023.
Abdolrasol, M. G., et al. Fuzzy controller-driven pattern search optimization for a DC–DC boost converter to enhance photovoltaic MPPT performance, Scientific Reports 15(1), 1–21. https://doi.org/10.1038/s41598-025-16255-3 (2025).
Bernini, S. et al. HomeCoRe system for telerehabilitation in individuals at risk of dementia: A usability and user experience study. Front Med. (Lausanne) 10, 1129914. https://doi.org/10.3389/FMED.2023.1129914/BIBTEX (2023).
Kumar, K.V.R. & Elias, S. Deep Learning Based Rehabilitation Monitoring and Assessment System for Cervical Spondylosis, Authorea Preprints. https://doi.org/10.36227/TECHRXIV.23293649.V1 (2023).
Liu, Y. A., Li, Z., & Yu, Y. Rehabilitation Assistance System for Limb Motor Function Based on Deep Learning,. https://doi.org/10.21203/RS.3.RS-2867799/V1 (2023).
Gonçalves, C. et al. Deep learning-based approaches for human motion decoding in smart walkers for rehabilitation. Expert Syst. Appl. 228, 120288. https://doi.org/10.1016/J.ESWA.2023.120288 (2023).
Latif, A., Hussain, S. M. S. & Das, D. C. Optimization of Two-Stage IPD-(1+I) Controllers for Frequency Regulation of Sustainable Energy Based Hybrid Microgrid Network. Electronics 10, 919 (2021).
Abdolrasol, M. G., Ayob, A. & Mutlag, A. H. Optimal fuzzy logic controller based PSO for photovoltaic system. Energy Reports 9, 427–434 (2023).
Roy, B. et al., "Deep Learning Based Relay for Online Fault Detection, Classification, and Fault Location in a Grid-Connected Microgrid," in IEEE Access, 11, 62674-62696 (2023).
Ranjan, S., Das, D. C., Sinha, N., Latif, A. & Hussain, S. S. Voltage stability assessment of isolated hybrid dish-stirling solar thermal-diesel microgrid with STATCOM using mine blast algorithm. Electric. Power Syst. Res. 196, 107239 (2021).
Zhu, M., Chen, W., Hirdes, J. P. & Stolee, P. The K-nearest neighbor algorithm predicted rehabilitation potential better than current Clinical Assessment Protocol. J. Clin. Epidemiol 60, 1015–1021. https://doi.org/10.1016/j.jclinepi.2007.06.001 (2007).
Zhu, M., Zhang, Z., Hirdes, J. P. & Stolee, P. Using machine learning algorithms to guide rehabilitation planning for home care clients. BMC Med. Inform. Decis. Mak. 7, 1–13. https://doi.org/10.1186/1472-6947-7-41/FIGURES/4 (2007).
Muniz, A. M. S. et al. Comparison among probabilistic neural network, support vector machine and logistic regression for evaluating the effect of subthalamic stimulation in Parkinson disease on ground reaction force during gait. J. Biomech. 43, 720–726. https://doi.org/10.1016/j.jbiomech.2009.10.018 (2010).
Suriani, N. S. Fall Detection Using Visual Cortex Bio-inspired Model for Home-Based Physiotherapy System, Lecture Notes in Electrical. Engineering 387, 47–57. https://doi.org/10.1007/978-3-319-32213-1_5 (2016).
Jain, A., Tompson, J., LeCun, Y. & Bregler, C. MoDeep: A Deep Learning Framework Using Motion Features for Human Pose Estimation. Lecture Notes in Comput. Sci. (Including Subseries Lecture Notes in Artificial Intelligence and Lecture Notes in Bioinformatics) 9004, 302–315. https://doi.org/10.1007/978-3-319-16808-1_21 (2014).
Ahmed, N., Gharghan, S.K., Mutlag, A.H. & Abdolrasol, M.G.M. Children Tracking System Based on ZigBee Wireless Network and Neural Network, J. Techniques 5, 103–113. https://doi.org/10.51173/JT.V5I1.838 (2023).
Lau, H. Y., Tong, K. Y., & Zhu, H. Support vector machine for classification of walking conditions of persons after stroke with dropped foot, Hum. Mov. Sci. 28, 504–514. https://doi.org/10.1016/J.HUMOV.2008.12.003 (2009).
De Vries, S. I., Garre, F. G., Engbers, L. H., Hildebrandt, V. H. & Van Buuren, S. Evaluation of neural networks to identify types of activity using accelerometers. Med. Sci. Sports Exerc. 43, 101–107. https://doi.org/10.1249/MSS.0B013E3181E5797D (2011).
Khan, A. M., Lee, Y. K., Lee, S. Y. & Kim, T. S. A triaxial accelerometer-based physical-activity recognition via augmented-signal features and a hierarchical recognizer. IEEE Trans. Inf. Tech. Biomed. 14, 1166–1172. https://doi.org/10.1109/TITB.2010.2051955 (2010).
Lara, Ó. D. & Labrador, M. A. A survey on human activity recognition using wearable sensors. IEEE Commun. Surveys Tutorials 15, 1192–1209. https://doi.org/10.1109/SURV.2012.110112.00192 (2013).
Gyllensten, I. C. & Bonomi, A. G. Identifying types of physical activity with a single accelerometer: Evaluating laboratory-trained algorithms in daily life. IEEE Trans. Biomed. Eng. 58, 2656–2663. https://doi.org/10.1109/TBME.2011.2160723 (2011).
Wang, Z., Jiang, M., Hu, Y. & Li, H. An incremental learning method based on probabilistic neural networks and adjustable fuzzy clustering for human activity recognition by using wearable sensors. IEEE Trans. Inf. Tech. Biomed. 16, 691–699. https://doi.org/10.1109/TITB.2012.2196440 (2012).
Lane, N.D. & Georgiev, P. Can deep learning revolutionize mobile sensing?, HotMobile 2015 - 16th Int. Workshop Mobile Comput. Syst. Appl. 117–122. https://doi.org/10.1145/2699343.2699349;JOURNAL:JOURNAL:ACMCONFERENCES;PAGEGROUP:STRING:PUBLICATION (2015).
Mühlbacher-Karrer, S. et al. A Driver State Detection System - Combining a Capacitive Hand Detection Sensor With Physiological Sensors. IEEE Trans. Instrum. Meas. 66, 624–636. https://doi.org/10.1109/TIM.2016.2640458 (2017).
Alhsnony, F. Auto-Identification of Pectoral Muscle Region in Digital Mammogram Images, Int. J. E-Education, e-Business, e-Manage. e-Learning. https://doi.org/10.7763/IJEEEE.2014.V4.293 (2014).
Rahevar, M., Ganatra, A., Saba, T., Rehman, A. & Bahaj, S. A. Spatial-Temporal Dynamic Graph Attention Network for Skeleton-Based Action Recognition. IEEE Access 11, 21546–21553. https://doi.org/10.1109/ACCESS.2023.3247820 (2023).
Yan, S., Xiong, Y. & Lin, D. Spatial Temporal Graph Convolutional Networks for Skeleton-Based Action Recognition, Proceedings of the AAAI Conference on Artificial Intelligence 32, 7444–7452. https://doi.org/10.1609/AAAI.V32I1.12328 (2018).
Yu, B. X., Liu, Y., Zhang, X., Chen, G., & Chan, K. C. EGCN: An Ensemble-based Learning Framework for Exploring Effective Skeleton-based Rehabilitation Exercise Assessment, IJCAI Int. Joint Conference on Artificial Intelligence 4, 3681–3687. https://doi.org/10.24963/IJCAI.2022/511 (2022).
Zaher, M., Ghoneim, A. S., Abdelhamid, L. & Atia, A. Fusing CNNs and attention-mechanisms to improve real-time indoor Human Activity Recognition for classifying home-based physical rehabilitation exercises. Comput. Biol. Med. 184, 109399. https://doi.org/10.1016/J.COMPBIOMED.2024.109399 (2025).
Zaher, M., Ghoneim, A. S., Abdelhamid, L. & Atia, A. Unlocking the potential of RNN and CNN models for accurate rehabilitation exercise classification on multi-datasets. Multimed. Tools. Appl. 84, 1261–1301. https://doi.org/10.1007/S11042-024-19092-0/FIGURES/7 (2025).
Lueangwitchajaroen, P., Watcharapinchai, S., Tepsan, W. & Sooksatra, S. Multi-level feature fusion in CNN-based human action recognition: A case study on efficientnet-B7. J. Imaging 10, 320. https://doi.org/10.3390/JIMAGING10120320 (2024).
Zhu, Q. & Deng, H. Spatial adaptive graph convolutional network for skeleton-based action recognition. Appl. Intelligence 53, 17796–17808. https://doi.org/10.1007/S10489-022-04442-Y/FIGURES/7 (2023).
Liu, D., et al. Adaptive Attention Memory Graph Convolutional Networks for Skeleton-Based Action Recognition, Sensors 21, 6761. https://doi.org/10.3390/S21206761 (2021).
Yan, S., Xiong,Y. & Lin, D. Spatial Temporal Graph Convolutional Networks for Skeleton-Based Action Recognition, 32nd AAAI Conference on Artificial Intelligence, AAAI 2018, 7444–7452. https://doi.org/10.1609/aaai.v32i1.12328 (2018).
Chan, W., Tian, Z. & Wu, Y. GAS-GCN: Gated Action-Specific Graph Convolutional Networks for Skeleton-Based Action Recognition. Sensors (Basel) 20, 3499. https://doi.org/10.3390/S20123499 (2020).
Yang, H. et al. Multi-scale and attention enhanced graph convolution network for skeleton-based violence action recognition. Front Neurorobot 16, 1091361. https://doi.org/10.3389/FNBOT.2022.1091361/BIBTEX (2022).
Uddin, I. et al. A hybrid residue based sequential encoding mechanism with XGBoost improved ensemble model for identifying 5-hydroxymethylcytosine modifications, Sci. Rep. 14 1–16. https://doi.org/10.1038/S41598-024-71568-Z(2024).
Gerstner, W. & Kistler, W. M. Spiking neuron models: Single neurons, populations, plasticity. Spiking Neuron Models https://doi.org/10.1017/CBO9780511815706 (2002).
Rashid, F. A. N. et al. Deep convolutional network approach in spike train analysis of physiotherapy movements, Lecture notes in electrical. Engineering 619, 159–170. https://doi.org/10.1007/978-981-15-1289-6_15 (2020).
Bawane, P., Gadariye, S., Chaturvedi, S. & Khurshid, A. A. Object and character recognition using spiking neural network. Mater. Today Proc. 5, 360–366. https://doi.org/10.1016/J.MATPR.2017.11.093 (2018).
Rongala, U. B., Mazzoni, A. & Oddo, C. M. Neuromorphic artificial touch for categorization of naturalistic textures. IEEE Trans. Neural. Netw. Learn. Syst. 28, 819–829. https://doi.org/10.1109/TNNLS.2015.2472477 (2017).
Gedamu, K., Ji, Y., Gao, L. L., Yang, Y. & Shen, H. T. Relation-mining self-attention network for skeleton-based human action recognition. Pattern Recognit 139, 109455. https://doi.org/10.1016/J.PATCOG.2023.109455 (2023).
Dai, M., Sun, Z., Wang, T., Feng, J. & Jia, K. Global spatio-temporal synergistic topology learning for skeleton-based action recognition. Pattern Recognit. 140, 109540. https://doi.org/10.1016/J.PATCOG.2023.109540 (2023).
Zhang, X., Jin, F., Hu, J. & Xu, J. “AI-Driven Health Monitoring: Integrating Transformer and Convolutional Fusion for Stroke Patient Posture Estimation,” IEEE J Biomed Health Inform https://doi.org/10.1109/JBHI.2024.3501353(2024).
Leone, A., Rescio, G., Caroppo, A., Siciliano, P., & Manni, A. Human Postures Recognition by Accelerometer Sensor and ML Architecture Integrated in Embedded Platforms: Benchmarking and Performance Evaluation, Sensors 23, 1039. https://doi.org/10.3390/S23021039 (2023).
Berman, J., Lee, I. C., Yin, J. & Huang, H. An efficient framework for personalizing EMG-driven musculoskeletal models based on reinforcement learning. IEEE Trans. Neural Syst. Rehabil. Eng. 32, 4174–4185. https://doi.org/10.1109/TNSRE.2024.3483150 (2024).
Han, F., Reily, B., Hoff, W. & Zhang, H. Space-time representation of people based on 3D skeletal data: A review. Comput. Visi. Image Understan. 158, 85–105. https://doi.org/10.1016/J.CVIU.2017.01.011 (2017).
Detailed Human Data Acquisition of Kitchen Activities: the CMU-Multimodal Activity Database (CMU-MMAC), (n.d.). https://www.cs.cmu.edu/~ftorre/web_page/humansensing.cs.cmu.edu/projects/CMU-MMAC.html accessed August 27, 2025.
Ofli, F., Chaudhry, R., Kurillo, G., Vidal, R., & Bajcsy, R. Berkeley MHAD: A comprehensive Multimodal Human Action Database, Proceedings of IEEE Workshop Appl. Comput. Visi. 53–60. https://doi.org/10.1109/WACV.2013.6474999 (2013).
Yin, H., Sinnott, R. O., & Jayaputera, G. T. A survey of video-based human action recognition in team sports, Artificial Intelligence Rev. 57(11), 1–55. https://doi.org/10.1007/S10462-024-10934-9 (2024).
Chen, C., Jafari, R., & Kehtarnavaz, N. UTD-MHAD: A multimodal dataset for human action recognition utilizing a depth camera and a wearable inertial sensor, Proceedings – Int. Conference on Image Processing, ICIP . 168–172. https://doi.org/10.1109/ICIP.2015.7350781 (2015).
Ar, I. & Akgul, Y. S. A computerized recognition system for the home-based physiotherapy exercises using an RGBD camera. IEEE Trans. Neural Syst. Rehabil. Eng. 22, 1160–1171. https://doi.org/10.1109/TNSRE.2014.2326254 (2014).
Aung, M. S. H. et al. The automatic detection of chronic pain-related expression: Requirements challenges and the multimodal EmoPain dataset. IEEE Trans. Affect. Comput. 7, 435–451. https://doi.org/10.1109/TAFFC.2015.2462830 (2016).
Nishiwaki, G. A., Urabe, Y. & Tanaka, K. EMG analysis of lower extremity muscles in three different squat exercises. J. Japanese Physi. Therapy Associ. 9, 21–26. https://doi.org/10.1298/jjpta.9.21 (2006).
Reiss, A. & Stricker, D. Creating and benchmarking a new dataset for physical activity monitoring, ACM Int. Conference Proceeding Series. https://doi.org/10.1145/2413097.2413148;JOURNAL:JOURNAL:ACMOTHERCONFERENCES;CTYPE:STRING:BOOK (2012).
Vakanski, A., Jun, H. P., Paul, D., & Baker, R. A Data Set of Human Body Movements for Physical Rehabilitation Exercises, Data 3, 2. https://doi.org/10.3390/DATA3010002 (2018).
Leightley, D., Yap, M. H., Coulson, J., Barnouin, Y., & McPhee, J. S. Benchmarking Human Motion Analysis Using Kinect One: an open source dataset, https://doi.org/10.1109/APSIPA.2015.7415438 (2015).
Guralnik, J. M. et al. a short physical performance battery assessing lower extremity function: association with self-reported disability and prediction of mortality and nursing home admission. J. Gerontol. 49, M85–M94. https://doi.org/10.1093/GERONJ/49.2.M85 (1994).
Lin, J. F. S. & Kulic, D. Online segmentation of human motion for automated rehabilitation exercise analysis. IEEE Trans. Neural Syst. Rehabil. Eng. 22, 168–180. https://doi.org/10.1109/TNSRE.2013.2259640 (2014).
Komatireddy, R. Quality and Quantity of Rehabilitation Exercises Delivered By A 3-D Motion Controlled Camera: A Pilot Study, Int. J. Phys. Med. Rehabil. 2. https://doi.org/10.4172/2329-9096.1000214 (2014).
Krizhevsky, A., Sutskever, I. & Hinton, G.E. ImageNet Classification with Deep Convolutional Neural Networks, in: Proceedings of the 25th Int. Conference on Neural Information Processing Syst. 1, 1097–1105. (Curran Associates Inc., USA, 2012).
Szegedy, C. et al. Going Deeper with Convolutions, CoRR abs/1409.4 (2014).
He, K., Zhang, X., Ren, S. & Sun, J. Deep Residual Learning for Image Recognition, CoRR abs/1512.0 (2015).
Garcia-Gonzalez, D., Rivero, D., Fernandez-Blanco, E. & Luaces, M.R. A Public Domain Dataset for Real-Life Human Activity Recognition Using Smartphone Sensors, Sensors 20, 2200. https://doi.org/10.3390/S20082200 (2020).
Topuz, E. K. & Kaya, Y. EO-LGBM-HAR: A novel meta-heuristic hybrid model for human activity recognition. Comput. Biol. Med. 189, 110004. https://doi.org/10.1016/J.COMPBIOMED.2025.110004 (2025).
Liao, Y., Vakanski, A. & Xian, M. A deep learning framework for assessing physical rehabilitation exercises, CoRR abs/1901.1 (2019).
Ustun, T. S., Hussain, S. M. S., Yavuz, L. & Onen, A. Artificial intelligence based intrusion detection system for iec 61850 sampled values under symmetric and asymmetric faults. IEEE Access 9, 56486–56495 (2021).
Ustun, T. S. et al. Machine learning-based intrusion detection for achieving cybersecurity in smart grids using IEC 61850 GOOSE messages. Symmetry 13, 826 (2021).
Abdolrasol, M.G.M. et al. Artificial Neural Networks Based Optimization Techniques: A Review, Electronics 10, 2689. https://doi.org/10.3390/ELECTRONICS10212689 (2021).
Abdolrasol, M.G.M. et al. Artificial Neural Network Based Particle Swarm Optimization for Microgrid Optimal Energy Scheduling, IEEE Trans. Power Electron. 1–1. https://doi.org/10.1109/TPEL.2021.3074964 (2021).
Hannan, M. A. et al. ANN-based binary backtracking search algorithm for VPP optimal scheduling and cost-effective evaluation. IEEE Trans. Ind. Appl. 57, 5603–5613. https://doi.org/10.1109/TIA.2021.3100321 (2021).
Yasuda, M. & Sekimoto, K. Gaussian-discrete restricted Boltzmann machine with sparse-regularized hidden layer. Behaviormetrika 52, 5–23. https://doi.org/10.1007/S41237-024-00230-9/FIGURES/7 (2025).
Hamoudi, Y., Amimeur, H., Aouzellag, D., Abdolrasol, M. G., & Ustun, T. S. Hyperparameter Bayesian Optimization of Gaussian Process Regression Applied in Speed-Sensorless Predictive Torque Control of an Autonomous Wind Energy Conversion System, Energies 16, 4738. https://doi.org/10.3390/EN16124738 (2023).
Decelle, A., & Furtlehner, C. Gaussian-Spherical Restricted Boltzmann Machines, J. Phys. A Math. Theor. 53. https://doi.org/10.1088/1751-8121/ab79f3 (2019).
Maudsley-Barton, S., McPhee, J., Bukowski, A., Leightley, D., & Yap, M. H. A comparative study of the clinical use of motion analysis from kinect skeleton data, in: 2017 IEEE International Conference on Systems, Man, and Cybernetics, SMC. https://doi.org/10.1109/SMC.2017.8123052 (2017).
Acknowledgments
The authors gratefully acknowledge the support from the Faculty of Technology and Science Malaysia (FTSM) at Universiti Kebangsaan Malaysia (UKM) through the GGPM 2023-049 research grant.
Funding
Authors did not receive any funding for this work.
Author information
Authors and Affiliations
Contributions
Author Contributions: Conceptualization, Investigation, Writing – Initial Draft, Writing – Review and editing; F.A.N.R., M.M.D., N.S.S., M.R.S., M.G.M.A., H.A.S., T.S.U.
Corresponding authors
Ethics declarations
Conflicts of interest
The authors declare no competing interests.
Ethical approval and consent statement
This study was conducted in accordance with relevant guidelines and regulations. All methods were carried out following ethical standards and best practices. The study protocol was reviewed and approved by Tun Hussein Onn University of Malaysia, ensuring compliance with ethical research guidelines. All participants in this study were volunteers, and the data collection was conducted in a laboratory setting. Prior to participation, informed consent was obtained from all subjects or their legal guardians. After the data collection and analysis, the algorithm’s validation was conducted by a qualified physiotherapist. Informed consent was also obtained for publishing the image.
Additional information
Publisher’s note
Springer Nature remains neutral with regard to jurisdictional claims in published maps and institutional affiliations.
Rights and permissions
Open Access This article is licensed under a Creative Commons Attribution-NonCommercial-NoDerivatives 4.0 International License, which permits any non-commercial use, sharing, distribution and reproduction in any medium or format, as long as you give appropriate credit to the original author(s) and the source, provide a link to the Creative Commons licence, and indicate if you modified the licensed material. You do not have permission under this licence to share adapted material derived from this article or parts of it. The images or other third party material in this article are included in the article’s Creative Commons licence, unless indicated otherwise in a credit line to the material. If material is not included in the article’s Creative Commons licence and your intended use is not permitted by statutory regulation or exceeds the permitted use, you will need to obtain permission directly from the copyright holder. To view a copy of this licence, visit http://creativecommons.org/licenses/by-nc-nd/4.0/.
About this article

Cite this article
Rashid, F.A.N., Daud, M.M., Suriani, N.S. et al. Spike train analysis in rehabilitation movement classification using deep learning approach. Sci Rep 15, 43193 (2025). https://doi.org/10.1038/s41598-025-25268-x
Received:
Accepted:
Published:
Version of record:
DOI: https://doi.org/10.1038/s41598-025-25268-x
