
Abstract
Malaria remains a major global health concern, particularly in regions with limited healthcare infrastructure. Traditional diagnostic methods such as microscopy, rapid diagnostic tests (RDTs), and polymerase chain reaction (PCR) suffer from scalability, sensitivity, and expertise-related limitations, underscoring the need for automated diagnostic strategies. This study investigates deep learning models for malaria detection from blood smear images. Four convolutional neural networks (CNNs), MobileNetV2, VGG19, InceptionV3, and ResNet18, were empirically evaluated, with ResNet18 achieving the highest F1-score of 96.33%. Building on these results, two advanced hybrid architectures, Xception and Inception-ResNetV2, were fine-tuned on a dataset of 27,090 images from the Kaggle malaria collection, attaining classification accuracies of approximately 98% on validation and test sets. Model robustness was further confirmed using an independent dataset from the Harvard Dataverse containing thick smear images captured under varied staining and imaging conditions, where accuracy remained consistently high (97–98%). To enhance interpretability and clinical trust, three explainable artificial intelligence (XAI) techniques, Gradient-weighted Class Activation Mapping (Grad-CAM), Local Interpretable Model-agnostic Explanations (LIME), and SHapley Additive exPlanations (SHAP), were employed. These complementary methods provide spatial, superpixel, and pixel-level transparency into the models’ decision-making. Furthermore, representative misdiagnosed samples are presented, wherein these visualization techniques reveal morphological and staining artifacts that led to erroneous predictions, clarifying model failure modes and improving transparency. The proposed AI-based diagnostic framework thus demonstrates high accuracy, interpretability, and generalization, representing a scalable solution for malaria detection in resource-limited healthcare settings.
Introduction
Global burden of malaria
Malaria is one of the world’s most persistent and deadly infectious diseases, caused by Plasmodium parasites and primarily transmitted through the bites of infected female Anopheles mosquitoes. Although the disease is preventable and treatable, it continues to pose a major health threat, particularly in tropical and subtropical regions. Among the five Plasmodium species infecting humans, P. falciparum is the most virulent and accounts for the majority of malaria-related fatalities1. In 2022, an estimated 249 million cases of malaria were recorded globally, resulting in approximately 608,000 deaths1. The WHO African Region bore the highest burden, accounting for 94% of malaria-related deaths, with children under five constituting nearly 80% of those deaths1. These statistics underscore the ongoing health crisis in regions where healthcare infrastructure is underdeveloped. The socioeconomic impact of malaria is equally alarming. In endemic regions, the disease reinforces poverty cycles, disrupts education, and places enormous stress on healthcare systems. It is estimated that malaria can reduce gross domestic product (GDP) growth by up to 1.3% annually in highly affected countrie2,3. Although efforts such as insecticide-treated bed nets, indoor residual spraying, and chemoprevention have contributed to control efforts, the disease remains endemic in over 85 countries. Climate variability, population displacement, and urbanization further complicate eradication strategies4,5. The Global malaria risk map for 2025 is indicated in Fig. 1.

Global Malaria Risk Map for 20256. This map illustrates the geographical distribution of malaria transmission risk levels worldwide. Countries and regions are categorized into five risk levels, high (red), seasonal (purple), moderate (orange), low (peach) and no risk (white). Preventive measures, including mosquito bite prevention and chemoprophylaxis, vary by risk level. High-risk areas, predominantly located in Sub-Saharan Africa, parts of South Asia, and Oceania, require strict prevention and treatment strategies. Source: © ECTM and BSTM. Adapted by Olivia Viel (ECTM) and Ula Maniewski (ITM) from World Malaria Reports 2020–2024. Accessed from www.wanda.be.
Malaria in Pakistan and China
Country-specific case trends further illustrate the divergent challenges in malaria control. In Pakistan, the disease remains endemic, with a sharp increase observed following the catastrophic floods of 2022. In 2023, the country reported around 2.73 million confirmed malaria cases, with P. vivax accounting for 64.2% and P. falciparum for 32.1% of infections. The provinces of Sindh and Balochistan were the hardest hit, collectively contributing over 87% of all reported cases1,7. Conversely, China has achieved substantial success in its malaria control efforts. The country was certified malaria-free by the WHO in 20218, following decades of targeted intervention programs. However, the risk of reintroduction persists. In 2023, China reported 2488 imported malaria cases, primarily due to P. falciparum, with the highest concentrations in Yunnan, Henan, and Guangxi provinces8,9. These contrasting scenarios highlight the importance of both sustained prevention and robust surveillance systems.
Conventional diagnosis and its limitations
Malaria’s clinical manifestation begins after an infected mosquito injects sporozoites into the human bloodstream. These parasites travel to the liver, undergo asexual reproduction, and later invade red blood cells, leading to symptoms such as fever, chills, and anemia10. Severe cases, particularly from P. falciparum, can result in cerebral malaria, multi-organ failure, or death11. Traditionally, three diagnostic modalities are employed: microscopy, rapid diagnostic tests (RDTs), and molecular methods. Microscopy using Giemsa-stained thick and thin blood smears remains the gold standard, enabling both parasite quantification and species identification. However, its accuracy depends on the expertise of the microscopist and is unsuitable for high-throughput screening in resource-constrained areas12. RDTs offer a faster alternative by detecting antigens like HRP2 and pLDH, though they are limited by their inability to distinguish parasite species and their reduced sensitivity at low parasitemia levels12. Moreover, HRP2 gene deletions in some P. falciparum strains lead to false negatives13. Polymerase chain reaction (PCR)-based assays offer high sensitivity and specificity but are costly, time-consuming, and require specialized infrastructure, making them impractical for widespread field deployment14. These challenges create a need for automated, scalable, and accurate diagnostic solutions. The life cycle of the plasmodium parasite in humans and mosquitoes is revealed in Fig. 2.

Life cycle of the plasmodium parasite in humans and mosquitoes. The cycle begins when an infected female Anopheles mosquito injects sporozoites into the human bloodstream (1). These travel to the liver, where they mature into schizonts during the liver stage (2). Schizonts rupture, releasing merozoites into the bloodstream to initiate the blood stage (3), where they invade red blood cells and multiply. Some parasites develop into gametocytes, which are taken up by another mosquito during a subsequent bite (4). Inside the mosquito, the gametocytes mature, completing the sexual reproduction phase (5), thereby enabling transmission to another human host.
Emergence of AI-based diagnostic systems
The limitations of conventional malaria diagnostics have catalyzed interest in artificial intelligence (AI)–driven solutions, particularly those based on deep learning15,16. In malaria detection, CNNs trained on stained blood smear images can classify parasitized and uninfected cells with high accuracy. For example, Rajaraman et al.18 used pre-trained architectures such as ResNet and DenseNet on the NIH malaria dataset and achieved classification accuracies ranging from 95 to 97%. Similarly, mobile-friendly implementations like those by Yang et al.19,20 have demonstrated real-time detection capabilities suitable for remote settings. Furthermore, the integration of explainable AI (XAI) techniques such as Grad-CAM, SHAP, and LIME has enhanced model transparency, enabling clinicians to visualize the rationale behind automated predictions20. These innovations pave the way for AI-assisted diagnostic pipelines that are not only accurate but also interpretable and scalable, thereby addressing the diagnostic challenges faced by healthcare systems in both endemic and post-elimination regions.
The remainder of this paper is organized as follows. “Literature review” reviews related studies on deep learning-based malaria detection and the application of explainable artificial intelligence (XAI) in medical imaging. “Dataset and experimental environment” describes the datasets and experimental environment, including image distributions and hyperparameter configurations. “Methodology” presents the proposed methodology, covering preprocessing, baseline CNN models, and hybrid architectures. “Results” reports the experimental results on both the Kaggle dataset and the external Harvard Dataverse validation. “Explainable AI (XAI) methods” demonstrates the interpretability analysis using Grad-CAM, LIME, and SHAP, and includes the visualization of misdiagnosed cases. “Discussion” discusses the overall findings, potential limitations, and clinical implications of the proposed framework. Finally, “Conclusion” concludes the paper with a summary of contributions and directions for future research.
Literature review
Application of deep learning in malaria detection
Recent advances in deep learning (DL), particularly convolutional neural networks (CNNs), have driven significant progress in automated malaria detection from blood smear images. This literature review summarizes and critically analyzes major contributions in the domain, highlighting datasets used, methodological approaches, key performance metrics, and associated pros and cons.
One notable study by Rahman et al.22 introduced a large and high-variation malaria classification dataset consisting of 63,645 red blood cell images, derived by transforming an object detection dataset into a classification task. The authors evaluated several pre-trained deep neural network architectures including ResNet, DenseNet, and VGG, and examined their performance on both natural and medical image pretraining schemes. They further incorporated adversarial training and synthetic image generation to address class imbalance. Their experiments yielded classification accuracies exceeding 95%, demonstrating the robustness of their dataset and methodology. A key strength of this study is its extensive benchmarking and use of an independent test set. However, the authors noted that overfitting remained an issue for certain models not pretrained on domain-specific data.
In another investigation, Alnussairi and Ibrahim22 explored malaria parasite detection using three pre-trained CNN architectures: VGG19, ResNet50, and MobileNetV2. They employed transfer learning to overcome the limitations of small datasets and evaluated their models using the widely adopted NIH Malaria Dataset, which contains 27,558 images of parasitized and uninfected cells. Their best-performing models achieved near-perfect classification accuracy, approaching 98%. The study highlighted the efficacy of lightweight architectures such as MobileNetV2 for real-world deployment. Nevertheless, the authors did not assess the risk of overfitting or consider hardware limitations in mobile deployments.
Das et al.24 proposed a machine learning-based system for malaria detection using light microscopic images collected from Midnapur Medical College, India. The methodology included preprocessing steps such as illumination correction and segmentation using marker-controlled watershed transformation. A total of 96 morphological and textural features were extracted from red blood cells, and classifiers such as Bayesian networks and Support Vector Machines (SVM) were evaluated. The Bayesian model achieved an accuracy of 84%, while SVM obtained 83.5%. This study stands out for its focus on interpretable features and stage-wise classification, although the reliance on handcrafted features and the absence of deep learning frameworks limit its adaptability.
Yang et al.19 developed a smartphone-compatible malaria detection system using deep learning applied to thick blood smear images. Their proposed method involved an initial screening phase using Iterative Global Minimum Screening (IGMS) followed by classification using a custom CNN. The dataset consisted of 1,819 thick smear images from 150 patients. Their model achieved 93.46% accuracy, with an AUC of 98.39%, precision of 94.25%, and specificity of 94.33%. The lightweight nature of their model and its capability for real-time deployment on mobile devices are notable advantages. However, the approach was not validated on thin smear images, which are commonly used in clinical species differentiation.
Fuhad et al.20 proposed a highly efficient CNN-based framework incorporating knowledge distillation and autoencoders to reduce computational complexity while maintaining high accuracy. Using the NIH Malaria Dataset (with corrected labels), they developed models capable of running inference in less than one second on mobile devices and achieved a classification accuracy of 99.23% with only 4600 floating point operations (FLOPs). They also explored hybrid classification using CNN features fed into SVM and KNN classifiers. This work excels in mobile applicability and computational efficiency but lacks a comprehensive evaluation against other real-time frameworks.
Telang and Sonawane24 presented a multi-faceted approach using the Bins Algorithm for feature extraction, alongside CNN and classical classifiers such as SVM, Random Forest, and KNN. Their dataset, a subset of the NIH/LHNCBC database, was processed using techniques like GLCM for texture and color moment analysis. The Bins + CNN hybrid method achieved the highest classification performance across multiple metrics. While the integration of handcrafted and deep features is innovative, the dataset used was limited in size, and no external validation was conducted.
Suriya et al.26 enhanced a deep CNN architecture by focusing on hyperparameter optimization. Their model was trained on a dataset resembling the NIH collection and was evaluated using different optimizers (Adam and Adagrad). The final model achieved an accuracy of 98.9%, with high scores in the Kappa and Matthews correlation coefficients. Although the study demonstrated the impact of training settings on model performance, it emphasized tuning over architectural innovation and lacked external benchmark comparisons.
Chima et al.27 explored pre-trained CNNs, particularly ResNet50, for feature extraction and classification of malaria-infected blood cells. The study relied on the NIH Dataset and demonstrated promising classification results. Though exact performance metrics were not numerically detailed, the approach showed high promise in feature extraction and educational utility. However, the study did not extensively evaluate alternative architectures or implementation on resource-constrained devices.
Vijayalakshmi and Kanna27 introduced a hybrid architecture combining VGG19 with SVM for detecting falciparum malaria. The study used a custom dataset generated from digitized blood smear slides and employed a transfer learning strategy wherein initial VGG layers were retained, and final classification was conducted using SVM. This hybrid method achieved an accuracy of 93.1%. While the fusion of deep and classical methods improved performance, the system complexity and potential latency issues in real-time applications remain concerns.
Masud et al.29 focused on developing a mobile application for real-time malaria detection. They proposed a custom CNN trained using cyclical stochastic gradient descent and evaluated it on public datasets. Their model achieved a classification accuracy of 97.3% and was optimized for mobile deployment with minimal computational overhead. This study offers a practical solution to diagnostic challenges in remote areas but does not support parasite stage identification, which is crucial for comprehensive diagnosis. The comparative summary of deep learning-Based approaches for malaria parasite detection is indicated in Table 1.
Explainable AI applications in malaria detection
The rise of explainable artificial intelligence (XAI) in healthcare has opened up new avenues for making deep learning models not only accurate but also interpretable. In the context of malaria detection, several recent studies have integrated XAI techniques with CNN architectures to improve trust and transparency in clinical decision-making.
Ahamed et al.30 proposed three advanced CNN architectures Parallel CNN (PCNN), Soft Attention PCNN (SPCNN), and Soft Attention Functional Block PCNN (SFPCNN) for malaria detection. The study utilized blood smear images and integrated Grad-CAM and SHAP visualizations to highlight image regions critical to the model’s decision. SPCNN emerged as the best-performing model, achieving a 99.37% accuracy and an AUC of 99.95%. The model was more computationally efficient compared to SFPCNN and showed better interpretability than traditional CNNs. However, the complexity of SPCNN could pose challenges in deployment on resource-constrained devices. Ramakrishnan et al.31 developed an ensemble transfer learning framework using six pre-trained models (VGG16, VGG19, MobileNetV2, Xception, InceptionV3, and a custom CNN) combined through majority voting. The study not only achieved high accuracy in binary classification but also classified malaria stages ring, trophozoite, schizont effectively. Grad-CAM was used for model interpretation, highlighting which image regions influenced classification. This method improved classification robustness in unbalanced datasets but involved high computational cost due to model ensembling.
Goni and Mondal31 introduced a lightweight CNN model with only 0.17 million parameters optimized for mobile and embedded systems. Using the NIH Malaria Dataset, the model achieved an accuracy of 99.45%, precision of 99.75%, and recall of 99.17%. The authors applied SHAP to interpret feature relevance, demonstrating strong alignment between SHAP outputs and parasite-infected regions. This model excels in low-resource settings, though it does not differentiate malaria stages or species.
Raihan and Nahid32 proposed a hybrid malaria detection framework integrating Wavelet Packet 2D, CNN, and Whale Optimization Algorithm (WOA) for feature selection. After extracting a comprehensive feature set, they used XGBoost for classification, achieving an accuracy of 94.78%. SHAP was employed to interpret feature importance, confirming the model’s alignment with domain-relevant features. Although the approach enhances feature-level explainability, the reliance on handcrafted feature selection may hinder scalability.
Awe et al.34 implemented multiple ensemble models (Random Forest, AdaBoost, XGBoost, CatBoost) trained on a dataset from Nigeria’s Federal Polytechnic Ilaro Medical Centre. They incorporated LIME, SHAP, and Permutation Feature Importance (PFI) for explainability. Random Forest achieved the best ROC AUC of 0.869. This study stands out for using clinical data rather than images and emphasizes model interpretability over classification depth. The ensemble methods improved performance but introduced model complexity.
Grignaffini et al.35 conducted a systematic review of 135 studies covering AI-based malaria diagnosis pipelines. They categorized AI models by architecture type, pre-processing, feature extraction, classification, and XAI methods. Among the reviewed works, Grad-CAM and SHAP were the most commonly used tools. The review emphasized the importance of transparency, standard datasets, and validation techniques, calling for more consistent integration of XAI in clinical-grade systems. The summary of recent studies on explainable AI techniques in malaria detection are mentioned in Table 2.
Recent advances in ML-driven healthcare diagnostics highlight both the potential of deep learning and the necessity of explainability for clinical trust. For instance, Goswami et al.36 developed a deep neural network integrated with explainable AI for sickle cell disease detection, emphasizing transparency in hematological applications. In neuroimaging, Goenka et al.37 proposed a regularized volumetric ConvNet for Alzheimer’s detection from T1-weighted MRI images, addressing overfitting challenges while achieving high sensitivity. Similarly, Dsilva et al.38 applied wavelet scattering and object detection for automated identification of dengue parasites in peripheral blood smear images, demonstrating how hybrid deep learning methods can enhance infectious disease diagnostics. Extending beyond these, Hassan et al.39 introduced an optimized ensemble framework that combines transfer learning with Grey Wolf Optimization for robust breast cancer diagnosis, while Hassan et al.40 applied CNN-based models for the early detection of black fungus infections. In parallel, Hassan et al.41 presented a WaveNet–CNN-BiLSTM hybrid with interpretability features for dysarthria detection in cerebral palsy and ALS patients, underscoring the role of explainability in neurological and speech disorder analysis. Collectively, these contributions demonstrate how deep learning, hybrid architectures, and optimization techniques are reshaping biomedical diagnostics across diverse domains, while reinforcing the novelty of our malaria-focused framework that uniquely integrates explainability within its design. Recent literature demonstrates a growing emphasis on the interpretability of deep learning systems in biomedical diagnostics. Techniques such as Grad-CAM and LIME have proven effective in revealing spatial attention and local feature dependencies; however, these approaches alone often lack pixel-level precision in quantifying individual feature contributions. Motivated by this gap, we additionally integrate SHAP into our study, providing a more granular, theoretically grounded interpretation of model decisions through the computation of per-pixel contribution scores. This tri-modal integration, combining Grad-CAM, LIME, and SHAP, offers a comprehensive view of how deep networks process complex cellular patterns in malaria blood smear images, thereby strengthening the interpretability and clinical reliability of the proposed diagnostic framework.
Comparative discussion, research gaps and contribution of the current study
Despite the progress in malaria detection through deep learning and explainable AI (XAI), prior studies often faced limitations such as restricted model generalizability, lack of parasite stage classification, absence of tri-explanation strategies, and inefficiencies in model interpretability on real-world data. For example, while studies like those by Fuhad et al.20 and Goni and Mondal31 prioritized mobile efficiency and lightweight architectures, they did not explore species-level granularity or use multiple interpretability methods. Others, such as Ramakrishnan et al.31, achieved high classification and stage-level accuracy, but incurred significant computational cost and lacked superpixel-based validation. In contrast, the present study makes several distinct contributions to the field:
-
1.
High-performance classification models: This study leverages Xception and Inception-ResNet V2 two advanced transfer learning models finely tuned on a 27,090 image dataset of parasitized and uninfected red blood cells. Both models consistently achieved test accuracies above 98%, outperforming previous MobileNetV2, VGG19, and InceptionV3 baselines documented earlier in this project.
-
2.
Tri-model XAI integration: Unlike most prior works that rely on a single explanation method, this study integrates Grad-CAM, LIME, and SHAP to provide complementary insights at different interpretability scales. Grad-CAM captures convolutional attention and spatial saliency; LIME reveals localized superpixel perturbations; and SHAP quantifies pixel-wise contribution scores. Together, these three techniques yield a multi-layered understanding of the model’s decision process, facilitating transparency, clinical trust, and precise error analysis.
-
3.
Post-hoc misdiagnosis interpretation: A novel addition of this study is the systematic interpretability analysis of misclassified samples using all three XAI methods. By examining false-positive and false-negative cases, the framework reveals that model errors often stem from cytoplasmic staining artifacts, illumination noise, or boundary irregularities that visually mimic parasitic structures. This multi-scale error analysis not only identifies the root causes of misclassification but also highlights the robustness and diagnostic awareness of the proposed system, an aspect rarely addressed in prior literature.
-
4.
Consistent evaluation pipeline: Comprehensive evaluation metrics ROC curves, precision-recall analysis, confusion matrices, and PCA/t-SNE plots provide robust validation and clear visualization of feature separability, which most prior works lacked.
-
5.
Fine-tuning strategy: This study introduces a two-phase training procedure: initial top-layer training followed by fine-tuning of the last 20 layers with a lowered learning rate. This strategy helped the models adapt better to the malaria domain, a refinement rarely discussed in previous literature.
-
6.
Stable accuracy across batches: With accuracy distributions consistently approaching 0.99 across multiple data batches, the study proves its architecture’s reliability even with minor image variations, often a limitation in CNN-based classifiers trained on imbalanced dataset.
The novelty of this work lies in its synthesis of methodological rigor and real-world relevance. Unlike earlier studies that depended on single-model architectures or limited interpretability tools, our framework (i) systematically benchmarks four baseline CNNs before optimizing hybrid architectures (Xception and Inception-ResNet V2); (ii) introduces tri-modal explainability through Grad-CAM, LIME, and SHAP for multi-scale transparency; and (iii) extends interpretability to include quantitative and qualitative analysis of misdiagnosed cases; and iv) validates generalizability through external testing on the Harvard Dataverse dataset. Collectively, these contributions establish a robust, interpretable, and clinically transferable AI pipeline for malaria diagnosis, capable of balancing high performance with explainability in resource-limited healthcare environments.
Dataset and experimental environment
Dataset description
The experiments were conducted on the publicly available Cell Images for Malaria Detection dataset from Kaggle, which contains a total of 27,090 red blood cell images categorized into two classes: Parasitized (13,790 images) and Uninfected (13,300 images). Each image was captured using light microscopy at a resolution of 150 × 150 pixels. To ensure reliable performance assessment, the dataset was partitioned into 70% training (18,963 images), 15% validation (4063 images), and 15% testing (4064 images), with stratification to preserve class balance across splits. Specifically, the training set comprised 9653 Parasitized and 9310 Uninfected images; the validation set contained 2069 Parasitized and 1,994 Uninfected images; and the test set included 2068 Parasitized and 1996 Uninfected images. This stratified distribution ensured that class balance was maintained across all subsets, minimizing potential bias during training and evaluation.
Although the dataset is relatively balanced, the slight difference between the two classes was taken into account during evaluation. The dataset was collected from a single laboratory source under consistent staining conditions, which ensures uniformity but may limit diversity in terms of imaging devices, staining protocols, and inter-laboratory variations. This constraint has been acknowledged as a potential limitation with respect to generalizability. Nevertheless, this dataset provided the primary benchmark for training, validating, and testing the proposed models. The dataset is well annotated and widely recognized for its clinical relevance, making it an ideal resource for training and evaluating deep learning models in medical imaging. Images were captured using light microscopy at a consistent 100× magnification, maintaining a resolution of 150 × 150 pixels.
Environment setup and data extraction
The experiments were conducted on Google Colab. The dataset was stored in a ZIP file on Google Drive and was subsequently extracted into a designated directory for processing. A variety of libraries were imported to support tasks such as file handling, numerical computation, image processing, and deep learning. A fixed seed (42) was used across all libraries to ensure reproducibility. Although the runtime did not have GPUs available, the system was configured to utilize a high-RAM TPU (V2-8), which provided the necessary computational power for training. For training, all images were resized to 224 × 224 pixels and processed in batches of 32. Models were trained using the Adam optimizer with binary cross-entropy loss. A two-phase fine-tuning strategy was adopted:
-
(i)
initial training of the top classification layers for 20 epochs at a learning rate of 1e−3 with the backbone frozen;
-
(ii)
fine-tuning of the last 20 layers of the backbone for 10 epochs at a reduced learning rate of 1e−5.
A ReduceLROnPlateau scheduler was applied (factor = 0.1, patience = 2, min_lr = 1e-7) to adaptively reduce learning rate. The classification head included GlobalAveragePooling → Dense (1024, ReLU) → Dropout (0.5) → Dense (1, Sigmoid). A fixed seed (42) ensured reproducibility.
Methodology
Preprocessing
The dataset was organized by dynamically listing the subdirectories representing the two classes. These images were then preprocessed uniformly by reading and decoding each PNG file, resizing it to 224 × 224 pixels, and normalizing the pixel intensities to the [0, 1] range. To optimize performance during training, the data set was prepared by shuffling with a fixed seed, repeating indefinitely, and batching (batch size 32) to ensure all samples were processed during each epoch. The validation and test sets were similarly batched without additional shuffling.
For unbiased training and robust evaluation, the dataset was divided into three subsets:
-
Training set: 70% (18,963 images).
-
Validation set: 15% (4063 images).
-
Test set: 15% (4064 images).

Sample images from the malaria blood smear dataset.
Methodologies used for detecting malaria parasite from blood smear images
To evaluate baseline performance in malaria parasite classification, we implemented and fine-tuned four established CNN architectures: MobileNetV2, VGG19, InceptionV3, and ResNet18, each offering unique trade-offs in accuracy, complexity, and computational efficiency.
MobileNetV2 is a lightweight model optimized for mobile deployment. It uses depthwise separable convolutions and inverted residual blocks, allowing high accuracy with minimal computational overhead ideal for real-time diagnostic settings.
VGG19, a deeper network with uniform 3 × 3 convolutional layers and fully connected classifiers, excels in feature extraction but requires significant computational resources. It has shown consistent performance across various medical image classification tasks.
InceptionV3 employs multi-scale Inception modules, asymmetric convolutions, and auxiliary classifiers, enabling efficient feature representation and gradient flow in deep networks. It balances accuracy and resource efficiency well, particularly on complex input patterns. ResNet18 leverages residual connections to facilitate deeper model training without degradation. Despite its lower depth, it performed reliably in detecting parasitized cells, offering a balance between inference speed and classification robustness.
Based on insights from this empirical evaluation, we extended our study by employing two advanced hybrid architectures Xception and Inception-ResNetV2 which combine the strengths of depthwise separable convolutions and residual learning. These models were selected to achieve enhanced accuracy, better generalization, and interpretable predictions in malaria detection tasks, as discussed in the following sections.
Advance hybrid architecture
Xception-based model
The Xception architecture was loaded with pre-trained ImageNet weights, excluding its top classification layers, and configured for an input size of 224 × 224 × 3. Initially, all layers of the Xception base were frozen to retain the robust feature extraction capabilities. A custom classifier was then appended, comprising:
-
A GlobalAveragePooling2D layer to condense spatial information.
-
A Dense layer with 1024 units and ReLU activation for learning high-level representations.
-
A Dropout layer (0.5 dropout rate) to mitigate overfitting.
-
A final Dense layer with a sigmoid activation to produce a binary prediction.
This final model (“Xception_Transfer”) consisted of approximately 22.96 million parameters, with around 2.10 million parameters trainable.
The workflow of the proposed malaria detection framework from data preprocessing to model training and classification is illustrated in Fig. 4.

Workflow of the proposed malaria detection framework. The pipeline begins with input blood smear images, which undergo preprocessing steps including resizing, normalization, and augmentation, followed by stratified splitting into training and test subsets. In the training stage, two advanced hybrid CNN architectures Xception and Inception-ResNetV2 are fine-tuned using a two-phase strategy. The trained models are then evaluated on unseen test data, performing binary classification of red blood cells into Parasitized or Uninfected.
Inception-ResNet V2-based model
In parallel, the Inception-ResNet V2 model was also employed due to its exceptional performance in image classification tasks. This model was similarly loaded with pre-trained ImageNet weights (excluding its top layers) and set for an input size of 224 × 224 × 3. Like the Xception model, the Inception-ResNet V2 base layers were initially frozen. A new classifier was built on top that included a GlobalAveragePooling2D layer, a Dense layer with 1024 units and ReLU activation, a Dropout layer to reduce overfitting, and a final sigmoid-activated Dense layer for binary classification. The resulting model, referred to as “InceptionResNetV2_Transfer,” comprised approximately 55.9 million parameters, of which only about 1.57 million were trainable. This configuration leverages the powerful feature extraction capabilities of Inception-ResNet V2 while allowing the classifier layers to adapt to the malaria detection task.
Training procedure for both models
The training process was divided into two distinct phases for both models:
Step 1: Training Only the Top Layers.
Initially, the custom classifier layers were trained while keeping the base model layers frozen. The models were compiled using the Adam optimizer (learning rate of 1e-3), binary cross entropy loss, and accuracy as the performance metric. Training was conducted for 20 epochs with 592 steps per epoch for the training set and 126 steps per epoch for the validation set. Custom callbacks monitored training and test performance, while a learning rate scheduler (ReduceLROnPlateau) gradually reduced the learning rate as needed. Both models demonstrated steady improvements, with training and validation accuracies increasing over epochs and test performance reaching approximately 97% by the end of this phase.
Step 2: Fine-Tuning the Models.
In the fine-tuning phase, the last 20 layers of the base model (for both Xception and Inception-ResNet V2) were unfrozen, allowing these layers to update during training. The models were recompiled with a lower learning rate (1e−5) to enable more delicate weight adjustments. Training continued for an additional 10 epochs using the same data pipeline and evaluation callbacks. Fine-tuning further enhanced performance, with training, validation, and test accuracies all increasing and stabilizing at even higher levels. The gradual reduction of the learning rate during this phase facilitated precise tuning of the models’ higher-level representations.
Results
Evaluation metrics
To assess the performance of deep learning models for malaria parasite classification, several well-established evaluation metrics were employed. These include accuracy, precision, recall, F1-score, and AUC-ROC. Additionally, confusion matrix analysis was used to interpret classification results visually and quantitatively.
Accuracy is the most intuitive metric, representing the proportion of correctly classified samples to the total number of predictions. It is defined as:
where:
-
TP = True Positives.
-
TN = True Negatives.
-
FP = False Positives.
-
FN = False Negatives.
Precision
Precision measures the ratio of correctly predicted positive observations to the total predicted positives. It evaluates the model’s ability to avoid false positives:
High precision indicates a low false positive rate, which is crucial in medical applications where misdiagnosing healthy individuals as infected must be minimized.
Recall (sensitivity)
Recall, or sensitivity, measures the ratio of correctly predicted positive observations to all actual positives. It emphasizes the model’s ability to detect true cases:
High recall is critical in disease detection tasks to minimize false negatives, which could result in missed diagnoses.
F1-score
The F1-score is the harmonic mean of precision and recall. It balances the trade-off between these two metrics, particularly in imbalanced datasets:
A perfect F1-score of 1 indicates a model with both high precision and recall.
ROC curve
The Receiver Operating Characteristic (ROC) curve plots the True Positive Rate (TPR) against the False Positive Rate (FPR) at various threshold settings:
Classification report of baseline CNN architectures
In the initial phase of this study, we implemented and evaluated several standard CNN architectures to establish a baseline for malaria parasite classification using blood smear images. The empirical results demonstrated promising classification performance. Among the models tested, ResNet18 achieved the highest F1-score of 96.33%, followed by InceptionV3 (95.21%), VGG19 (94.76%), and MobileNetV2 (92.5%) indicated in Table 3.
While these models showed strong individual performance, further improvement was sought by leveraging the strengths of deeper, more advanced architectures. Therefore, based on these results, we explored hybrid models Xception and Inception-ResNetV2 to enhance detection accuracy and generalization capability, especially under varying image conditions and class distributions.
Evaluation on validation and test sets
A comprehensive evaluation was performed using multiple performance metrics and visualizations to assess the generalization and reliability of both models.
Classification reports
For both the validation and test sets, the models achieved very high precision, recall, and F1-scores (around 0.98) for both the “Parasitized” and “Uninfected” classes. Overall accuracies were approximately 98% for both architectures. This indicates that regardless of the underlying base architecture whether Xception or Inception-ResNet V2, each model is highly effective at distinguishing between the two diagnostic classes indicated in Table 4.
Confusion matrices
The confusion matrices for both models reveal that the vast majority of images were correctly classified. Figure 5 shows the confusion Matrix for Xception and Inception-Resnet V2 Model. In both cases, the off-diagonal elements (indicating misclassifications) are minimal. For instance, in the validation set, only a small number of parasitized images were incorrectly classified as uninfected and vice versa. Such results underscore the robustness of both models in practical diagnostic scenarios.

Confusion matrices for validation and test sets using Xception (left) and Inception-ResNetV2 (right) models.
ROC and precision-recall curves
Both the Receiver Operating Characteristic (ROC) curves and Precision-Recall curves exhibited near-perfect shapes, with an Area Under the Curve (AUC) of 1.00 for both metrics. Figure 6 shows the validation ROC Curve for Xception and Inception Resnet V2 Model. This indicates that both models maintained high sensitivity and specificity across various threshold settings. Figure 7 shows the validation Precision-Recall Curve for Xception Based and Inception Resnet V2 Model. The almost ideal ROC and precision-recall curves suggest that both models are equally adept at minimizing false positives and false negatives, which is critical in medical diagnostics41. Figure 8 shows Test ROC Curve for Xception and Inception-Resnet V2 Model and Fig. 9 shows Test ROC Curve for Xception and Inception Resnet V2 Model.

Validation ROC curve for Xception and Inception-Resnet V2 model.

Validation precision-recall curve for Xception and Inception-Resnet V2 model.

Test ROC curve for Xception and Inception-Resnet V2 model.

Test ROC curve for Xception based model and Inception-Resnet V2 model.
Batch accuracy distribution
Box plots displaying per-batch accuracies for both models showed that the median accuracy consistently approached 0.99 with minimal variability across batches. Figure 10 shows the validation batch accuracy for Xception and Inception-Resnet V2 Model. Figure 11 shows the test batch accuracy for Xception and Inception-Resnet V2 Model. Although a few outlier batches (with accuracies around 0.92–0.94) were observed, these were rare and likely attributable to challenging or a typical image. Overall, the high consistency in batch accuracy demonstrates that both models deliver stable performance across different subsets of the data.

Validation batch accuracy for Xception based model and Inception Resnet V2 model.
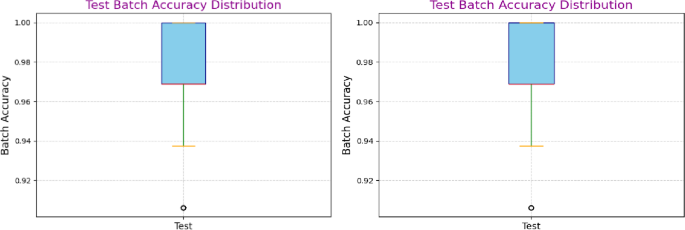
Test batch accuracy for Xception based model and Inception Resnet V2 model.
Feature visualization via dimensionality reduction
High-dimensional features were extracted from the penultimate Dense (1024) layer of each model and subsequently reduced to two dimensions using Principal Component Analysis (PCA) and t-Distributed Stochastic Neighbor Embedding (t-SNE). These visualizations help validate the discriminative power of the learned feature representations.
PCA plots
The PCA plots for both models shown in Fig. 12 revealed clear, linearly separable clusters corresponding to the two classes. In the PCA projection, images of “Parasitized” samples clustered distinctly from those of “Uninfected” samples. This linear separability indicates that the features extracted by both the Xception-based and the Inception-ResNet V2–based models are highly discriminative. Notably, despite the architectural differences, both models showed similar clustering patterns, suggesting that each model is effectively capturing the key differences in the image data.

Principal Component Analysis (PCA) Visualization of Validation Features for Xception-Based Model (Left) and Inception-ResNetV2 Model (Right). The plots illustrate the separability of parasitized (red) and uninfected (blue) classes in the feature space extracted by the two models. Clear clustering along the principal components confirms effective feature learning, with both models achieving strong class distinction and minimal overlap, supporting their high classification performance.
t-SNE
The t-SNE visualizations shown in Fig. 13 provided a more nuanced, non-linear perspective on the high-dimensional feature space. In both cases, t-SNE revealed well-defined clusters with a clear boundary between parasitized and uninfected samples. The non-linear embedding further confirms that the models’ learned representations preserve local neighborhood relationships and are organized in a manner that enhances class separability. While both models yielded similar clustering, slight differences in the density and spread of the clusters may reflect subtle variations in how each architecture encodes the features, potentially offering insights into the model-specific characteristics that contribute to their classification performance.

t-SNE Visualization of Validation Features for Xception-Based Model (Left) and Inception-ResNetV2 Model (Right). The figure demonstrates class-wise distribution using t-distributed Stochastic Neighbor Embedding (t-SNE). Distinct clusters for parasitized (red) and uninfected (blue) samples reflect the models’ ability to learn discriminative features. The Inception-ResNetV2 model shows slightly better separation, indicating more robust feature representation.
External validation on Harvard dataverse dataset
To further examine the robustness and generalizability of our proposed framework, we conducted experiments on an independent dataset obtained from the Harvard Dataverse repository42 shown in Fig. 14. Unlike the Kaggle dataset of thin blood smears, this dataset contains 2, 210 microscopy images, categorized into two classes: 1139 Thick_Infected and 1071 Thick_Uninfected 1071. This dataset provides a clinically diverse benchmark with variations in staining, image resolution, and acquisition conditions.

Representative sample images from the Harvard Dataverse thick smear dataset. The top row shows examples of Thick_Infected blood smear images, while the bottom row shows examples of Thick_Uninfected images. The dataset exhibits notable variation in staining intensity, cell morphology, and image quality, providing a diverse benchmark for evaluating the robustness of the proposed models.
Validation results
The classification report on the validation set (331 images) shows that both classes were identified with high precision and recall, yielding an overall validation accuracy of 98% with a macro-average F1-score of 0.98. The confusion matrix in Fig. 15a indicates that out of 331 validation samples, only 6 images were misclassified (1 Thick_Infected misclassified as uninfected, and 5 Thick_Uninfected misclassified as infected). This demonstrates that the model maintains strong discriminative capability even under variable imaging conditions.

Confusion matrices for the Harvard Dataverse dataset: (a) validation set (331 images) and (b) test set (332 images). The matrices demonstrate high classification performance, with only a small number of misclassifications in both sets, confirming the model’s strong discriminative ability across diverse imaging conditions.
To highlight the performance of our proposed methodology, Table 5 summarizes the validation and test accuracies of the Xception and Inception-ResNetV2 models across the Kaggle and Harvard Dataverse datasets. Both models achieved consistently high accuracies, ranging from 97.5% to 97.8%, with only marginal variation between datasets. These results confirm the robustness and generalizability of our framework under different imaging conditions.
Test results
On the independent test set (332 images), the model achieved a classification accuracy of 97%, with balanced performance across both classes. The confusion matrix Fig. 15b further validates this performance, with only 9 misclassifications out of 332 images (5 Thick_Infected → misclassified as uninfected; 4 Thick_Uninfected → misclassified as infected). The near-equal precision (0.97), recall (0.97–0.98), and F1-scores (0.97) highlight the consistency of the proposed pipeline when applied to a dataset markedly different from the training domain.
Discussion of external validation
The results confirm that the proposed methodology, combining transfer learning with two-phase fine-tuning generalizes effectively across different malaria datasets. The minimal drop in accuracy from ~ 98% (Kaggle dataset) to ~ 97–98% (Harvard Dataverse dataset) highlights the stability and reliability of the models under diverse imaging conditions. Importantly, the confusion matrices reveal that the misclassifications were balanced between the two classes, further indicating the absence of systematic bias toward one class. These findings strengthen the claim that the framework is robust and clinically relevant beyond a single dataset.
Comparison results
To place our findings in context, we compared the performance of the proposed models with recent state-of-the-art approaches for malaria parasite classification, as summarized in Table 6. Previous CNN-based methods, such as VGG19, ResNet50, and MobileNetV2, have reported near-perfect accuracies (95–100%) on the NIH malaria dataset22, while Rahman et al.22, achieved up to 99.3% accuracy on the BBBC041v1 dataset, though such values raise concerns of potential overfitting due to limited external validation. More recent studies, such as Ramakrishnan et al.31, demonstrated ~ 98% accuracy using an ensemble transfer learning approach with Grad-CAM for interpretability, whereas Awe et al.34, applied ensemble machine learning with explainable AI techniques (LIME, SHAP, PFI) on a Nigerian clinical dataset, reporting ROC-AUC values up to 0.869 but substantially lower accuracy (~ 65%) compared to image-based approaches.
In comparison, our proposed Xception and Inception-ResNetV2 models achieved 97.6–97.8% accuracy with a macro-average F1-score of 0.98 on the Kaggle malaria dataset, while also generalizing effectively to an independent external dataset. The strong performance of our models can be attributed to the integration of advanced transfer learning architectures with a two-phase fine-tuning strategy, which enhanced feature extraction while minimizing overfitting. Additionally, systematic preprocessing and mild data augmentation further improved robustness under diverse imaging conditions, and the inclusion of tri explainability (Grad-CAM, LIME and SHAP) provides added interpretability that is often absent in prior studies.
Vision transformer (ViT) comparison
To benchmark our models against emerging transformer-based architectures, we evaluated a Vision Transformer (ViT) trained on the same malaria dataset. The ViT was implemented with patch size 16, embedding dimension 768, and 12 encoder layers, totaling ~ 86 M parameters. During training, the model achieved a peak validation accuracy of ~ 80%. However, on an independent test set, accuracy dropped drastically to 50%, with balanced precision and recall (0.50 each). This indicates that the model failed to generalize despite showing apparent learning in the training phase. By contrast, our Xception and Inception-ResNetV2 models consistently achieved ~ 98% accuracy across validation, test, and external datasets. These findings suggest that while ViTs hold promise in medical imaging, their data-hungry nature and high parameter count limit performance on relatively small and domain-specific datasets such as malaria cell images. In this context, CNN-based hybrid architectures remain more effective and reliable for robust malaria detection.
Ablation study on model design
To evaluate the contribution of individual design components, we performed an ablation analysis. First, we compared standard single-phase fine-tuning with our two-phase fine-tuning strategy. While single-phase training achieved a test accuracy of ~ 96.5%, the two-phase approach reached ~ 97.7%, confirming that progressive unfreezing of layers provides more stable convergence and reduces overfitting.
Explainable AI (XAI) methods
To enhance the interpretability of our deep learning models for malaria parasite detection, we integrated three state-of-the-art explainable artificial intelligence (XAI) techniques, Grad-CAM, LIME, and SHAP. While Grad-CAM and LIME have been widely adopted for visual interpretability in medical imaging, SHAP introduces an additional layer of per-pixel quantitative attribution, enabling deeper insight into model reasoning. Although these methods were applied separately to the Xception-based and Inception-ResNetV2-based architectures, their underlying methodology remains analogous. For clarity and consistency, the explanations and visualizations for both models are presented together, illustrating how each XAI approach contributes uniquely to transparency, reliability, and clinical trustworthiness.
Grad-CAM
Grad-CAM (Gradient-weighted Class Activation Mapping) provides a visual explanation by highlighting the regions within an image that most strongly influence the model’s final prediction. This technique is particularly valuable in medical imaging as it helps to validate that the model is focusing on clinically relevant features.
Image loading and preprocessing
A representative sample image is selected from the “Parasitized” class. This image is first loaded from disk and preprocessed by resizing it to 224 × 224 pixels, converting it into a NumPy array, expanding its dimensions to simulate a batch, and normalizing the pixel values to the [0,1] range. These steps ensure that the image is in the appropriate format for input to the model.
Heatmap computation
A sub-model is constructed that outputs both the activations from a specified convolutional layer (for example, the ‘block14_sepconv2_act’ layer in the Xception model) and the final prediction of the network. Using TensorFlow’s GradientTape, the gradients of the predicted class score (or the highest predicted class if not otherwise specified) with respect to these activations are computed. The gradients are then averaged over the spatial dimensions to obtain a pooled gradient vector that reflects the importance of each feature map channel. Each channel of the feature map is weighted by the corresponding value in this vector, and a dot product is performed to generate a raw heatmap. Finally, the raw heatmap is passed through a ReLU activation and normalized to the [0,1] range, resulting in a final heatmap that highlights the areas most influential for the model’s decision.
Heatmap superimposition
The computed heatmap is resized to the original image dimensions and color-mapped using the JET colormap, which visually encodes high activation regions in warm colors (red, orange, pink) and lower activation regions in cool colors (blue, purple). This colored heatmap is blended with the original image using weighted addition (typically with an alpha blending factor of 0.4) to produce a final visualization that clearly shows the regions driving the model’s prediction. The resulting Grad-CAM explanation plot typically reveals that the model focuses on the central and left portions of the image—areas that often contain critical morphological or staining features associated with malaria infection Fig. 16.

Grad-CAM Visual Explanations for Malaria Detection Using Xception-Based Model (Left) and Inception-ResNetV2 Model (Right). The heatmaps illustrate the discriminative regions used by both models to identify parasitized cells in a blood smear. Warmer colors (red/yellow) indicate areas with higher importance. The Xception model focuses on broader contextual features, while the Inception-ResNetV2 model provides more centered and precise localization of the infected regions.
Quantitative evaluation of Grad-CAM
To further assess the fidelity of Grad-CAM explanations, we evaluated them using standard quantitative XAI metrics: Average Drop, Insertion AUC, and Deletion AUC. On a representative sample image, Grad-CAM achieved an Average Drop of 0.00%, an Insertion AUC of 0.0169, and a Deletion AUC of 0.0516. The zero Average Drop indicates that excluding non-salient regions identified by Grad-CAM did not diminish model confidence, which is desirable. The relatively low Insertion AUC suggests that the progressive addition of salient regions from a blurred baseline contributed modestly to confidence, reflecting limitations in the granularity of the highlighted features. By contrast, the moderate Deletion AUC confirms that removing pixels identified as important by Grad-CAM reduced model confidence, showing alignment between the explanation and the model’s decision-making. Overall, these findings suggest that Grad-CAM captures clinically relevant regions but may have limitations in fine-grained feature localization. Future work could explore more advanced methods such as Integrated Gradients, Grad-CAM + + to further enhance interpretability.
LIME
LIME (Local Interpretable Model-Agnostic Explanations) provides a local explanation of the model’s prediction by approximating how small perturbations in specific regions of an image affect the output. This method is especially useful for confirming that the model bases its decisions on meaningful biological features rather than on irrelevant artifacts.
Prediction function
A custom prediction function is defined to preprocess a list of images. This function resizes each image to the target dimensions (IMG_WIDTH, IMG_HEIGHT) and normalizes the pixel values to the [0,1] range. It then returns the model’s predicted probabilities. This function serves as the classifier function for LIME, ensuring that the perturbed images are processed in the same way as during training.
Explanation generation
An instance of the LimeImageExplainer is created to generate local explanations. A sample image is converted back to an 8-bit unsigned integer format (as required by LIME) and passed to the explainer. The explain_instance method is invoked on the sample image with key parameters:
-
top_labels = 1: Only the highest predicted class is considered for explanation.
-
hide_color = 0: Specifies the background color when certain regions are masked out during perturbation.
-
num_samples = 1000: Indicates that 1000 perturbed versions of the image are generated by masking different combinations of superpixels.
-
This process effectively samples the local neighborhood around the original image, capturing the influence of each region on the final prediction.
Visualization of superpixels
From the generated explanation object, the most influential superpixels are extracted—specifically, the five superpixels that contribute most positively to the model’s prediction (as indicated by the parameters positive_only = True and num_features = 5). Boundaries are overlaid on these superpixels using a boundary marking function, typically resulting in yellow outlines over the original image. The final visualization, titled “LIME Explanation,” clearly delineates the image regions that have the highest positive impact on the predicted class.
LIME explanation plot
In the LIME explanation plot, the superpixel segmentation divides the image into contiguous regions based on color and texture similarity. The perturbation-based approach then reveals which of these superpixels, when retained, significantly increase the probability of the predicted class. In our example, the most influential regions—often concentrated in the left and central parts of the image—are highlighted by yellow outlines. These regions likely correspond to critical morphological cues such as parasite inclusions or cytoplasmic anomalies. This local, model-agnostic explanation confirms that the classifier focuses on medically relevant features, thereby increasing trust in its diagnostic predictions indicated in Fig. 17.
The integration of Grad-CAM and LIME provides complementary insights into the decision-making process of our deep learning models. While Grad-CAM offers a global visualization of the key regions driving the prediction, LIME provides a local, superpixel-based interpretation. Together, these XAI methods ensure that both the Xception-based and Inception-ResNet V2–based models operate in a transparent manner, emphasizing clinically relevant features and enhancing the overall reliability of automated malaria detection.

LIME-Based Visual Interpretations for Malaria Parasite Detection Using Xception-Based Model (Left) and Inception-ResNetV2 Model (Right). The highlighted yellow contours represent image regions identified as most influential in the model’s classification decision. Both models correctly focus on the parasitized area, indicating robust interpretability. The LIME explanations demonstrate consistency in feature attribution across architectures, supporting model transparency and trustworthiness in medical diagnostics.
SHAP
SHAP (SHapley Additive exPlanations) provides a fine-grained, pixel-level interpretation of the model’s predictions by computing the contribution of each input feature toward the final output. Grounded in cooperative game theory, SHAP assigns every pixel an important value that reflects how much it increases or decreases the model’s confidence for a given class. This technique complements Grad-CAM’s global attention maps and LIME’s superpixel-based local explanations by offering a more quantitative, per-pixel perspective on feature attribution.
Image loading and preprocessing
A representative set of correctly classified parasitized cell images (True Positives) was selected for SHAP analysis. Each image was loaded and preprocessed following the same pipeline used for model inference: resizing to 224 × 224 pixels, normalization to the [0, 1] range, and conversion into batched NumPy tensors. To compute background expectations, a small subset of n = 50 preprocessed training images was randomly sampled to represent the overall data distribution. This background serves as a neutral reference for calculating relative pixel contributions.
Computation of SHAP values
The GradientExplainer module from the SHAP library was used to compute pixel-wise attributions. This variant leverages internal model gradients to efficiently approximate SHAP values without the need for sampling-based perturbations. For softmax-based models, SHAP was calculated for the predicted class output neuron; for sigmoid-based architectures, the single output activation was used. The resulting SHAP tensor has the same spatial dimensions as the input image, with each element representing the contribution of a pixel to the model’s output probability.
To improve interpretability, SHAP values were aggregated across RGB channels using the absolute mean, forming a two-dimensional saliency map. This map was normalized and overlayed on the original input image to visualize the areas that most strongly affected the prediction.
Visualization of SHAP heatmaps
In the visualization stage, regions with positive SHAP values (reddish tones) correspond to pixels that increase the confidence in the predicted class, while negative SHAP values (bluish tones) indicate inhibitory effects. Each image pair displays the original input (left) and the SHAP overlay (right). The resulting plots shown in Fig. 18 reveal that the model consistently focuses on intra-cellular parasitic inclusions and cytoplasmic staining patterns areas that are clinically associated with malaria infection. The clear localization of these diagnostic regions in correctly predicted samples confirms that the model’s internal reasoning aligns with biomedical expectations.
Quantitative interpretation and discussion
Across multiple samples, SHAP highlighted morphologically relevant structures within parasitized cells, reinforcing the validity of the model’s learned representations. Unlike Grad-CAM, which provides broader regional saliency, SHAP exposes subtle, high-resolution differences between the infected cytoplasm and surrounding erythrocyte regions. The blue inhibitory halos often observed around cell boundaries indicate that background areas decrease confidence, which is consistent with expected biological reasoning. This detailed attribution demonstrates that the classifier not only detects parasite presence but also learns to suppress irrelevant background signals.

SHAP (GradientExplainer) visualization for a correctly classified parasitized blood smear image (True Positive, class 1, p = 0.90). The left panel shows the original input image, while the right panel displays the corresponding SHAP overlay highlighting pixel-wise contribution scores. Reddish-purple regions represent positive SHAP values that increase the model’s confidence in the “infected” class, whereas bluish tones indicate inhibitory effects. The localized activation near the intra-cellular parasite confirms that the model’s prediction is driven by diagnostically relevant morphological features rather than background noise, reinforcing the biological validity of the network’s learned representations.
By combining Grad-CAM (global focus), LIME (superpixel reasoning), and SHAP (pixel-wise attribution), our framework achieves tri-modal interpretability, enabling multi-scale insights into the CNN’s decision process and enhancing clinical transparency.
Error analysis: misdiagnosed samples explained by LIME, Grad-CAM, and SHAP
Despite achieving high overall accuracy and strong generalization performance, a small subset, approximately 2015 images were misclassified by both hybrid models. To better understand these failure cases, we conducted a detailed post-hoc interpretability analysis using three complementary XAI techniques: LIME, Grad-CAM, and SHAP (GradientExplainer).
Each of these methods provides a unique lens into the model’s decision-making, Grad-CAM identifies the globally salient spatial regions influencing prediction, LIME isolates local superpixel perturbations contributing to the decision, and SHAP offers fine-grained per-pixel contribution scores grounded in cooperative game theory.
Qualitative analysis of misclassified samples
These three examples shown in Fig. 19 illustrate uninfected red blood cells incorrectly classified as parasitized by the model. Despite the absence of intra-erythrocytic parasites, both Grad-CAM and LIME visualizations reveal that the model’s attention was drawn to non-diagnostic image features. In all three cases, LIME superpixel maps highlighted high-weight regions corresponding to faint cytoplasmic stains, peripheral shadows, or edge artifacts, features that resemble the chromatin or ring patterns typical of infected cells. Similarly, Grad-CAM heatmaps concentrated activation in these peripheral or textured regions rather than in the central cytoplasmic zones where parasite inclusions would normally appear. This consistent misattribution indicates that the classifier was influenced by staining irregularities and background noise rather than biologically meaningful morphology. Such findings emphasize the value of explainable AI in identifying model vulnerabilities and highlight the need for improved preprocessing or data augmentation strategies to mitigate the influence of non-parasitic artifacts.

Grad-CAM and LIME visual interpretations for three misdiagnosed (false-positive) red blood cell samples. Each triplet shows (left) the original image with ground-truth and predicted labels, (middle) LIME superpixel-based explanations, and (right) Grad-CAM heatmaps. In all cases, the model erroneously focused on peripheral stains, background textures, or cytoplasmic discoloration, mistaking them for parasitic features. These visualizations collectively reveal that color and boundary artifacts can lead to false-positive malaria detections, underscoring the necessity of artifact-aware model refinement.
The samples shown in Fig. 20 illustrate misclassified uninfected red blood cells (true class 0) that were incorrectly predicted as parasitized (pred class 1) by the CNN model. The SHAP overlays generated using the GradientExplainer reveal that pixel-level attributions are highly concentrated around faint purple staining or edge irregularities rather than distinct parasite morphologies. In both cases, SHAP identifies localized positive contributions in areas of cytoplasmic discoloration and near-cell boundaries, suggesting that the model associated these artifacts with infection-related features. This misattribution indicates that subtle staining artifacts or morphological asymmetries can strongly influence the learned decision boundary. These insights highlight SHAP’s ability to pinpoint the precise pixel regions responsible for false positives, providing a more granular understanding of model failure compared to Grad-CAM and LIME.

Misdiagnosed samples explained using SHAP (GradientExplainer). Each example shows an uninfected cell (true class 0) misclassified as parasitized (pred class 1). The SHAP overlays highlight per-pixel contributions that misled the classifier, primarily faint staining and boundary irregularities rather than parasite structures. These fine-grained attributions reveal how minor cytoplasmic color variations can induce false positives, underscoring SHAP’s value in identifying subtle but influential artifacts in microscopy-based diagnostics.
Discussion
This study presents a comprehensive evaluation of deep learning models for the classification of malaria-infected and uninfected blood smear images. Through a systematic experimentation pipeline, both baseline and advanced hybrid models were tested for their effectiveness in diagnostic performance, interpretability, and generalization capacity.
The empirical evaluation revealed that among the baseline CNN models, ResNet18 achieved the highest performance (F1-score = 96.33%), followed by InceptionV3 and VGG19. MobileNetV2, while more lightweight, trailed slightly behind. These results validated the robustness of deep convolutional architectures for parasitic classification but also highlighted room for improvement in terms of generalization and class-specific sensitivity. Building on these insights, we explored two high-performing hybrid transfer learning models: Xception and Inception-ResNetV2. Both models were fine-tuned using a two-stage strategy and achieved approximately 98% classification accuracy on both validation and test datasets. This improvement can be attributed to the architectural strengths of these models depthwise separable convolutions in Xception and residual scaling in Inception-ResNetV2 which facilitate efficient feature extraction and improved convergence.
In comparison to recent studies, our approach demonstrates notable advantages. For instance, Rahman et al.22 and Alnussairi & Ibrahim22 achieved > 95% and ~ 98% accuracy, respectively, using models like ResNet, VGG19, and MobileNetV2. However, these works did not incorporate robust interpretability or dimensionality reduction analysis. Our models not only matched or exceeded these performance levels but also provided tri-mode explainability using Grad-CAM, LIME and SHAP, a feature lacking in many prior models. Unlike Goni and Mondal31, and Raihan and Nahid32, who employed SHAP with lightweight CNNs and achieved high accuracy, our method delivers competitive performance while offering enhanced interpretability with both spatial (Grad-CAM) and perturbation-based (LIME) explanations. This tri-model XAI approach increases transparency and clinical trust, aligning with calls for explainability in AI-driven diagnostics noted in recent reviews34. Ensemble-based techniques by Ramakrishnan et al.31 yielded robust performance and parasite stage classification, their computational cost was notably high. In contrast, our proposed architectures offer a balance of high accuracy and computational efficiency, with fewer parameters and faster convergence times, making them more feasible for real-time or edge deployment scenarios.
Furthermore, this study extends interpretability beyond visualization by incorporating SHAP (SHapley Additive exPlanations) to provide pixel-level attribution analysis. The addition of SHAP complements Grad-CAM’s spatial attention and LIME’s regional perturbation analysis with fine-grained, theoretically grounded feature importance maps. Representative misdiagnosed cases were analyzed across all three XAI methods, revealing that false positives often arose from cytoplasmic staining artifacts or boundary irregularities that visually mimic parasitic structures. These findings highlight SHAP’s ability to clarify subtle model failure modes and strengthen the interpretability and diagnostic reliability of the proposed framework.
Dimensionality reduction techniques (PCA and t-SNE) further validated the learned feature spaces, demonstrating clear clustering between parasitized and uninfected samples. The ROC and precision-recall curves confirmed nearly perfect classification capabilities (AUC = 1.00), while the per-batch stability suggests robustness across diverse test conditions. These strengths underscore the practical readiness of our models for deployment in real-world diagnostic workflows. This study presents a comprehensive evaluation of deep learning models for the classification of malaria-infected and uninfected blood smear images. Through a systematic experimentation pipeline, both baseline and advanced hybrid models were tested for their effectiveness in diagnostic performance, interpretability, and generalization capacity.
Conclusion
This paper demonstrates the significant potential of deep learning in automating the detection of malaria parasites from microscopic blood smear images. The proposed hybrid models Xception and Inception-ResNetV2 outperform traditional CNN baselines in terms of accuracy, F1-score, and robustness across different validation metrics. By combining high accuracy with interpretability through Grad-CAM and LIME, the models offer a balanced and practical solution for AI-assisted malaria diagnostics.
Limitations
Despite the promising results, this study has several limitations. First, the computational demands of the selected architectures (Xception with ~ 22 million parameters and Inception-ResNetV2 with ~ 55 million parameters) require substantial training time and GPU resources, which may restrict their direct deployment in low-resource clinical environments. Future work should consider model compression techniques such as pruning, quantization, and TensorFlow Lite conversion to enable real-time use on mobile or edge devices. Second, while the Kaggle dataset provides a large benchmark of thin blood smears, it may not fully capture the diversity of staining protocols, imaging equipment, or regional variations in malaria presentation. This raises the possibility of dataset bias. To address this concern, we validated our framework on an independent dataset from the Harvard Dataverse, which confirmed robustness across different imaging conditions; however, multi-center clinical trials would still be needed for broader generalizability.
While the proposed tri-modal XAI framework (Grad-CAM, LIME, and SHAP) significantly enhances interpretability, each method has inherent limitations. Grad-CAM may lack pixel-level precision, LIME can exhibit instability under superpixel segmentation, and SHAP, though more granular, is computationally intensive. Finally, while reproducibility is a critical aspect of clinical AI research, many prior studies have not made their resources openly available. In contrast, we have provided our complete code, trained models, and documentation in an open-source GitHub repository to encourage transparency and adoption.
These limitations are consistent with challenges reported in other explainable AI and deep learning applications in biomedical domains43,44. Addressing them in future work will be key to translating malaria detection systems into trustworthy, real-world diagnostic tools43,44.
Threats to validation
Although the proposed framework demonstrates competitive performance, several factors may threaten the validity of our findings. First, the Kaggle dataset does not provide patient-level identifiers, which means that complete assurance of patient-level separation between training and testing sets cannot be guaranteed. This introduces the potential risk of data leakage that could artificially inflate performance metrics. Second, the consistently high accuracy (~ 98%) raises the possibility of overfitting. We mitigated this concern by adopting a two-phase fine-tuning strategy and validating on an independent external dataset42 (Harvard Dataverse), which confirmed robustness; however, broader multi-center validation is still needed. Third, potential class imbalance and staining variability across different datasets may affect robustness in real-world deployment. Finally, while explainability (Grad-CAM, LIME and SHAP) improves interpretability, the limited granularity of Grad-CAM heatmaps may constrain clinician confidence in borderline cases. These threats underscore the importance of future work on multi-source datasets, patient-level annotations, model regularization, and clinician-in-the-loop evaluation to strengthen the validity and reliability of our approach.
Deployment considerations in resource-limited settings
Although the proposed models demonstrate strong performance, their deployment in low-resource clinical environments requires careful consideration. While architectures such as Inception-ResNetV2 are computationally intensive during training, their inference phase can be made lightweight through model compression and optimization techniques (e.g., pruning, quantization, TensorFlow Lite conversion). These strategies enable implementation on mobile devices or point-of-care hardware, making the system more accessible in under-resourced regions. Additionally, the system is designed to integrate seamlessly into existing diagnostic workflows, requiring minimal user training. Importantly, the inclusion of explainability (Grad-CAM and LIME and SHAP) not only enhances transparency but also provides visual decision support, helping clinicians validate automated predictions. These considerations highlight the potential of our framework to be adapted for real-world malaria screening in diverse healthcare settings.
Future directions
While the current models perform exceptionally well in binary classification (infected vs. uninfected), several avenues exist to further enhance the utility and scope of this work:
-
Stage classification and parasite typing: Extend the models to classify not just the presence of infection but also the specific stage of parasite development (e.g., trophozoite, schizont) and the Plasmodium species involved (e.g., P. falciparum vs. P. vivax).
-
Multi-modal integration: Integrate clinical data (e.g., patient symptoms, geographical metadata) with image-based models to enhance diagnostic context and reduce false positives/negatives.
-
Semi-supervised learning and data augmentation: Incorporate unsupervised and semi-supervised techniques to reduce dependence on annotated data and further improve model robustness.
-
Local dataset collection and validation: Initiate the ethical collection of a locally sourced malaria blood smear dataset in collaboration with healthcare institutions. This dataset will capture region-specific imaging variations and staining protocols, enabling stronger clinical validation, adaptability, and model generalization for real-world deployment.
By pursuing these directions, we aim to transition from a high-performing prototype to a clinically deployable AI system capable of supporting frontline malaria diagnosis and improving health outcomes globally.
Data availability
Data is publicly available on https://www.kaggle.com/datasets/iarunava/cell-images-for-detecting-malaria. To ensure transparency and reproducibility, we have made the complete codebase, trained model weights, and documentation publicly available at https://github.com/NadiaSultan20/Malaria-Diagnosis-.git.
References
Organization, W. H. World malaria report 2023. World Health Organization (2023). https://www.who.int/publications/i/item/9789240078344
Gallup, J. L. & Sachs, J. D. The economic burden of malaria. Am. J. Trop. Med. Hyg. 64 (1), 85–96 (2000).
Gollin, D. & Zimmermann, C. Malaria: disease impacts and long-run income differences. IZA Discuss. Papers Proc. Natl. Acad. Sci. 104 (40), 16202–16207 (2007).
Parham, P. E. & Michael, E. Modeling the effects of weather and climate change on malaria transmission. Environ. Health Perspect. 118 (5), 620–626 (2010).
Sachs, J. & Malaney, P. J. N. The economic and social burden of malaria. Nature 415, 680–685 (2002).
WANDA Travel in good health, Malaria-world map. (2024). https://www.wanda.be/en/a-z-index/malaria-world-map/
Malaria, T., Unit & Ministry of National Health Services, Regulations and Coordination Pakistan. (2024). https://www.cmu.gov.pk/dmc-directorate-of-malaria-control/
Organization, W. H. World malaria report (2022), China certified malaria-free by WHO. https://www.who.int/news/item/30-06-2021-who-certifies-china-malaria-free
Zhang, L., Yi, B. Y., Xia, Z. G. & Yin, J. H. Epidemiological characteristics of malaria in China. Chin. J. Parasitol. Parasitic Dis. 42 (2), 135–139 (2021).
Centers for Disease Control and Prevention. Malaria lifecycle. (2023). https://www.cdc.gov/malaria/about/biology/index.html.
Miller, L. H., Baruch, D. I., Marsh, K. & Doumbo, O. K. The pathogenic basis of malaria. Nature 415 (6872), 673–679 (2002).
Wilson, M. L. Malaria rapid diagnostic tests. Clin. Infect. Dis. 54 (11), 1637–1641 (2012).
Beshir, K. B., Parr, J. B., Cunningham, J., Cheng, Q. & Rogier, E. Screening strategies and laboratory assays to support plasmodium falciparum histidine-rich protein deletion surveillance: where we are and what is needed. Malar. J. 21 (1), 201 (2022).
Rougemont, M. et al. Detection of four plasmodium species in blood from humans by 18S rRNA gene subunit-based and species-specific real-time PCR assays. J. Clin. Microbiol. 42 (12), 5636–5643 (2004).
Litjens, G. et al. A survey on deep learning in medical image analysis. Med. Image. Anal. 42, 60–88 (2017).
LeCun, Y., Bengio, Y. & Hinton, G. Deep learning. Nature. 521 (7553), 436–444. (2015).
Rajaraman, S. et al. Pre-trained convolutional neural networks as feature extractors toward improved malaria parasite detection in thin blood smear images. PeerJ 6, e4568 (2018).
Yang, F. et al. Deep learning for smartphone-based malaria parasite detection in Thick blood smears. IEEE J. Biomed. Health Inf. 24 (5), 1427–1438 (2019).
Fuhad, K. F. et al. Deep learning based automatic malaria parasite detection from blood smear and its smartphone based application. Diagnostics 10 (5), 329 (2020).
Selvaraju, R. R. et al. Grad-cam: Visual explanations from deep networks via gradient-based localization. In Proceedings of the IEEE International Conference on Computer Vision, 618–626 (2017).
Rahman, A., Zunair, H., Reme, T. R., Rahman, M. S. & Mahdy, M. R. A comparative analysis of deep learning architectures on high variation malaria parasite classification dataset. Tissue Cell. 69, 101473 (2021).
Alnussairi, M. H. & Ibrahim, A. A. Malaria parasite detection using deep learning algorithms based on (CNNs) technique. Comput. Electr. Eng. 103, 108316 (2022).
Das, D. K., Ghosh, M., Pal, M., Maiti, A. K. & Chakraborty, C. Machine learning approach for automated screening of malaria parasite using light microscopic images. Micron 45, 97–106 (2013).
Telang, H. & Sonawane, K. Effective performance of bins approach for classification of malaria parasite using machine learning. In 2020 IEEE 5th International Conference on Computing Communication and Automation (ICCCA), 427–432 (IEEE, 2020).
Suriya, M., Chandran, V. & Sumithra, M. G. Enhanced deep convolutional neural network for malarial parasite classification. Int. J. Comput. Appl. 44 (12), 1113–1122 (2022).
Chima, J. S., Shah, A., Shah, K. & Ramesh, R. Malaria cell image classification using deep learning. Int. J. Recent. Technol. Eng. 8 (6), 5553–5559 (2020).
Vijayalakshmi, A. Deep learning approach to detect malaria from microscopic images. Multimed. Tools Appl. 79 (21), 15297–15317 (2020).
Masud, M. et al. Leveraging deep learning techniques for malaria parasite detection using mobile application. Wirel. Commun. Mob. Comput. 2020(1), 8895429 (2020).
Ahamed, M. F. et al. Improving malaria diagnosis through interpretable customized CNNs architectures. Sci. Rep. 15 (1), 6484 (2025).
Ramakrishnan, K., Pawar, P. M., Muthalagu, R. & Rajak, A. A. Ensemble transfer learning for accurate malaria detection with stage classification & explainable AI. In 2024 International Conference on Modeling, Simulation & Intelligent Computing (MoSICom), 264–269 (IEEE, 2024).
Goni, M. O., Mondal, M. N. & Explainable, A. I. Based Malaria Detection Using Lightweight CNN. In 2023 International Conference on Next-Generation Computing, IoT and Machine Learning (NCIM), 1–5 (IEEE, 2023).
Raihan, M. J. & Nahid, A. A. Malaria cell image classification by explainable artificial intelligence. Health Technol. 12 (1), 47–58 (2022).
Awe, O. O., Mwangi, P. N., Goudoungou, S. K., Esho, R. V. & Oyejide, O. S. Explainable AI for enhanced accuracy in malaria diagnosis using ensemble machine learning models. BMC Med. Inf. Decis. Mak. 25 (1), 162 (2025).
Grignaffini, F., Simeoni, P., Alisi, A. & Frezza, F. Computer-aided diagnosis systems for automatic malaria parasite detection and classification: A systematic review. Electronics 13 (16), 3174 (2024).
Goswami, N. G. et al. Detection of sickle cell disease using deep neural networks and explainable artificial intelligence. J. Intell. Syst. 33 (1), 20230179 (2024).
Goenka, N. et al. A regularized volumetric ConvNet based alzheimer detection using T1-weighted MRI images. Cogent Eng. 11 (1), 2314872 (2024).
Dsilva, L. R. et al. Wavelet scattering‐and object detection‐based computer vision for identifying dengue from peripheral blood microscopy. Int. J. Imaging Syst. Technol. 34 (1), e23020 (2024).
Hassan, E., Saber, A., El-Sappagh, S. & El-Rashidy, N. Optimized ensemble deep learning approach for accurate breast cancer diagnosis using transfer learning and grey Wolf optimization. Evol. Syst. 16 (2), 59 (2025).
Hassan, E., Saber, A., Abd El-Hafeez, T., Medhat, T. & Shams, M. Y. Enhanced dysarthria detection in cerebral palsy and ALS patients using WaveNet and CNN-BiLSTM models: A comparative study with model interpretability. Biomed. Signal Process. Control. 110, 108128 (2025).
Hassan, E., Saber, A., El-kenawy, E. S. M., Bhatnagar, R. & Shams, M. Y. Early detection of black fungus using deep learning models for efficient medical diagnosis. In 2024 International Conference on Emerging Techniques in Computational Intelligence (ICETCI), 426–431 (IEEE, 2024).
Obuchowski, N. A. & Bullen, J. A. Receiver operating characteristic (ROC) curves: review of methods with applications in diagnostic medicine. Phys. Med. Biol. 63 (7), 07TR01 (2018).
Mung’ong’o, S. G., Mwalongo, D. A. & Kaijage, S. The Nelson Mandela African Institution of Science and Technology Malaria Dataset [Data set]. Harvard Dataverse. https://doi.org/10.7910/DVN/O2WVWA (2024).
Baydili, İ. T. & Tasci, B. Predicting employee attrition: XAI-Powered models for managerial decision-making. Systems 13 (7), 583 (2025).
Solmaz, Ö. A., Tasci, B. & ViSwNeXtNet deep patch-wise ensemble of vision transformers and ConvNeXt for robust binary histopathology classification. Diagnostics. 15 (12), 1507 (2025).
Funding
Princess Nourah bint Abdulrahman University Researchers Supporting Project number (PNURSP2025R104), Princess Nourah bint Abdulrahman University, Riyadh, Saudi Arabia.
Author information
Authors and Affiliations
Contributions
Conceptualization, R.P., N.S. and J.F., methodology, R.P. and J.F., software, R.P. and N.S., validation, B.Z.Q. and W.S., formal analysis, N.A. and M.M.J., investigation, B.Z.Q., resources, W.S. and B.Z.Q., data curation, R.P., writing-original draft preparation, R.P., N.S. and J.F., writing-review and editing, B.Z.Q. and W.S., visualization, N.S., supervision, B.Z.Q. and W.S., project administration, B.Z.Q. and S.M.M., funding acquisition, S.M.M. All authors reviewed and approved the final manuscript.
Corresponding authors
Ethics declarations
Competing interests
The authors declare no competing interests.
Additional information
Publisher’s note
Springer Nature remains neutral with regard to jurisdictional claims in published maps and institutional affiliations.
Rights and permissions
Open Access This article is licensed under a Creative Commons Attribution-NonCommercial-NoDerivatives 4.0 International License, which permits any non-commercial use, sharing, distribution and reproduction in any medium or format, as long as you give appropriate credit to the original author(s) and the source, provide a link to the Creative Commons licence, and indicate if you modified the licensed material. You do not have permission under this licence to share adapted material derived from this article or parts of it. The images or other third party material in this article are included in the article’s Creative Commons licence, unless indicated otherwise in a credit line to the material. If material is not included in the article’s Creative Commons licence and your intended use is not permitted by statutory regulation or exceeds the permitted use, you will need to obtain permission directly from the copyright holder. To view a copy of this licence, visit http://creativecommons.org/licenses/by-nc-nd/4.0/.
About this article

Cite this article
Parveen, R., Qui, B., Song, W. et al. Trustworthy deep learning for malaria diagnosis using explainable artificial intelligence. Sci Rep 15, 45037 (2025). https://doi.org/10.1038/s41598-025-28387-7
Received:
Accepted:
Published:
Version of record:
DOI: https://doi.org/10.1038/s41598-025-28387-7
