
Abstract
Foam ceramics are widely used in industrial applications due to their unique properties, including high porosity, lightweight, and high-temperature resistance. However, their complex microstructure presents significant challenges for image analysis. Traditional machine learning methods often fall short in capturing both global feature dependencies and detailed representations. To address this, a novel artificial intelligence recognition model, FD-Conv, is proposed, which combines the global information processing capabilities of Transformers with the local feature extraction strengths of convolutional neural networks. Additionally, a frequency domain block detail enhancement mechanism is introduced to improve recognition accuracy. Experimental results demonstrate that the FD-Conv model enhances recognition accuracy by at least 7.6% compared to state-of-the-art methods. Furthermore, the model effectively identifies foam ceramics with varying compositions and formulations and quantifies their microstructural phase characteristics. This research aims to advance the application of foam ceramic microstructure image analysis by improving recognition accuracy, particularly in multi-source microscopic image feature learning and pattern recognition.
Introduction
The excellent properties of foam ceramics, including lightweight construction, sound absorption, thermal insulation, and corrosion resistance, have led to their extensive use in a variety of fields, including automotive manufacturing, metallurgy, chemical industry, electronics, construction, nuclear reactors, and others1. These properties demonstrate significant potential and value in a range of applications. The microstructure of foam ceramics is complex and multifaceted, encompassing a multitude of structural characteristics, including pore distribution, connectivity, morphology, and material composition. This information, taken together, determines the performance of the material2. It is therefore of practical necessity to gain an understanding of the microstructure information of foam ceramics.
Machine learning techniques are predominantly employed for the analysis of material microstructure data now3. However, accurately identifying the microstructure of heterogeneous foam ceramics is a highly challenging endeavor, and the effective recognition of its microstructure is a prerequisite for material analysis.
Traditional machine learning has made some progress in the field of materials microstructure recognition4, covering several key application areas, including microstructure image classification, feature extraction, quantitative analysis, automated processing, and pattern recognition of complex structures5,6,7. First, deep learning algorithms, especially convolutional neural networks (CNNs)8, have been widely used for automatic feature extraction and classification from microscopic images9,10, as well as for the segmentation of backscattered electron (BSE) images11,12. This method efficiently identifies similar types of microstructures13, such as grains, phase boundaries, and defects, thereby supporting the evaluation and prediction of material properties14,15,16. Secondly, machine learning has demonstrated strong capabilities in the quantitative analysis of microstructures, enabling precise measurements of features such as grain size and shape distribution through semantic image recognition, thus making material property evaluations more scientific17,18. With the development of high-throughput microscopy techniques19,20, traditional machine learning can more effectively understand the relationship between microstructures and material properties through statistical spatial mapping15,21. Additionally, in dealing with complex materials, machine learning algorithms can analyze large datasets22, deeply understanding the relationships and patterns among different microstructures23, further advancing materials science. However, despite the great potential of machine learning in this field, it still faces some challenges, such as the high dimensionality and imbalance of data, and the reliance on experimental validation24.
It can be observed that traditional machine learning methods primarily employ a statistical learning approach when identifying material structures, using composition, process, and microstructure information extracted from images as model inputs. However, early machine learning methods were constrained by their inability to fully understand and capture global dependencies, facing challenges in this regard. Additionally, they had limited feature representation capabilities and insufficient interpretability25. A notable issue was that these machine learning methods often failed to accurately identify and predict the structures of unseen materials26.
As the development of artificial intelligence technology advances, the application of the Transformer architecture’s principles can be considered for the identification and prediction of microstructures in foam ceramics27. AI algorithms based on the Transformer architecture are adept at interpreting various positions and features within an image, while also accommodating images of different scales, thereby enhancing the interpretability of the model. This robust deep learning model framework is extensively utilized in image prediction research, where it can automatically extract image information without the necessity for human intervention28. In comparison to traditional machine learning methods, models that integrate Transformer concepts are more adept at capturing global non-linear relationships and spatiotemporal dependencies within the images of microstructures in foam ceramics29.
In the field of image recognition, AI has given rise to a series of SOTA algorithms, each distinguished by its unique algorithmic design and performance advantages. These algorithms have achieved significant results in image processing tasks30.
The latest SOTA methods have made significant strides in the field of image recognition. However, they still face certain limitations when dealing with images of material microstructures. Firstly, there are limitations in feature extraction. For instance, images of foam ceramics microstructures contain complex micro-organizational structures that often require extremely high resolution and detail-capturing capabilities. These structures frequently include minute defects, cracks, phase transformations, and other features that are crucial in the analysis of material microstructures31,32. Consequently, fine-grained processing is necessary, but these features and their processing methods may be too complex for traditional image recognition models, surpassing the feature extraction capabilities of conventional CNNs or Transformer models. Secondly, data on material microstructures often exhibit high heterogeneity. Different materials, preparation processes, and imaging conditions can all result in varying image characteristics, necessitating a model that can adapt to diverse data distributions. This leads to material microstructure images being highly detail-sensitive. The data on foam ceramics microstructures in this study provides a clear illustration of this phenomenon. These images cannot be easily predicted by the eye to belong to specific materials or to have been made with certain additives. Therefore, it is particularly important to design an AI algorithm specifically for the structural recognition of material microstructure images. Such an algorithm needs to adapt to the complexity and sensitivity to detail of material microstructure images31,32,33.
This paper puts forth a novel approach, namely FD-Conv method, for processing microstructure images of foam ceramics. The FD-Conv method integrates the design concepts of Transformers with Convolutional Neural Networks with the objective of constructing a network architecture that demonstrates exceptional performance across a range of visual tasks. Compared to traditional machine learning methods, the FD-Conv method not only inherits the concepts from Transformers in handling long-range dependencies and global information but also fully utilizes the strong capabilities of convolutional neural networks in local feature extraction and hierarchical feature learning. To further enhance the algorithm’s sensitivity to and processing capability for the fine details of microstructure images, the FD-Conv method specifically introduces a frequency-domain block design. This innovative design enables more precise capture of subtle features in microstructures, such as small pores, cracks, and phase transitions, by analyzing and processing images in the frequency domain. The introduction of the frequency domain block allows the FD-Conv method to exhibit higher accuracy and robustness when processing complex and variable microstructure images. This paper includes multiple classes of foam ceramic microstructure images, marking the first attempt to conduct a comprehensive analysis of multi-source foam ceramic microstructure images with uneven spatial resolution.
FD-conv model network architecture
The FD-Conv model is designed for processing, analyzing, and recognizing foam ceramic microstructure images. It integrates high-pass filters, frequency domain blocks, and Blocks to enhance feature extraction and processing efficiency. The high-pass filter emphasizes edges and textures by focusing on high-frequency components. The frequency domain block uses fast Fourier transform, high-pass filtering, and inverse Fourier transform for efficient feature extraction in the frequency domain. The Block employs depthwise separable convolution, layer normalization, pointwise convolution, and the activation function for effective feature processing. Additionally, downsampling layers and residual connections improve feature extraction and generalization. These components enable the FD-Conv model to accurately recognize foam ceramic microstructures. The architectural design is depicted in Fig. 1.

The frequency domain block enhances image details and removes noise through a combination of Fast Fourier Transform, high-pass filtering, and inverse Fourier Transform, thereby improving the FD-Conv model’s image processing capability.
High-pass filter
The high-pass filter function is utilized to remove low-frequency information while retaining high-frequency information when processing images or signals. In image processing, low-frequency information typically corresponds to smooth regions of the image, whereas high-frequency information corresponds to edges or details34. The purpose of this function is to suppress low-frequency components in the Fourier (frequency domain) representation of the image, thereby highlighting the image’s high-frequency details.
First, the function checks the four dimensions of the input, which, for a batch of image data, are (N, C, H, W), representing the batch size, number of channels, image height, and width, respectively. Next, the high-pass filter function creates a mask ‘mask‘ with the same shape as the input. To achieve high-pass filtering, the low-frequency regions of the mask are set to 0, and the high-frequency regions are set to 1, defining a cutoff threshold for low frequencies. Specifically, in both the horizontal and vertical directions, the threshold region from the edges to the center of the mask is set to 0. Considering that the edge regions of microstructure images can be affected by edge effects35, imaging artifacts36, non-uniformity37, and human-induced defects38, using a high-pass filtering method can obtain more accurate and representative material characteristic data. Then, by element-wise multiplying the mask with the (H, W) dimensions of the input, the high-frequency information is retained while the low-frequency information is suppressed, as shown in the HPF part of Fig. 1. Only the positions with a value of 1 in the mask (high-frequency regions) are retained, while the positions with a value of 0 (low-frequency regions) are filtered out.
This high-pass filtering method is integrated into the FD-Conv model’s Spectrum Block, enhancing feature extraction capabilities by focusing on high-frequency image details39. This method effectively removes low-frequency noise, enhances edges and details, and improves the model’s performance in image processing tasks.
Frequency domain design
The primary objective of the Frequency Domain Block (FDB) is to analyze the input image from a complex number perspective, capturing a range of frequency components to extract local frequency-domain features. It consists of a Fast Fourier Transform (FFT) layer, a High-Pass Filter layer, and an Inverse Fourier Transform (IFFT) layer, as depicted in Fig. 1.
Initially, the input microstructure image is normalized using Layer Norm to stabilize training. The input is then processed through a Multi-Layer Perceptron (MLP) network, comprising a linear layer, a ReLU activation function, and another linear layer. This normalization and MLP processing facilitate feature transformation and nonlinear mapping, enhancing the expressive capability of the input features and improving model performance. Next, the FFT converts the image data from the spatial domain to the frequency domain, where a high-pass filter processes frequency components. The IFFT converts the processed data back to the spatial domain, retaining only the real component of high-frequency information. This ensures that the frequency-domain processed image is accurately represented in the spatial domain. Subsequently, a second Layer Norm and further feature extraction through the MLP refine the data. A residual module performs a point-wise summation of the processed features and the input features, achieving feature fusion. This residual connection preserves input information and enhances the richness and robustness of feature extraction.
The FDB, integrating FFT, high-pass filtering, and IFFT, is an effective frequency-domain feature extraction method for the FD-Conv model. It significantly enhances image processing capabilities, particularly in noise removal and detail enhancement, demonstrating its potential and advantages in image processing tasks.
Block design
The FD-Conv model incorporates four blocks, each designed to efficiently process and abstract input features through a combination of depthwise separable convolution, layer normalization, pointwise convolution, GELU activation, layer scaling, and path dropout40.
Each block begins with a depthwise separable convolution layer (DW-Conv), using a single convolutional kernel per input channel to significantly reduce model parameters and computational load. The DW-Conv, configured with kernel=7, stride=2, and padding=3, consolidates channel information while preserving spatial information and enhancing feature capture, as detailed in Fig. 1. Next, the feature maps are permuted from (N, C, H, W) to (N, H, W, C) for LayerNorm, facilitating accurate normalization. Layer normalization standardizes features to maintain a consistent distribution, aiding gradient computation and model convergence. Following normalization, two pointwise convolutions with kernel=1 and stride=1 expand and compress the feature dimension. The first layer quadruples the channels, and the second reduces them back, refining feature interaction discernment. The GELU activation function, introducing nonlinearity, enhances the model’s expressive power by emulating neuron activation probabilities. A learnable layer scaling parameter, gamma, modulates pointwise convolution outputs, allowing adaptive feature intensity adjustment based on input data. This enhances model flexibility. The feature maps are then permuted back to (N, C, H, W). A residual connection combines the original input with processed features, followed by the DropPath operation. DropPath randomly discards outputs during training to prevent overfitting and foster feature diversity. Throughout each block, the width and height of feature maps remain unchanged, while the number of channels is altered. Layer normalization, pointwise convolution, GELU activation, and layer scaling preserve feature map dimensions, and DropPath does not affect dimensions. Consequently, the input and output dimensions of each block remain consistent with the downsampling layer.
In essence, these components elevate the model’s feature extraction capabilities and enhance generalization performance.
FD-conv model construction
The structure of the FD-Conv model comprises several key components: the Stem Layer, consisting of a convolutional layer and LayerNorm; Downsample Layers, composed of sequential LayerNorm and convolutional layers; Stages, each comprising a series of Blocks; and the Predictive Head, which includes Global Average Pooling and the final output layer for prediction tasks.
Initially, the microscopic structure image is processed through a convolutional layer with a kernel size of 4 and a stride of 4, which downsamples the image and increases the number of channels. LayerNorm then standardizes the output, enhancing model stability and training speed. The model comprises four stages of Blocks. Each Block employs depthwise separable convolution, followed by LayerNorm, two pointwise convolutions, and a GELU activation function, with optional DropPath and layer scaling. The number of Blocks per stage varies, controlling the model’s size and complexity. Three downsample layers precede the Blocks of the last three stages. Each downsample layer consists of LayerNorm and a convolutional layer with kernel=2 and stride=2, reducing feature map size and increasing the number of channels to deepen the model. Additionally, the FDB layer is incorporated before the Blocks of the first two stages to enhance feature extraction in the frequency domain. Finally, Global Average Pooling (GAP) is applied after the last Block to average each channel’s values. A linear layer then maps this output to the recognition predictions, with the output dimension corresponding to the number of classes.
The FD-Conv model includes an initial stem layer followed by three downsample layers, each connecting different model stages. The input image dimension is \(96 \times 1 \times 224 \times 224\), with subsequent downsampled dimensions being \(56 \times 56 \times 96\), \(28 \times 28 \times 192\), \(14 \times 14 \times 384\), and \(7 \times 7 \times 768\). The depths of the four Blocks are set to [3, 3, 9, 3]. The input and output dimensions for each stage match the corresponding downsample layer. Ultimately, the model employs a MLP output layer to classify different refractory material microstructure images.
The FD-Conv model enhances image feature extraction capabilities by combining advanced techniques such as DW-Conv, frequency domain processing, MLP, and residual connections. DW-Conv effectively reduce computational load and parameters, thereby improving computational efficiency. Meanwhile, frequency domain processing (FFT and IFFT) aids in extracting high-frequency information from images, enhancing detail and noise suppression, and ensuring more accurate feature capture. The model’s multi-stage structure and downsampling layer design not only optimize the feature extraction process but also improve the network’s stability and expressiveness. Furthermore, the residual connections and frequency domain enhancement provide the model with robust information transmission and feature fusion capabilities, enhancing its generalization ability and robustness. Although the model faces higher computational and memory demands when processing large-scale data, the carefully designed modules and efficient computational strategies enable the FD-Conv model to fully leverage its powerful image analysis potential while balancing accuracy and efficiency, demonstrating excellent scalability and application value.
Dataset creation
Dataset creation starts with preparing materials and collecting data on their microstructure characteristics41. This involves recording synthesis methods, process parameters, physical property test data, and other relevant details. It is crucial to meticulously document these parameters, conditions, structural characteristics, and performance data42. Such a dataset is vital for materials science research and engineering applications.
Preparation of materials
This section outlines the preparation methods for six materials, including \(\mathrm Bi_4B_2O_9\), \(\mathrm BPO_4\), \(\mathrm 4Bi_2O_3\) \(\cdot\) \(\mathrm xB_2O_3\), \(\mathrm Bi_6B_{10+2x}O_{24+3x}\), and \(\mathrm Mg_2B_2O_5\)+\(\mathrm MgB_4O_7\) foam ceramics. By varying raw material ratios and processing conditions, materials with diverse structures and properties were prepared and characterized. These microstructure images are used to develop AI algorithms for recognition material properties. In addition, classify the SEM images of MgO-C into one category.

The microstructure images and quantities of all materials used as training and testing sets.
This section presents the preparation methods for six types of materials. By varying the proportions of raw materials and process conditions, materials with different structures and properties were prepared and their microstructures characterized. These microstructure images will serve as the basis for artificial intelligence algorithms to predict material properties.
-
(1)
\(\text {Bi}_4\text {B}_2\text {O}_9\) foam ceramics: Bismuth oxide and boric acid (molar ratio 4:2.5) were mixed in a planetary ball mill, sintered at \(500^{\circ }\)C, and ground. The ceramic powder, deionized water, dispersing agent, and zirconia balls were mixed to prepare the ceramic slurry. A pore-forming agent and gelatin solution were added, and the foam was molded, dried at \(25^{\circ }\)C, and heated to \(570^{\circ }\)C to produce \(\text {Bi}_4\text {B}_2\text {O}_9\) foam ceramics43. microstructure images were categorized into 9 classes, each with 1 image.
-
(2)
\(\text {BPO}_4\) foam ceramics: Ammonium hydrogen phosphate and boric acid (molar ratio 1.05:1) were ground with corundum balls, calcined at \(900^{\circ }\)C, cooled, crushed, and sieved. The powder was mixed with DA, TA, and deionized water in a planetary ball mill. FA and gelatin solution were added, and the mixture was frozen at \(-42^{\circ }\)C, dried, and sintered at 1223K to produce \(\text {BPO}_4\) foam ceramics44. Microstructures were categorized into 15 classes, each with 1 image.
-
(3)
\(4\text {Bi}_2\text {O}_3 \cdot x\text {B}_2\text {O}_3\) composite: Bismuth oxide and boric acid (molar ratio 4:2.5-4) were heated to \(500^{\circ }\)C and ground to obtain ceramic powder. This was mixed with deionized water, WSM-R, and CMC, soaked with a polyurethane foam sponge, dried at \(80^{\circ }\)C, and calcined at \(600^{\circ }\)C. Treated epoxy resin and powder were vacuum infused to produce the \(4\text {Bi}_2\text {O}_3 \cdot x\text {B}_2\text {O}_3\) composite45. Microstructures were categorized into 4 classes, each with 1 image.
-
(4)
\(\text {Bi}_6\text {B}_{10+2x}\text {O}_{24+3x}\) ceramics: Bismuth oxide and boric acid (molar ratio 3:3-3:7) were mixed with \(\text {ZrO}_2\) as the grinding media and sodium carboxymethyl cellulose as the binder. The mixture was shaped at 50 MPa and heated to \(450^{\circ }\)C\(-650^{\circ }\)C to produce \(\text {Bi}_6\text {B}_{10+2x}\text {O}_{24+3x}\) (x=-2, -1, 0, 1, 2) ceramics46. Microstructures were categorized into 5 classes, each with 1 image.
-
(5)
\(\text {Mg}_2\text {B}_2\text {O}_5 + \text {MgB}_4\text {O}_7\) foam ceramics: Magnesium oxide and boric acid (molar ratio 1:1.5) were ground with a planetary ball mill and heated to \(700^{\circ }\)C. The sintered powder was wet milled, dried, and sieved before adding a gel solution. The ceramic slurry was prepared by mixing the powder, DA, TA, and deionized water, followed by FA and BA. The mixture was dried and heated to \(900^{\circ }\)C to produce \(\text {Mg}_2\text {B}_2\text {O}_5 + \text {MgB}_4\text {O}_7\) foam ceramics47. Microstructures were categorized into 16 classes, with a total of 62 images.
-
(6)
MgO-C refractory materials: Magnesium oxide fine powder, phenolic resin powder, metallic aluminum powder, and boron carbide powder were mixed. Coated magnesium oxide granules were mixed with flake graphite and the blended powder. Brick samples were formed, cured at \(200^{\circ }\)C, and heat-treated at \(1000^{\circ }\)C to obtain MgO-C refractory materials48. Microstructures were categorized into 1 class with a total of 4 images.
The above description outlines the preparation methods for materials produced with different raw material ratios and process conditions, each with unique microstructures and properties. During the initial research phase, the author and collaborators accumulated significant knowledge and data on foam ceramic micrographs. The varied materials exhibit unique microstructures and properties, supported by a substantial corpus of foam ceramics micrograph data accumulated by the authors and colleagues43,44,45,46,47,48.
Dataset division
This study involved six refractory materials, including five foam ceramics and one magnesia-carbon refractory, each exhibiting unique microstructures influenced by different additives and formulation ratios. Detailed microstructure insights were obtained through scanning electron microscopy (SEM), with all relevant images presented in Fig. 2.
For structure recognition, the dataset was organized as follows:
-
(1)
The \(\mathrm Mg_2B_2O_5\) + \(\mathrm MgB_4O_7\) materials were classified into 16 categories based on additive ratios, with five SEM images randomly captured from each class. One to three images per class were selected as positive examples, resulting in 41 images. Additionally, 37 images from four other foam ceramic series were included, totaling 78 true example images for recognition. To introduce complexity, microstructure images from magnesia-carbon refractories were randomly mixed into each foam ceramic data type, ensuring representation of both categories across all divisions. This resulted in five series totaling 49 classes.
-
(2)
The 49 categories were split into training and validation sets in a 9:1 ratio, while images not used in the previous step were reserved for a separate test set. This division helps ensure the model’s generalization capabilities and effective learning on complex datasets with noise.
Overall, this approach enhances dataset diversity and complexity, integrating magnesia-carbon refractory material noise into foam ceramic data, thereby improving the robustness and accuracy of the structural prediction algorithm.
microstructure image processing
To prepare high-resolution SEM images for microstructure prediction, preprocessing is essential. The images of foam ceramics and magnesia-carbon refractories from 49 categories are segmented into 224\(\times\)224 pixel blocks, with a cropping step size also set to 224 pixels to avoid overlap49,50. This method decomposes each image into non-overlapping patches, allowing them to be used independently for training, thus enhancing training efficiency and model performance.
To further diversify the dataset, various data augmentation operations were applied to the cropped image patches. Each 224\(\times\)224 pixel patch underwent \(90^{\circ }\), \(180^{\circ }\), and \(270^{\circ }\) rotations, vertical flips, and mix up techniques, resulting in six augmented images per original patch. This approach maintains the distribution characteristics of the original SEM images while significantly increasing dataset diversity and scale, enhancing the model’s generalization to different microstructures.
As a result, the training and validation sets contained a total of 24,453 augmented images across 49 categories. Additionally, the test set includes 11 original unsegmented microstructure images of \(\mathrm Mg_2B_2O_5\)+\(\mathrm MgB_4O_7\). Table 1 presents the formulation ratios of five types of foam ceramics, along with a total of 49 categories and 24,147 microstructure images that have been cut and enhanced (excluding the microstructure images of magnesia-carbon refractory materials).
Experimental and discussion
This chapter analyzes the application of the FD-Conv model in processing microstructure images of foam ceramics, focusing on its advantages in feature extraction, generalization, and prediction accuracy. Compared to other advanced deep learning models, the FD-Conv model shows higher efficiency and accuracy in both training and validation sets. It effectively leverages data diversity to enhance generalization and feature extraction when dealing with multi-source microstructure images.
Multi-source microstructure image analysis
This section demonstrates the FD-Conv model’s prediction process using multi-source microstructure images. Training begins with \(\mathrm Bi_4B_2O_9\) foam ceramics data, followed by the addition of \(\mathrm 4Bi_2O_3\) \(\cdot\) \(\mathrm xB_2O_3\) composite material data, and finally \(\mathrm BPO_4\) foam ceramics data. Model accuracy is assessed only on the training set, with results illustrated in Fig. 3. When using a single category of images, the model shows higher error: MAE for loss and accuracy are 0.8333 and 0.4444, respectively. When using images from all three categories, the model achieves the highest accuracy, with an MAE of 0.7037. Precision refers to the probability of actual positive samples among all samples predicted as positive. Recall refers to the probability of samples predicted as positive among all actual positive samples. The F1 score simultaneously considers both precision and recall, and its formula is \(\frac{2}{F_1}=\frac{1}{Precision}+\frac{1}{Recall}\). Top1_Acc indicates the accuracy of the model when the label with the highest predicted score matches the true label. Top5_Acc indicates the accuracy when the label ranked fifth in predicted scores includes the true label. MAE stands for Mean Absolute Error. Ave_loss refers to the average loss value calculated during each iteration of the training process in machine learning or deep learning. R@k is a metric used to measure the model’s ability to find relevant items among the top k retrieval results.

The addition of microscopic structure images of \(\mathrm Bi_4B_2O_9\), \(\mathrm 4Bi_2O_3\) \(\cdot\) \(\mathrm xB_2O_3\), and \(\mathrm BPO_4\). As the diversity and quantity of multi-source microscopic structure image data increase, the FD-Conv model enhances its generalization capability by learning a broader range of features and patterns, reduces overfitting, and improves recognition accuracy through more thorough training iterations.
The FD-Conv model’s ability to analyze multi-source microstructure images improves with increased data, enhancing prediction accuracy. This improvement is evident in both the \(\mathrm BPO_4\) foam ceramics data and the initial \(\mathrm Bi_4B_2O_9\) foam ceramics data after adding \(\mathrm BPO_4\) data.
Increasing recognition accuracy with more diverse training sets can be explained by:
-
(1)
Enhanced generalization: More data allows the model to learn a greater variety of features and patterns, reducing overfitting and improving generalization. With only \(\mathrm Bi_4B_2O_9\) data, the model may overfit to specific characteristics, leading to misidentification with slight variations. Adding \(\mathrm 4Bi_2O_3\) \(\cdot\) \(\mathrm xB_2O_3\) data improves feature learning and prediction accuracy, which further increases with additional \(\mathrm BPO_4\) data.
-
(2)
Shared features: Different materials may share microstructure features. A more comprehensive dataset allows the model to identify and utilize these shared features, improving predictive abilities. For instance, learning analogous features between \(\mathrm Bi_4B_2O_9\) and \(\mathrm 4Bi_2O_3\) \(\cdot\) \(\mathrm xB_2O_3\) enhances classification accuracy, which further improves with \(\mathrm BPO_4\) data.
-
(3)
More iterations: Additional data allows for more training iterations, facilitating better parameter adjustment and recognition performance. As data increases from 876 \(\mathrm Bi_4B_2O_9\) images to 1670 with \(\mathrm 4Bi_2O_3\) \(\cdot\) \(\mathrm xB_2O_3\) and 3141 with \(\mathrm BPO_4\), the model undergoes more parameter updates, gradually enhancing predictive capabilities and accuracy.
The three categories of microstructure images have varying features. \(\mathrm Bi_4B_2O_9\), \(\mathrm 4Bi_2O_3\) \(\cdot\) \(\mathrm xB_2O_3\), and \(\mathrm BPO_4\) microstructure data were captured at scales of 500, 50, and 100 micrometers, respectively.
At 500 micrometers, \(\mathrm Bi_4B_2O_9\) data shows large particle agglomeration, significant pore distribution, and large-scale surface roughness. The model learns large-scale features, but may miss subtle structural changes, reducing accuracy for smaller scales.
At 50 micrometers, finer structural textures such as smaller particles and subtle particle boundaries in \(\mathrm 4Bi_2O_3\) \(\cdot\) \(\mathrm xB_2O_3\) are observable. Introducing this data enhances the model’s ability to recognize fine features, improving overall accuracy.
At 100 micrometers, medium-scale structural features in \(\mathrm BPO_4\) data exhibit both irregular pore structures and periodic crystalline shapes. Including \(\mathrm BPO_4\) data helps the model discern features at this scale, enhancing generalization and prediction accuracy.
The combined feature information from multiple scales allows the model to better understand foam ceramics’ microstructures, enhancing generalization capabilities, reducing overfitting, and increasing classification accuracy. Cross-material learning from different scales enriches the model’s feature space, significantly reducing blind spots in structural changes.
Frequency domain block effect
This section discusses the impact of the Frequency Domain Block in the FD-Conv model on predicting foam ceramics microstructure images. Incorporating a Frequency Domain Block in the FD-Conv model offers several advantages:
-
(1)
Combination of Frequency and Time Domains: The FD-Conv model integrates time-domain convolution with frequency-domain high-pass filtering, allowing the extraction of both spatial and frequency features. This enhances the capture and understanding of complex structural features in foam ceramic microstructure images.
-
(2)
Frequency Domain Processing Capability: By employing fast Fourier transforms and high-pass filters, the Frequency Domain Block processes information effectively within the frequency domain. This is crucial for capturing high-frequency details such as small pores and cracks, which are essential for evaluating material performance.
-
(3)
Suppression of Noise and Background Interference: The frequency domain processing capabilities of FD-Conv help suppress noise and background interference through filtering operations, enhancing feature purity and improving model robustness and prediction performance.
The FD-Conv model’s ability to combine and process frequency and time domains enables accurate and comprehensive microstructure prediction and analysis. These design features improve the model’s performance on metrics such as R@1, precision, and F1 score. The Fourier transform images in Fig. 4 show original microstructure images processed through Fourier transform, semantic segmentation, and inverse color processing, facilitating the analysis of symmetry, ring structure, and frequency components. Figure 4a–h show images successfully predicted by the FD-Conv model, while Fig. 4i–j depict unsuccessfully predicted images.
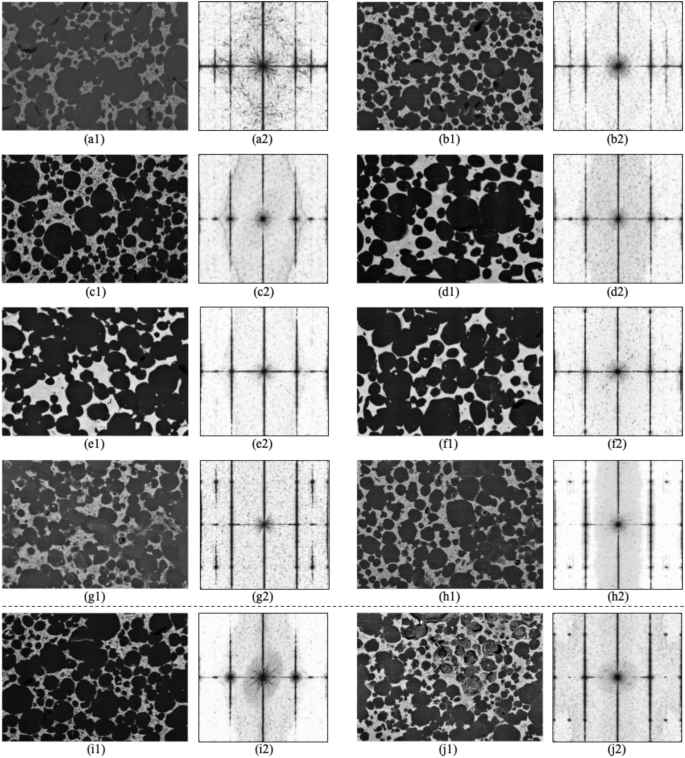
The Fourier Transform spectra shown the symmetry and ring structure characteristics of the microstructure images. Images with simpler structures have a higher prediction success rate, while those with more complex structures are more difficult to predict. This indicates that the FD-Conv model has limitations in handling more complex periodic structures and high frequency components.
The spectrograms exhibit symmetry, indicating standardized experimental operations. Figure 4a–h have simpler structures with central ring diffusion of approximately three layers, while Fig. 4i,j show more complex structures with four layers of central ring diffusion. The complexity in Fig. 4i suggests difficulties in learning average distance patterns between larger pores. No significant patterns were found in low and high-frequency components, indicating possible limitations in processing different frequency components. The brightness of images, unrelated to pore structure, is due to the shooting method.
From the prediction results, it is clear that when TA=0, the FD-Conv model struggles to accurately predict unseen \(\mathrm Mg_2B_2O_5\)+\(\mathrm MgB_4O_7\) foam ceramic microstructure images when FA=0.4. However, for other parameter changes, the model successfully makes predictions on both validation and test sets, suggesting good overall predictive capabilities with some limitations under specific parameter combinations.
Visual analysis of microstructures
The FD-Conv model employs four Blocks that enhance its interpretability through visualization analysis of foam ceramics microstructure images.
The generation of heatmaps in the convolutional layers reveals the areas of focus for the model during image recognition51. These heatmaps highlight the contribution of various regions to the model’s decision-making, effectively identifying critical areas during the learning process.
With Block depths set to [3, 3, 9, 3], Fig. 5 illustrates the heatmaps from each Block. Areas in deeper red indicate higher importance in the model’s predictions, while yellow areas receive secondary attention, and blue areas show low influence. Warm tones signify high attention zones, while cool tones indicate less relevant information.
Analysis of the heatmaps reveals that the first Block focuses on global information and low-level features. As the depth increases, the model begins to concentrate on more complex structures, such as grain shape, size, and pore distribution. The heatmap from the third Block emphasizes grains and pores, validating the model’s ability to identify these key features. If attention shifts to irrelevant areas, it suggests a need for optimization.
The most significant change occurs between the second and third Blocks, attributed to the third Block’s depth of nine layers. The heatmaps of the first, seventh, and eighth layers in this Block show substantial alterations, indicating significant feature extraction progress. The initial layers focus on fundamental features like edges and textures, while later layers recognize complex patterns such as grain arrangement and pore distribution. The heatmaps of the third Block’s 8 layers are shown in Fig. 6.
These modifications in heatmaps reflect the model’s learning progression from basic feature extraction to intricate feature recognition and integration. This systematic approach is crucial for the FD-Conv model’s understanding and analysis of complex microstructure images. Analyzing heatmaps provides insights into the learning mechanisms of the FD-Conv model, aiding in the optimization of its design and training strategies.

By observing the heatmaps of four Blocks, it can be seen that as depth increases, the model gradually shifts its attention from global information to identifying key features in the image, such as grains and pores, indicating that the model is effectively learning and focusing on areas that have a significant impact on the prediction results.

By observing the heatmaps of four Blocks, it can be seen that as depth increases, the model gradually shifts its attention from global information to identifying key features in the image, such as grains and pores, indicating that the model is effectively learning and focusing on areas that have a significant impact on the prediction results.
Comparison of different models on training and validation sets
This section compares the FD-Conv model with the latest SOTA methods, including EfficientNetV252, ViT53, MobileViT54, ConvNeXt40, and Swin Transformer55, in predicting the microstructures of foam ceramics.
The batch size for each model is set to 64, and all models are run on a 24-core AMD EPYC 7642 48-Core Processor with 80GB of RAM. After training for 200 epochs on an RTX 3090, the training and validation accuracy and loss are shown in Fig. 7. The following observations are made:
-
(1)
Feature Extraction Capability: The FD-Conv model outperforms other models on the training set, showing faster convergence and lower final loss values. This suggests that FD-Conv is particularly adept at extracting key features from foam ceramics microstructures, such as grain size, shape, and pore distribution, which are crucial for material performance evaluation.
-
(2)
Generalization Ability: Performance fluctuations on the validation set are observed across all models, likely due to the limited validation data. Although ConvNeXt performs slightly better in some instances, FD-Conv shows superior efficiency. While EfficientNetV2 and MobileViT have lower time consumption, FD-Conv achieves better overall metrics.
-
(3)
Model Complexity and Adaptivity: FD-Conv demonstrates better generalization, potentially due to a more complex network structure and training strategies. The dataset is enhanced with various operations like rotation and flipping, increasing diversity and complexity. FD-Conv’s ability to handle and recognize transformed image features contributes to its superior performance. However, this complexity also leads to higher computational costs and time consumption compared to ConvNeXt.

FD-Conv model demonstrates outstanding performance in testing with new \(\mathrm Mg_2B_2O_5\)+\(\mathrm MgB_4O_7\) foam ceramic microstructure images, achieving the highest R@1 value and F1 score among all models, indicating its efficient recognition capability and low false positive rate in predicting the microstructure of porous refractory materials.
Comparison of different models on the test set
To assess the FD-Conv model’s scalability, a new set of \(\mathrm Mg_2B_2O_5\)+\(\mathrm MgB_4O_7\) foam ceramic microstructure images is used for testing. These images are not included in the experimental data of previous section and extend beyond the original database.
The FD-Conv model’s performance in handling complex microstructure data is compared to SOTA algorithms such as RegNet30, EfficientNetV252, ViT53, MobileViT54, ConvNeXt40, and Swin Transformer55. Metrics such as prediction accuracy, recall, precision, and F1 score are used for evaluation.
Experimental results indicate the FD-Conv model’s superiority. It achieves an R@1 value of 81.8%, the highest among all models, indicating its ability to comprehensively identify the proportion of positive instances. The FD-Conv model also attains an F1 score of 78.8%, the highest among all models, reflecting its balanced precision and recall. Although its precision of 77.3% is slightly lower than ConvNeXt’s 79.5%, it still demonstrates high accuracy with fewer false positives, which are shown in Fig. 8a.

(a) FD-Conv model demonstrates outstanding performance in testing with new \(\mathrm Mg_2B_2O_5\)+\(\mathrm MgB_4O_7\) foam ceramic microstructure images, achieving the highest R@1 value and F1 score among all models, indicating its efficient recognition capability and low false positive rate in predicting the microstructure of materials. (b) The experiment by adjusting the depth of the Blocks shows that increasing the depth can improve the prediction performance and feature extraction ability of the model, but it is necessary to balance the feature extraction depth and the generalization ability of the model to avoid overfitting.
Number of different blocks
This section investigates how varying the number of Blocks in the FD-Conv model affects the prediction performance for foam ceramics microstructure images.
The original FD-Conv model uses Block depths of [3, 3, 9, 3]. To optimize performance, configurations were adjusted to [1, 1, 3, 1], [2, 2, 4, 2], and [2, 2, 8, 2]. Results for R@1, F1 score, and precision are shown in Fig. 8b.
In this section, we set the depths of the Blocks to [1, 1, 3, 1], [2, 2, 4, 2], [2, 2, 8, 2], and [3, 3, 9, 3]. The results for R@1, F1 score, and precision are illustrated in Fig. 8. The shallow structure with depths of [1, 1, 3, 1] produced R@1 at 74.2%, an F1 Score of 69.6%, and Precision at 73.1%. These results indicate that the model struggled to capture the complex features of foam ceramics. When the depths were increased to [2, 2, 4, 2], performance improved, achieving R@1 at 77.3%, an F1 Score of 73.9%, and Precision at 74.2%, but it still did not meet the demands of complex structures. Increasing the depth to [2, 2, 8, 2] enabled deeper feature extraction, resulting in R@1 rising to 81.8%, the F1 Score increasing to 76.2%, and a slight drop in Precision to 72.8%. This suggests that while the model improved its pattern recognition, it also experienced a higher rate of false positives. Finally, with depths set to [3, 3, 9, 3], R@1 remained at 81.8%, but the F1 Score rose to 78.8% and Precision increased to 77.3%. This indicates an enhanced ability of the model to identify microstructure features and suggests an optimal balance between effective feature extraction and maintaining generalizability.
Increasing the depth of the Blocks generally enhances prediction performance, particularly in F1 score and precision. However, excessive depth could lead to overfitting, demonstrating the need for a balance between feature extraction and generalization. Key advantages of the FD-Conv model include:
-
(1)
Feature Extraction Efficiency. Utilizing depth-wise separable and point-wise convolutions allows effective identification of various microstructure features at a lower computational cost.
-
(2)
Multi-Level Feature Fusion. Integration of features from different levels improves the model’s understanding of structural characteristics, enhancing accuracy.
-
(3)
DropPath Regularization. This technique prevents overfitting by randomly dropping network paths during training, improving generalization across diverse foam ceramics microstructures.
Overall, the FD-Conv model demonstrates strong feature recognition, depth of analysis, and generalization performance in predicting foam ceramics microstructures.
Conclusion
This paper presents the FD-Conv model, a novel approach for effectively identifying the complex microstructures of foam ceramics. By integrating strengths of transformer architecture with CNN and introducing a frequency domain block, the model enhances its capacity to capture intricate microstructure details. Experimental validation on a diverse dataset of foam ceramic images demonstrates the model’s performance in identifying and predicting microstructure features.
-
(1)
Contribution of Multi-Source Microstructure Images. By increasing the quantity and variety of images, the model learns richer features, improving generalization. Incorporating data across different materials allows the model to recognize common features, enhancing predictive capabilities. The range of microstructure data from 50 to 500 microns enables comprehensive learning of various structural textures, addressing distributional blind spots across scales.
-
(2)
Construction of a Universal Prediction Framework. The FD-Conv model leverages the strengths of transformers for long-range dependencies and CNNs for local feature extraction. The frequency domain analysis allows for precise capture of subtle microstructure features, such as small pores and cracks, which are critical for accurate predictions.
Despite its successes, future research should focus on enhancing the model’s generalization capabilities for a broader range of material types and complex microstructures. Future research could explore the initialization of the FD-Conv model for analyzing complex materials beyond foam ceramics, potentially expanding its applications in materials science and engineering. Additionally, exploring the relationship between material microstructure and performance will provide deeper insights into material behavior.
Data availability
The datasets used and/or analysed during the current study available from the corresponding author on reasonable request. All other data supporting the main conclusions of this study can be found in the main text.
References
Pokhrel, A., Seo, D. N., Lee, S. T. & Kim, I. J. Processing of porous ceramics by direct foaming: a review. J. Korean Ceram. Soc. 50, 93–102. https://doi.org/10.4191/kcers.2013.50.2.093 (2013).
Li, X. et al. Preparation, microstructure, properties and foaming mechanism of a foamed ceramics with high closed porosity. Ceram. Int. 45, 11982–11988. https://doi.org/10.1016/j.ceramint.2019.03.091 (2019).
Chan, C. H., Sun, M. & Huang, B. Application of machine learning for advanced material prediction and design. EcoMat 4, e12194. https://doi.org/10.1002/eom2.12194 (2022).
Klenam, D. et al. Data science and material informatics in physical metallurgy and material science: An overview of milestones and limitations. Results Mater.[SPACE]https://doi.org/10.1016/j.rinma.2023.100455 (2023).
Yamasaki, S., Yaji, K. & Fujita, K. Data-driven topology design using a deep generative model. Struct. Multidiscip. Optim. 64, 1401–1420. https://doi.org/10.1007/s00158-021-02926-y (2021).
Sun, X. et al. Data integration for accelerated materials design via preference learning. New J. Phys. 22, 055001. https://doi.org/10.1088/1367-2630/ab82b9 (2020).
Fang, J. et al. Machine learning accelerates the materials discovery. Mater. Today Commun. 33, 104900. https://doi.org/10.1016/j.actamat.2021.117434 (2022).
Wang, Y., Arns, C. H., Rahman, S. S. & Arns, J.-Y. Porous structure reconstruction using convolutional neural networks. Math. Geosci. 50, 781–799. https://doi.org/10.1007/s11004-018-9743-0 (2018).
Zhao, Y. et al. Characterization of porous membranes using artificial neural networks. Acta Mater. 253, 118922. https://doi.org/10.1016/j.actamat.2023.118922 (2023).
Tate, J., Aguiar, J., Gong, M. & Tasdizen, T. High throughput crystal structure classification. Microsc. Microanal. 26, 10–12. https://doi.org/10.1017/S1431927620013100 (2020).
Sheiati, S., Behboodi, S. & Ranjbar, N. Segmentation of backscattered electron images of geopolymers using convolutional autoencoder network. Expert Syst. Appl. 206, 117846. https://doi.org/10.1016/j.eswa.2022.117846 (2022).
Sheiati, S., Nguyen, H., Kinnunen, P. & Ranjbar, N. Cementitious phase quantification using deep learning. Cem. Concr. Res. 172, 107231. https://doi.org/10.1016/j.cemconres.2023.107231 (2023).
Feng, S., Zhou, H. & Dong, H. Using deep neural network with small dataset to predict material defects. Mater. Des. 162, 300–310. https://doi.org/10.1016/j.matdes.2018.11.060 (2019).
Frydrych, K. et al. Materials informatics for mechanical deformation: A review of applications and challenges. Materials 14, 5764. https://doi.org/10.3390/ma14195764 (2021).
Wang, H. et al. State-of-the-art review of high-throughput statistical spatial-mapping characterization technology and its applications. Engineering 6, 621–636. https://doi.org/10.1016/j.eng.2020.05.005 (2020).
Thoppil, G. S., Nie, J.-F. & Alankar, A. Bayesian approach for inferrable machine learning models of process-structure-property linkages in complex concentrated alloys. J. Alloy. Compd. 967, 171595. https://doi.org/10.1016/j.jallcom.2023.171595 (2023).
Herriott, C. & Spear, A. D. Predicting microstructure-dependent mechanical properties in additively manufactured metals with machine-and deep-learning methods. Comput. Mater. Sci. 175, 109599. https://doi.org/10.1016/j.commatsci.2020.109599 (2020).
Zhu, L., Zhou, J. & Sun, Z. Materials data toward machine learning: advances and challenges. J. Phys. Chem. Lett. 13, 3965–3977. https://doi.org/10.1021/acs.jpclett.2c00576 (2022).
Wang, C., Wei, X., Ren, D., Wang, X. & Xu, W. High-throughput map design of creep life in low-alloy steels by integrating machine learning with a genetic algorithm. Mater. Des. 213, 110326. https://doi.org/10.1016/j.matdes.2021.110326 (2022).
Bansal, A. et al. Accelerated design of high entropy alloys by integrating high throughput calculation and machine learning. J. Alloy. Compd. 960, 170543. https://doi.org/10.1016/j.jallcom.2023.170543 (2023).
Li, X. et al. Predicting the effective mechanical property of heterogeneous materials by image based modeling and deep learning. Comput. Methods Appl. Mech. Eng. 347, 735–753. https://doi.org/10.1016/j.cma.2019.01.005 (2019).
Kunselman, C., Sheikh, S., Mikkelsen, M., Attari, V. & Arróyave, R. Microstructure classification in the unsupervised context. Acta Mater. 223, 117434 (2022).
Kailkhura, B., Gallagher, B., Kim, S., Hiszpanski, A. & Han, T.Y.-J. Reliable and explainable machine-learning methods for accelerated material discovery. NPJ Comput. Mater. 5, 108. https://doi.org/10.48550/arXiv.1901.02717 (2019).
Lu, W., Xiao, R., Yang, J., Li, H. & Zhang, W. Data mining-aided materials discovery and optimization. J. Materiom. 3, 191–201. https://doi.org/10.1016/j.jmat.2017.08.003 (2017).
XIE, J. et al. Machine learning for materials research and development. Acta Metall. Sin. 57, 1343–1361. https://doi.org/10.11900/0412.1961.2021.00357 (2021).
Ren, D., Wang, C., Wei, X., Lai, Q. & Xu, W. Building a quantitative composition-microstructure-property relationship of dual-phase steels via multimodal data mining. Acta Mater. 252, 118954. https://doi.org/10.1016/j.actamat.2023.118954 (2023).
Vaswani, A. et al. (2017) Attention is all you need. Adv. Neural Inf. Process. Syst. doi: https://doi.org/10.48550/arXiv.1706.03762
Parmar, N. et al. Image transformer. In International conference on machine learning, 4055–4064 (PMLR, 2018).
Yin, Y. et al. Research on image restoration of bi4b2o9 porous foam ceramics media using transformer architecture. Mater. Today Commun.[SPACE]https://doi.org/10.1016/j.mtcomm.2024.109329 (2024).
Radosavovic, I., Kosaraju, R. P., Girshick, R., He, K. & Dollár, P. Designing network design spaces. In Proc. of the IEEE/CVF conference on computer vision and pattern recognition, 10428–10436, https://doi.org/10.48550/arXiv.1802.05751 (2020).
Zdravkov, B. et al. Pore classification in the characterization of porous materials: A perspective. Open Chem. 5, 385–395. https://doi.org/10.2478/s11532-007-0017-9 (2007).
Da Wang, Y., Blunt, M. J., Armstrong, R. T. & Mostaghimi, P. Deep learning in pore scale imaging and modeling. Earth Sci. Rev. 215, 103555. https://doi.org/10.1016/j.earscirev.2021.103555 (2021).
Zhang, H. et al. Analyzing the pore structure of pervious concrete based on the deep learning framework of mask r-cnn. Constr. Build. Mater. 318, 125987. https://doi.org/10.1016/j.conbuildmat.2021.125987 (2022).
Khan, M., Alam, M., Masud, M. & Amin, A. Importance of high order high pass and low pass filters. World Appl. Sci. J. 34, 1261–1268. https://doi.org/10.5829/idosi.wasj.2016.1261.1268 (2016).
Takano, N., Zako, M., Kubo, F. & Kimura, K. Microstructure-based stress analysis and evaluation for porous ceramics by homogenization method with digital image-based modeling. Int. J. Solids Struct. 40, 1225–1242. https://doi.org/10.1016/S0020-7683(02)00642-X (2003).
Prill, T. & Schladitz, K. Simulation of fib-sem images for analysis of porous microstructures. Scanning 35, 189–195. https://doi.org/10.1002/sca.21047 (2013).
Ali, M. S. et al. Preparation and characterization of porous alumina ceramics using different pore agents. J. Ceram. Soc. Jpn. 125, 402–412. https://doi.org/10.2109/jcersj2.16233 (2017).
Hren, J. Introduction to Analytical Electron Microscopy (Springer Science & Business Media, 2013).
Patro, B. N., Namboodiri, V. P. & Agneeswaran, V. S. Spectformer: Frequency and attention is what you need in a vision transformer. Preprint at arXiv:2304.06446https://doi.org/10.48550/arXiv.2304.06446 (2023).
Liu, Z. et al. A convnet for the 2020s. In Proc. of the IEEE/CVF conference on computer vision and pattern recognition, 11976–11986, https://doi.org/10.48550/arXiv.2201.03545 (2022).
Zakutayev, A. et al. An open experimental database for exploring inorganic materials. Sci. Data 5, 1–12. https://doi.org/10.1038/sdata.2018.53 (2018).
Zhang, Y. & Ling, C. A strategy to apply machine learning to small datasets in materials science. NPJ Comput. Mater. 4, 25. https://doi.org/10.1038/s41524-018-0081-z (2018).
Chen, P. et al. Controlled structure preparation of low thermal conductivity bi4b2o9 foams. Int. J. Appl. Ceram. Technol. 20, 2412–2421. https://doi.org/10.1111/ijac.14352 (2023).
Li, X. et al. Fabrication of novel bpo4 ceramic foams using the combination of the direct foaming method and freeze-drying techniques. Int. J. Appl. Ceram. Technol. 20, 3565–3575. https://doi.org/10.1111/ijac.14456 (2023).
Chen, P. et al. New design of bismuth borate ceramic/epoxy composites with excellent fracture toughness and radiation shielding capabilities. Mater. Today Commun. 35, 106102. https://doi.org/10.1016/j.mtcomm.2023.106102 (2023).
Chen, P. et al. Thermally insulating bi6b10+ 2 x o24+ 3 x (x=- 2,- 1, 0, 1, 2) ceramics with neutron/gamma shielding capability. J. Aust. Ceram. Soc. 59, 291–301. https://doi.org/10.1007/s41779-023-00839-1 (2023).
Liu, J. et al. Thermally insulating magnesium borate foams with controllable structures. Ceram. Int. 48, 25506–25512. https://doi.org/10.1016/j.ceramint.2022.05.229 (2022).
Xu, X. et al. Influence of graphite content on fracture behavior of mgo-c refractories based on wedge splitting test with digital image correlation method and acoustic emission. Ceram. Int. 47, 12742–12752. https://doi.org/10.1016/j.ceramint.2021.01.134 (2021).
Agustsson, E. & Timofte, R. Ntire 2017 challenge on single image super-resolution: Dataset and study. In Proc. of the IEEE Conference on Computer Vision and Pattern Recognition Workshops, 126–135, https://doi.org/10.1109/CVPRW.2017.150 (2017).
Wang, Y., Armstrong, R. & Mostaghimi, P. Diverse super resolution dataset of digital rocks (deeprock-sr): Sandstone, carbonate, and coal. Digital Rocks Portal[SPACE]https://doi.org/10.1029/2019WR026052 (2019).
Selvaraju, R. R. et al. Grad-cam: Visual explanations from deep networks via gradient-based localization. In Proc. of the IEEE international conference on computer vision, 618–626, https://doi.org/10.1007/s11263-019-01228-7 (2017).
Tan, M. & Le, Q. Efficientnetv2: Smaller models and faster training. In International conference on machine learning, 10096–10106, https://doi.org/10.48550/arXiv.2104.00298 (PMLR, 2021).
Dosovitskiy, A. et al. An image is worth 16x16 words: Transformers for image recognition at scale. Preprint at arXiv:2010.11929https://doi.org/10.48550/arXiv.2010.11929 (2020).
Mehta, S. & Rastegari, M. Mobilevit: light-weight, general-purpose, and mobile-friendly vision transformer. Preprint at arXiv:2110.02178https://doi.org/10.48550/arXiv.2110.02178 (2021).
Liu, Z. et al. Swin transformer: Hierarchical vision transformer using shifted windows. In Proc. of the IEEE/CVF International Conference on Computer Vision, 10012–10022, https://doi.org/10.48550/arXiv.2103.14030 (2021).
Acknowledgements
This work was supported by the Open Fund of the State Key Laboratory of Refractories and Metallurgy, China (Wuhan University of Science and Technology) (Project No. G202410), and the National Natural Science Foundation of China (Project No. 62376201).
Author information
Authors and Affiliations
Contributions
All authors contributed to the study conception and design. Funding acquisition, project administration and review were performed by X.X. Validation, methodology and the first draft of the manuscript was written by Y.Y. Software and validation were performed by J.W.P. Formal analysis and conceptualization were performed by F.W. Material preparation, data collection and analysis were performed by P.H.L and Z.C. All authors commented on previous versions of the manuscript. All authors read and approved the final manuscript.
Corresponding author
Ethics declarations
Competing interests
The authors declare no competing interests.
Additional information
Publisher’s note
Springer Nature remains neutral with regard to jurisdictional claims in published maps and institutional affiliations.
Rights and permissions
Open Access This article is licensed under a Creative Commons Attribution-NonCommercial-NoDerivatives 4.0 International License, which permits any non-commercial use, sharing, distribution and reproduction in any medium or format, as long as you give appropriate credit to the original author(s) and the source, provide a link to the Creative Commons licence, and indicate if you modified the licensed material. You do not have permission under this licence to share adapted material derived from this article or parts of it. The images or other third party material in this article are included in the article’s Creative Commons licence, unless indicated otherwise in a credit line to the material. If material is not included in the article’s Creative Commons licence and your intended use is not permitted by statutory regulation or exceeds the permitted use, you will need to obtain permission directly from the copyright holder. To view a copy of this licence, visit http://creativecommons.org/licenses/by-nc-nd/4.0/.
About this article

Cite this article
Yin, Y., Pan, J., Wang, F. et al. Research on multi-source microstructure image recognition of foam ceramics using convolutional network combine with frequency domain. Sci Rep 15, 3032 (2025). https://doi.org/10.1038/s41598-025-87305-z
Received:
Accepted:
Published:
Version of record:
DOI: https://doi.org/10.1038/s41598-025-87305-z
