
Abstract
The healthcare sector is experiencing a digital transformation propelled by the Internet of Medical Things (IOMT), real-time patient monitoring, robotic surgery, Electronic Health Records (EHR), medical imaging, and wearable technologies. This proliferation of digital tools generates vast quantities of healthcare data. Efficient and timely analysis of this data is critical for enhancing patient outcomes and optimizing care delivery. Real-time processing of Healthcare Big Data (HBD) offers significant potential for improved diagnostics, continuous monitoring, and effective surgical interventions. However, conventional cloud-based processing systems face challenges due to the sheer volume and time-sensitive nature of this data. The migration of large datasets to centralized cloud infrastructures often results in latency, which impedes real-time applications. Furthermore, network congestion exacerbates these challenges, delaying access to vital insights necessary for informed decision-making. Such limitations hinder healthcare professionals from fully leveraging the capabilities of emerging technologies and big data analytics. To mitigate these issues, this paper proposes a Regional Computing (RC) paradigm for the management of HBD. The RC framework establishes strategically positioned regional servers capable of regionally collecting, processing, and storing medical data, thereby reducing dependence on centralized cloud resources, especially during peak usage periods. This innovative approach effectively addresses the constraints of traditional cloud processing, facilitating real-time data analysis at the regional level. Ultimately, it empowers healthcare providers with the timely information required to deliver data-driven, personalized care and optimize treatment strategies.
Introduction
Big data, characterized by its volume, velocity, and variety, is transforming numerous industries, with healthcare being a major driver of this transformation. Volume refers to the massive amount of data generated, velocity highlights the speed at which data is produced and requires real-time processing, and variety encompasses the different formats of data, including text records, medical images, and sensor data1,2. Medical or HBD, as shown in Fig. 1, represents a vast and continuously expanding pool of data comprised of patient records, continuous monitoring data, medical imaging, and more. This data is generated at a high velocity, mirroring the constant interaction of patients with the healthcare system and requiring near real-time analysis for optimal care delivery3. Healthcare data is continuously produced and necessitates rapid analysis for effective treatment. Additionally, healthcare big data exhibits variety, encompassing diverse formats such as text (patient records, diagnoses), numerical data (vital signs, lab test results), images (X-rays, MRIs), and even video recordings (surgical procedures). This diversity reflects the complex and multifaceted nature of medical information within the expansive data landscape4,5. It is estimated that healthcare big data shares 30% of the overall big data6.

Big data in healthcare3.
By 2030, the global big data analytics market is expected to reach $349.56 billion, with healthcare being a significant contributor to this growth7. In the U.S., healthcare’s use of big data analytics is projected to grow by 36% annually through 2025, which could reduce healthcare costs by 8%, translating to over $300 billion in value each year7. A compelling example of big data’s impact on healthcare is Michigan, where post-surgical death rates were reduced by 67% due to big data analytics, illustrating its potential to revolutionize patient outcomes8,9.
However, the rapid expansion of Internet-connected devices, projected to reach 75 billion by 2030, is causing significant strain on public networks, particularly impacting the healthcare sector. Healthcare systems generate massive volumes of data from sources such as EHR, continuous monitoring devices, and medical imaging systems10,11. This data is predominantly processed through cloud-based infrastructures, which are increasingly overwhelmed by the massive volume and the real-time processing demands of HBD12.
As healthcare becomes more reliant on data-driven decision-making, the ability to process and analyze this data in real time is crucial for timely diagnoses, treatment interventions, and patient monitoring. However, transferring large datasets to centralized cloud servers introduces substantial delays, leading to network congestion that disrupts the flow of critical information. These delays can have serious consequences for patient care, where immediate insights are often necessary for life-saving decisions.
Furthermore, network congestion further compounds the problem by limiting healthcare providers’ access to real-time analytics and actionable insights. Current solutions, such as fog and mobile edge computing, offer potential but are often constrained by limited resources and scalability issues, making them unsuitable for the increasing data loads of future healthcare systems.
Addressing these challenges requires a robust, scalable framework that can reduce delays and alleviate network congestion. Such a framework must be capable of efficiently managing the complexities of data-intensive healthcare applications, ensuring that healthcare systems can meet increasing data demands without compromising patient outcomes.
The primary objective of this research is to introduce and evaluate the effectiveness of RC as a scalable solution to address the critical challenges posed by the massive volume and real-time demands of healthcare data-driven applications. Traditional cloud-based processing proves inadequate due to network congestion and latency issues, hindering the timely delivery of critical insights required for patient care.
This study assesses, as shown in Fig. 2, how RC, by utilizing strategically positioned regional servers, mitigates these limitations by enabling localized collection, processing, and storage of healthcare data. The research evaluates the ability of RC to reduce latency, alleviate network congestion, and support real-time data analysis, essential for healthcare providers to deliver personalized care and optimize treatment strategies. Additionally, the study explores how RC enhances real-time monitoring, improves decision-making, and contributes to a more efficient and responsive healthcare system. By focusing on RC, this research contributes to the development of a resilient, low-latency infrastructure that meets the growing data demands of healthcare applications.

Proposed structure of regional computing for healthcare big data.
This paper introduces a novel framework for managing HBD through the implementation of RC in the context of data generated by medical equipment, such as IOMT devices. The key contributions of this research are as follows:
-
1.
This framework proposes the initial processing and storage of medical data at regional servers, which are strategically located to minimize delays. By processing data closer to its source, the framework enhances the speed and efficiency of data handling, crucial for real-time healthcare applications.
-
2.
The system includes a dynamic offloading mechanism that monitors the performance. If the regional server’s performance exceeds that of the cloud, particularly during peak hours, the data is automatically sent to the cloud. This ensures optimal resource utilization and timely access to critical healthcare information.
-
3.
The framework leverages the scalability of regional computing, offering resource capabilities near to the cloud while maintaining the efficiency of edge-level proximity. Regional servers, strategically deployed, provide near-cloud computational power, enabling efficient handling of medical big data.
The rest of the paper is organized as follows.
Section “Background” presents a review of literature and projects related to healthcare big data and data offloading. Section “Proposed methodology” details the proposed methodology, addressing limitations in existing approaches. Section “Evaluation” evaluates the proposed methodology through prototyping and experimentation. Section “Discussion” analyzes the roles of regional and cloud computing in healthcare big data, highlighting the advantages of regional computing over cloud solutions. Finally, Section “Conclusion” provides the study’s conclusions.
Background
The background is divided into two sections. The first section focuses on the sensors and devices currently employed in medical centers, while the second section addresses the techniques used for big data offloading in the market and literature.
Internet of medical things
The IOMT, as shown in Fig. 3, is transforming healthcare by interconnecting medical devices and sensors, enabling continuous health monitoring and data collection13. This massive amount of data, referred to as HBD, holds promise for improving healthcare delivery through personalized treatment plans, early diagnostics, and predictive analytics. However, the unprecedented scale, variety, and speed of IOMT data present significant challenges for storage, real-time processing, and meaningful analysis14,15. Tackling these challenges requires innovative solutions in data management, storage, and analytics to extract actionable insights from the collected data.

Internet of medical things (IOMT) sensors.
Wearable devices and body area sensor networks (BASN)
Wearable devices play a pivotal role in IOMT, forming the foundation of Body Area Sensor Networks (BASN), also referred to as Wireless Body Area Networks (WBAN)16. These sensors continuously monitor physiological parameters by being worn on the body, embedded in clothing, or implanted. BASN are vital in chronic disease management, real-time health monitoring, and early detection of health issues17. However, the substantial volumes of continuous, high-frequency data they generate contribute significantly to the big data challenges in healthcare.
Blood pressure sensors generate real-time data on systolic, diastolic, and mean arterial pressure, which is vital for long-term cardiovascular health monitoring18. The continuous readings create large datasets used in predictive analytics, significantly aiding early diagnosis and personalized treatment plans in cardiovascular care19.
Pulse oximeters measure oxygen saturation (SpO2) and pulse rate, generating essential data for monitoring patients with respiratory conditions like COPD or asthma20,21. The continuous streams of oxygen saturation data support real-time interventions and long-term trend analysis for personalized respiratory care.
Glucose sensors continuously monitor blood sugar levels, generating real-time alerts for abnormal glucose levels, which is crucial for diabetes management22. This data enhances predictive analytics in diabetes care, improving personalized treatment by preventing severe fluctuations in glucose levels and enabling timely health adjustments23.
EEG sensors monitor brain activity, commonly used for diagnosing neurological conditions such as epilepsy24. These devices produce large datasets capturing electrical brain activity in real-time, which are crucial for developing personalized treatment strategies in neurology through big data analytics25.
ECG sensors track heart activity, producing real-time data on heart rhythms and electrical signals26. The large datasets generated are essential for detecting cardiovascular anomalies, contributing to the broader pool of healthcare big data that aids in the early detection and treatment of heart conditions27.
Respiration sensors measure breathing patterns, generating critical data for managing respiratory conditions like sleep apnea and chronic lung diseases28. The datasets produced by these sensors support real-time monitoring and long-term analysis in predictive healthcare analytics for respiratory health29.
Accelerometers and Motion sensors, commonly embedded in fitness trackers and smartwatches, monitor physical activity by detecting movement patterns30. The data generated supports preventive care strategies by contributing to large-scale health and fitness datasets, helping predict and monitor mobility-related health issues31.
Medical imaging devices
Medical imaging devices like Magnetic Resonance Imaging (MRI), Computed Tomography (CT), ultrasound, and X-ray machines generate detailed diagnostic images that contribute to large, complex datasets. These imaging devices are crucial for the early detection, diagnosis, and treatment of various health conditions32. However, the high-resolution images produced require robust storage and data processing capabilities, thereby amplifying the challenges of big data in healthcare.
MRI scanners generate vast amounts of detailed data on internal tissues and organs33. These high-resolution images are essential for diagnosing neurological disorders and create large datasets that necessitate advanced storage solutions and AI-powered analytics for efficient processing and analysis34.
CT scanners produce detailed cross-sectional images of the body, generating extensive datasets that support medical diagnosis35. The large volumes of CT data require sophisticated machine learning algorithms for real-time analysis, which enhances diagnostic accuracy and personalized treatment plans.
Ultrasound devices provide real-time imaging for diagnostic and monitoring purposes. These devices generate high-frequency image data used in various medical applications, from prenatal care to cardiology36. Processing ultrasound data necessitates efficient data management to support predictive analytics and advanced healthcare research37.
X-ray machines are widely used for diagnosing fractures, infections, and other skeletal issues. The data produced from X-ray images contributes to the growing repository of medical big data, aiding in large-scale analytics for trend identification and diagnostic improvements38,39.
In-home care and remote monitoring systems
IOMT extends beyond clinical settings, with in-home care devices enabling remote patient monitoring. These devices are particularly beneficial for elderly individuals and patients with chronic conditions, as they allow for continuous tracking without frequent hospital visits. The data generated through remote monitoring systems contributes to the larger healthcare data pool, requiring efficient data storage and analytics for real-time interventions and long-term patient care40.
Smart Glucose Monitors continuously monitor blood glucose levels, providing real-time data for diabetes management. This data supports both short-term adjustments and long-term trend analysis for optimizing treatment plans41.
Smart Thermometers track body temperature and provide early warnings of infections. The data generated by these devices is integrated into healthcare databases, supporting predictive healthcare analytics for early diagnosis and intervention42.
Fall Detection Systems, equipped with motion sensors, monitor movement patterns to detect falls, particularly among elderly patients. The data generated assists caregivers in intervening quickly while also contributing to big data analytics aimed at improving fall prevention strategies.
Assistive technologies
Assistive technologies within IOMT significantly enhance the quality of life for individuals with disabilities or elderly patients. These technologies generate continuous data streams that monitor health status and assist with daily activities43. This real-time data contributes to large-scale analytics for improving patient care and enhancing assistive technologies.
Smart Wheelchairs utilize Internet of Things (IOT) to monitor the user’s environment, generating data that improves mobility and safety44. This data supports real-time adjustments and contributes to healthcare analytics aimed at enhancing mobility solutions.
Connected Hearing Aids adjust sound levels in real time and transmit data on user hearing patterns to healthcare providers, aiding in personalized care and contributing to larger healthcare datasets45.
Virtual Reality (VR)/Augmented Reality (AR) Systems are utilized for cognitive and physical rehabilitation, generating data that supports therapeutic progress monitoring and rehabilitation outcomes analysis46.
Cognitive Assistance Devices provide real-time reminders and health monitoring for elderly or cognitively impaired individuals. The data collected is vital for ensuring safety and contributes to personalized care strategies through big data analytics47.
Offloading techniques
Medical 4.0 technologies have introduced a vast array of devices and systems that generate massive volumes of big data, particularly in the healthcare sector. These include sensors, wearable devices, mobile applications, and virtual reality, all of which contribute to the growing IOMT. In this evolving landscape, specialized techniques are needed to process and store the immense amounts of data produced48. The IOT, mobile computing, artificial intelligence, and big data analytics further amplify the challenge, demanding more robust and intelligent systems to manage the continuous flow of information49.
To handle this influx of data, cloud computing has emerged as a popular solution, offering a scalable and efficient method for managing healthcare big data. Many healthcare institutions have adopted cloud computing to implement advanced healthcare information systems50. These systems provide comprehensive data storage and processing capabilities, facilitating everything from patient monitoring to decision-making in real time. However, researchers have identified significant organizational barriers when implementing cloud-based systems, often related to system integration and management51,52. Furthermore, while cloud computing remains effective for large-scale data storage, it faces challenges such as network congestion, latency, and delayed responses, particularly in time-sensitive applications like healthcare53. These limitations have raised concerns about the reliability of cloud-based solutions for critical healthcare operations.
To address these challenges, Mobile Edge Computing (MEC) has been introduced as a way to bring data processing closer to the source, particularly in healthcare scenarios involving the IOMT. MEC helps reduce the latency and bandwidth issues commonly associated with cloud computing by processing data at the edge of the network. Studies have examined the use of MEC for WBAN, where patient data is transmitted from sensors to nearby edge devices for real-time analysis54. This reduces reliance on the cloud and enhances the system’s responsiveness. Additionally, new frameworks have been proposed to optimize edge network cooperation, improving task efficiency and performance in edge computing55. Despite these advantages, MEC systems still face limitations related to scalability and resource allocation, particularly when large datasets need to be processed simultaneously53,56,57. In addition to MEC, researchers have turned to edge and fog computing as viable alternatives for handling real-time healthcare applications. Edge computing offers immediate data processing at or near the data source, making it a suitable solution for time-sensitive tasks such as analyzing patient health data58. For instance, healthcare systems utilizing edge computing have been designed to optimize resource allocation, reduce costs, and enhance user benefits through game theory-based approaches59. Similarly, the integration of edge computing into smart surveillance systems has demonstrated improvements in network bandwidth usage and response times60. While edge computing provides localized data processing, it still faces challenges when scaling to meet the demands of larger healthcare institutions.
Fog computing has also gained traction, particularly in scenarios requiring data processing at or near the data source, such as wearable medical devices. This approach reduces latency and eases the burden on network bandwidth, enabling real-time analytics for applications like remote patient monitoring and predictive healthcare interventions61. A notable advancement is the concept of a Smart e-Health Gateway, which leverages fog computing to provide local data storage, real-time processing, and embedded data mining in IoT-based healthcare networks62. While fog computing addresses issues like mobility, scalability, and reliability, it is not without its challenges, particularly when coordinating data cooperation across multiple healthcare institutions.
Another approach that has been explored is the use of cloudlets, small-scale data centers that are located closer to the data source than traditional cloud servers. While cloudlets have shown promise in managing healthcare big data, their scalability and resource limitations make them less suitable for handling large datasets during peak usage periods63. In such cases, cloud computing may offer greater scalability, but with the trade-off of higher latency and network congestion. Edge computing has similarly been employed to process medical data generated by IOT devices, although it struggles with the same scalability issues as cloudlets64. To tackle the challenges of data heterogeneity and irregularity, middleware and hybrid platforms combining fog and cloud computing have been proposed to ensure efficient data processing, classification, and storage65.
The literature highlights various attempts to address the challenges of managing healthcare big data through cloud, edge, and fog computing. While these technologies offer distinct advantages, such as localized data processing and reduced network latency, they also present limitations, particularly regarding scalability and data cooperation. As cloud computing faces issues with real-time decision-making and responsiveness, and edge computing struggles to scale, there is a need to explore alternative solutions. Regional computing, which combines the strengths of both cloud and edge computing, emerges as a promising approach to manage healthcare big data more effectively, especially in scenarios that require both scalability and real-time processing. Further research is needed to fully explore the potential of regional computing in addressing these critical challenges.
Proposed methodology
The healthcare system becomes more efficient as more data from IOMT is integrated into the collective network. Uploading data from every device to cloud servers is essential; however, each medical device may generate up to a terabyte of data per day, which is beyond the capacity of existing systems to transport, process, and store efficiently. As illustrated in Fig. 4, the proposed system seeks to process and store this medical big data closer to healthcare infrastructure to reduce latency and cost. The data is then transferred to the cloud during off-peak hours, ensuring minimal network load, as peak hours often lead to congestion, whereas off-peak periods are typically underutilized. The proposed model look at the performance (network and data-center), energy and cost model. The remaining part of this section, covers this in detail.

Proposed structure of regional computing for healthcare data-driven applications.
Delay model
The delay model is structured into three layers: the IOMT, responsible for managing all healthcare devices; regional computing, which handles the processing of healthcare big data near the devices; and cloud computing, which ensures permanent data storage and supports large-scale analysis. The following sections detail the operation of this methodology.
Internet of medical things (IoMT)
The IOMT layer includes the medical devices, and sensors. Data from these devices (\(w = \{w_{1}, w_{2}, w_{3}, \ldots , w_{m}\}\)) , such as wearable sensors, implantable medical devices, or external monitoring systems (\(d = \{d_{1}, d_{2}, d_{3}, \ldots , d_{n}\}\)), is transmitted to gateways through personal or local area networks, which act as collectors and edge for transferring data to the regional servers for processing and analysis. The medical sensors, such as Electrocardiogram (ECG) monitors, pulse oximeters, and glucose sensors, collect real-time health data, while gateways help ensure efficient data transmission to minimize latency and support immediate healthcare needs. This communication involves various delays during the data transmission process. These delays include transmission delay, propagation delay, processing delay, and queuing delay, each contributing to the overall time required for the data to reach its destination.
Most of the sensors are wirelessly connected to the gateway through a personal area network and wirelessly transmit the data. Transmission delay (\(T_{\text {tran}}\)) accounts for the time taken to transmit the data from the IOMT device (d) to the gateway. It is determined by factors including data (\(Wl\)), channel bandwidth (\(B\)), signal-to-noise ratio (\(SNR\)), modulation efficiency (\(M\)), and error rate (\(E\)). This relationship is expressed as:
The propagation delay (\(T_{\text {prop}}\)) represents the time taken for the data to travel through the wireless medium. It depends on the distance (\(d\)) between the IOMT device and the gateway and the transmission speed (\(v\)) in the medium:
The processing delay (\(T_{\text {proc}}\)) reflects the time taken for the gateway to process the received data. It is determined by the data workload (\(Wl\)) and the processing rate of the gateway (\(R_{\text {proc}}\)):
Finally, the queuing delay (\(T_{\text {que}}\)) indicates the time the data spends in the gateway’s queue before being processed. This depends on the workload (\(Wl\)), packet arrival rate (\(\lambda\)), and the processing capacity (\(\mu\)) of the gateway:
where \(Wl = \sum _{i=1}^{n} d_i\), workload generated by 1 to n medical devices.
Combining all these components, the total delay for data communication from IOMT devices to the gateway through the PAN or LAN can be expressed as:
This Eq. (5) provides a comprehensive way to calculate the total delay in an IOMT layer, taking into account various factors such as data transmission, propagation, processing, and queuing delays.
Regional computing
To optimize network efficiency, the HBD generated by IOMT devices is temporarily stored on regional servers during peak hours and transmitted to the cloud during off-peak periods. This approach alleviates congestion on public networks and minimizes latency.
The regional layer consists of servers dedicated to processing and storing data from healthcare devices within a specific geographical area. These servers function as regional servers, aggregating information from various healthcare devices operating in their domain. Each device transmits data to the regional servers, which encompass parameters such as patient monitoring data, device status, environmental conditions, and other relevant information regarding health and safety.
This data from gateways to the regional servers is transmitted through fibre optic or other fast transmission medium. The transmission delay (\(T_{\text {tran}}\)) in this context depends on the data size (\(Wl\)), and the speed (\(v\)). The transmission delay can be expressed as:
The propagation, queuing and processing delay are the same as calculated for IOMT layer.
The Eqs. 5 and 7 demonstrate that the delay is primarily influenced by the total workload and the transmission distance. Therefore, by reducing both the network workload and the distance, the overall delay experienced by HBD can be significantly minimized.
The major part of the workload in this IOMT architecture is processed by regional computing units, significantly reducing the burden on central cloud infrastructure and, consequently, minimizing network congestion. By handling data closer to the source, regional computing limits the amount of traffic transmitted over the mainstream network, thus reducing the total traffic, \(Wl_{total}\), on the network. As a result, this approach helps maintain an optimal balance between workload and available bandwidth, \(B_{avail}\), as illustrated by the following congestion probability equation:
here, \(Con_{Prob}\) denotes the probability of congestion, which is directly proportional to the total network traffic and inversely proportional to the available bandwidth. Since regional computing handles the bulk of the processing locally, \(Wl_{total}\) decreases, effectively lowering the likelihood of congestion.
Regional computing’s decentralized approach, by reducing the volume of data sent to the cloud, optimizes bandwidth usage and mitigates network congestion risks, ensuring faster data processing and enhanced real-time IOMT services. This architecture not only improves efficiency but also supports scalable healthcare solutions as IOMT devices proliferate.
Cloud computing
The regional layer manages real-time medical data from IOMT devices, while the cloud layer operates as a powerful backend that enhances data processing and storage capabilities. The regional layer relies on the cloud for extensive computing resources, transferring medical big data to the cloud during off-peak hours to utilize its advanced capabilities for comprehensive analysis and share the data globally for research and diagnostic purposes.
In contrast to the regional layer, the cloud hosts a vast amount of HBD generated from worldwide medical centres. It functions as a centralized repository for processing and storing this extensive dataset.
Equation (8) illustrates the processing time (\(T_{\text {cloud}}\)) required to collectively analyze all medical workloads at cloud servers. Here, \(T_{\text {cloud}}\) represents the processing time, \(Wl\) is the total medical workload to be processed, and \(Pr_{cloud}\) is the processing rate of the cloud servers, denoting the volume of data processed per unit of time.
The total medical big data workload (\(Wl\)) is calculated as the summation of data produced by each IOMT device (\(d_i\)) from 1 to \(n\), as shown in Eq. (9):
Similarly, the propagation delay (\(T_{\text {prop}}\)) represents the time taken for the data to travel through the network. It depends on the distance (\(d_{cloud}\)) between the IOMT device and the cloud servers and the transmission speed (\(v\)) in the medium:
Analysis of Eqs. (9) and (10) indicates that the round-trip to the cloud incurs more delay than anticipated. This increased delay is primarily due to the cloud’s necessity to process substantial volumes of medical big data (\(Wl\)) and its distance (d). Additionally, propagation and queuing delays escalate in correlation with the growing workload and distance.
The cloud plays a crucial role in analyzing Medical Big Data (MBD) to derive insights into patient health, treatment effectiveness, and device performance. These insights improve healthcare delivery, providing real-time updates to healthcare providers and enhancing patient outcomes. Additionally, the cloud strengthens safety and security measures by detecting anomalies, identifying risks, and optimizing healthcare practices.
Energy model
In healthcare big data, energy consumption plays a critical role, especially when handling the vast amount of data generated by medical devices. Similar to delay, energy consumption is also impacted by the distance between devices. The energy consumption in HBD communication can be computed as:
here, \(\mathscr {E}_{\text {tran}}^{\text {sensor}}(i)\) represents the energy used for data transmission from medical sensor \(i\) to the gateway, while \(\mathscr {E}_{\text {tran}}^{\text {regional}}(i)\) refers to the energy utilized for transferring data from the gateway to regional servers.
Where
and
In these equations, \(Dis_{i, \text {gateway}}\) denotes the distance between medical sensor \(i\) and the gateway, \(P_{i}^{\text {sensor}}\) represents the power consumption for data transmission by sensor \(i\), and \(T_{i, \text {gateway}}\) is the time taken for the data to reach the gateway. Similarly, \(Dis_{\text {gateway}, \text {regional}}\) represents the distance from the gateway to the regional server, \(P_{\text {gateway}}^{\text {regional}}\) is the power consumption for data transmission, and \(T_{\text {gateway}, \text {regional}}\) represents the transmission time from the gateway to the regional servers.
These equations demonstrate that energy consumption increases with the distance involved in data transmission, both from sensors to gateways and from gateways to regional servers through network.
Similarly, \(\mathscr {E}_{\text {other}}\) encompasses the energy used for other operations such as data processing (\(\mathscr {E}_{\text {pro}}\)), storage (\(\mathscr {E}_{\text {stor}}\)), and cooling (\(\mathscr {E}_{\text {cool}}\)) in medical data centers.
The total energy consumption for the IOMT system is calculated as:
where \(\mathscr {E}_{\text {total}}\) represents the overall energy consumption, while \(\mathscr {E}_{\text {tran}}\) denotes the total energy consumed during data offloading from IOMT devices.
It is important to note that:
There is a direct relationship between energy consumption (\(\mathscr {E}\)) and operational costs (\(Cost_{\text {oper}}\)). As energy consumption increases, the operational costs of managing and processing medical big data also rise.
The equations above indicate that energy consumption escalates as the distance between IOMT sensors and regional servers increases. Moreover, the increasing workload can congest network channels and computing processors, generating additional heat and further energy consumption (as shown in Eq. 16). Consequently, this model shows that energy consumption for cloud-based processing of medical big data is significantly higher. However, when workloads are processed by regional servers, energy requirements are reduced, making regional computing a more energy-efficient solution for HBD.
Cost model
In prior sections, we examined how delay, congestion, and energy consumption escalate with the increasing distance between medical devices and processing units within the IOMT framework. This section highlights the cost dynamics associated with these parameters for HBD. The total cost can be expressed using the following equation:
where \(Cost_{t}\) signifies the total cost, \(Cost_{tr}\) denotes the transmission cost, \(Cost_{p}\) is the propagation cost, \(Cost_{pr}\) refers to the processing cost, and \(Cost_{col}\) accounts for the cooling cost associated with medical data storage and processing facilities.
The transmission cost, \(Cost_{tr}\), encompasses two components: the expense related to transmitting data from IOMT devices to central data aggregation points and the cost incurred from these aggregation points to regional computing servers.
For the transmission from IOMT devices to gateway, the cost can be formulated as:
In this formula, \(n\) represents the number of IOMT devices, and \(m\) denotes the number of workload tasks generated by these devices. \(C_{\text {rate, dev}}\) signifies the cost per unit of data transmitted, with \(L_{i,\text {gateway}} w_j\) indicating the data amount from IOMT device \(i\) for workload \(j\). \(C_{\text {time, dev}}\) refers to the cost per unit of time for this transmission, while \(T_{i,\text {gateway}}\) represents the required transmission time. \(C_{\text {energy, dev}}\) denotes the cost per unit of energy consumed, with \(E_{i,\text {gateway}}\) representing the energy utilized in the transmission from IOMT devices to data aggregation points. Additionally, \(C_{\text {bandwidth, dev}}\) indicates the cost per unit of bandwidth used, and \(B_{i,\text {gateway}}\) signifies the bandwidth utilized. \(C_{\text {fixed, dev}}\) is the fixed cost associated with each transmission event from IOMT devices.
For the transmission from gateway to regional computing servers, the cost can be formulated as:
In this formula, \(C_{\text {rate, gateway}}\) signifies the cost per unit of data transmitted from gateway, with \(l_{\text {gateway},\text {rc}} w_j\) representing the data amount for workload \(j\). The cost per unit of time for this transmission is \(C_{\text {time, gateway}}\), with \(T_{\text {gateway},\text {rc}}\) indicating the time taken. \(C_{\text {energy, gateway}}\) denotes the cost per unit of energy consumed during this transmission, while \(E_{\text {gateway},\text {rc}}\) represents the energy used in the transmission from the gateway to regional computing servers. \(C_{\text {B, gateway}}\) is the cost per unit of bandwidth utilized, and \(B_{\text {gateway},\text {rc}}\) signifies the bandwidth utilized. Lastly, \(C_{\text {fixed, gateway}}\) is the fixed cost associated with each transmission event from aggregation points.
The total transmission cost can be calculated as:
The propagation cost, \(Cost_{p}\), is determined based on the distances involved and is expressed as:
In this equation, \(C_{\text {dis, dev}}\) is the cost per unit of distance for IOMT device-to-aggregation point transmission, while \(Dis_{i,\text {gateway}}\) is the distance from IOMT device \(i\) to the aggregation point. \(C_{\text {dis, gateway}}\) signifies the cost per unit of distance for aggregation-to-regional computing transmission, with \(Dis_{\text {gateway},\text {rc}}\) representing the distance involved in this stage.
The processing cost \(Cost_{pr}\) is computed as:
here, \(T_{\text {prc}_{i,j}}\) denotes the processing time for data from IOMT device \(i\) and workload \(j\), and \(C_{\text {uprc}}\) signifies the processing time cost per unit.
This comprehensive cost model encompasses the expenses associated with transmitting data from IOMT devices to gateway and then to the regional computing servers, as well as the propagation and processing costs involved in handling HBD.
The cost model equations demonstrate the significant influence of distance on transmission and propagation costs, along with processing time on overall expenses (as illustrated in Eqs. 18, 19, and 22). Due to the increased distances involved in data transmission, cloud computing generally incurs higher costs. In contrast, regional computing optimizes costs by minimizing transmission distances and enhancing processing efficiencies, rendering it a more cost-effective approach for managing HBD.
Algorithm
The Algorithm 1 is designed to handle the large-scale data generated by IOMT devices, including wearables, medical imaging systems, remote monitoring, and emergency response systems. The data generated from these sources \(D = \{d_{1}, d_{2}, d_{3}, \ldots , d_{n}\}\), and their associated workloads \(w = \{w_{1}, w_{2}, w_{3}, \ldots , w_{m}\}\), are processed through a tiered system, which leverages Edge Computing (EC) (Gateway) for immediate, real-time needs, RC for intermediate tasks, and Cloud Computing (CC) for intensive processing.
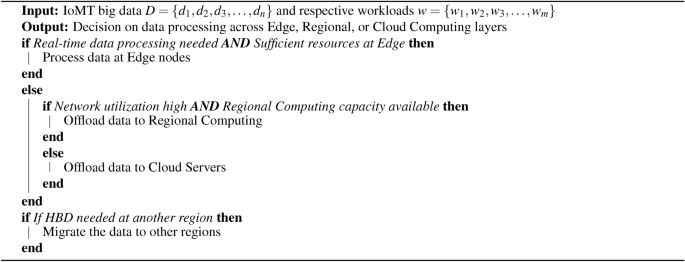
IoMT big data processing and offloading.
The IOMT algorithm functions by efficiently distributing data processing across multiple layers (Edge, Regional, and Cloud Computing) based on the needs of the healthcare applications and the current network conditions. Initially, as shown in Fig. 5, data generated by IOMT devices, such as wearables or emergency systems, is checked to determine if it requires immediate processing. If the data is time-sensitive and gateway resources are available, the algorithm processes it locally. This ensures minimal delay and provides real-time analytics, which is essential for critical healthcare applications like patient monitoring or urgent diagnoses.

Flowchart for healthcare big data.
When network utilization is high and edge resources are insufficient, the algorithm considers offloading the data to RC. If the regional servers have available capacity, the data is processed at this intermediate layer. This step helps in balancing resource utilization while minimizing the dependency on external cloud services.
In situations where neither EC nor RC is viable, or if the data processing tasks are particularly resource-intensive, such as those involving medical imaging analysis, the algorithm shifts the workload to Cloud Computing. This ensures that more computationally demanding tasks are handled efficiently, even if it increases the dependency on centralized cloud resources. For critical or urgent medical tasks where real-time data analysis or rapid migration to other regions is necessary, the algorithm gives priority to cloud processing. Additionally, it supports the migration of critical data to other regions for immediate analysis and decision-making. By following this tiered processing approach, the algorithm ensures that HBD is managed efficiently, providing real-time patient care while balancing network traffic and optimizing resource allocation. This structure helps healthcare systems address the growing demands of data-intensive medical applications, ensuring timely insights and interventions.
Evaluation
To evaluate the proposed methodology, we conducted experiments using two types of setups: an Arduino prototype for network performance and the EdgeCloudSim simulator for data center-related parameters. In the first setup, an Arduino R4 WiFi board was used to connect various Internet of Medical Devices (IoMT), including a pulse sensor, heartbeat sensor, pulse oximeter, heart rate monitor, blood oxygen concentration sensor, and temperature sensor, simulating real-world data transmission scenarios. Due to limitations in device availability, we virtually multiplexed the number of connected devices from 10 to 2000, replicating real-time network behavior. In parallel, we utilized EdgeCloudSim66 to simulate the data center environment, focusing on resource utilization and network error rates. This dual approach allowed for a comprehensive evaluation of the methodology, considering both network and data center performance.
Experimental setup
A set of Internet of Medical Devices (IoMT) were connected to an Arduino R4 WiFi board, enabling the communication of sensor data over the network. These sensors provided continuous real-time data, which the Arduino captured and transmitted to a remote system for processing.
Since the Arduino board and the connected devices were limited in terms of the number of devices they could handle, we employed a method to virtually scale the device network. By multiplying the sensor data from the initial set of devices by a factor of n, we were able to simulate up to 2000 devices, with each device transmitting 1000 KB of data.
Key parameters, as shown in Table 1, included an initial device count of 10, which was incremented by 10 per iteration up to a maximum of 2000 devices, each transmitting data at an initial bandwidth of 5000 KB/s. To simulate realistic conditions, we used one cloud server, one regional server, and one edge server, with a network topology incorporating Wireless, LAN, and WAN connections. The energy cost per millisecond was set to 0.001, network transmission cost to 0.005 per KB, and cloud processing cost to 0.001 per ms. Simulation scenarios were repeated 10 times over a 30-min duration, measuring round-trip delay and computing the total communication and processing costs for analysis. This configuration enabled a thorough assessment of system performance under varying load and network conditions.
The experimental setup was divided into two categories for detailed analysis:
-
1.
In the first scenario, a prototype using Arduino R4 WiFi was developed to collect sensor data and transmit it to both cloud and regional computing systems, enabling observation of network behavior.
-
2.
In the second scenario, a simulation environment was created on EdgeCloudSim to observe data center behavior in managing healthcare big data.
The remaining section covers these experimantation and simulation in detail.
Arduino R4 Wifi
In the prototype, we incrementally increased the number of devices from 10 to 2000, leading to a proportional rise in communication cost. As illustrated in Fig. 6, the communication cost for cloud computing escalated significantly, rising from 0.5 to 100 $ as the device count increased. This sharp rise is due to the longer distances and larger data volumes involved in transmitting data to centralized cloud servers. Conversely, regional computing exhibited a steadier increase, with communication costs rising from 0.1 to only 30 $, maintaining a relatively stable rate compared to cloud computing. This reflects regional computing’s efficiency in scenarios with lower data transmission requirements.

Comparison of communication cost.
The processing cost increases with the number of devices as more data requires additional computational resources. However, as shown in Fig. 7, the rate of increase for cloud computing is significantly steeper, with processing costs rising from 4.6 to 928.3 $ as device count increases from 10 to 2000. This steep increase is due to the higher computational expenses incurred by centralized cloud servers as the workload scales. In contrast, regional computing demonstrates a more gradual rise, with processing costs increasing from 2.3 to only 463.6 $, benefiting from localized processing that maintains a more stable and lower processing cost, even as devices and data grow.

Comparison of processing cost.
As observed in Fig. 8, the throughput in cloud computing initially increases rapidly with the addition of devices, peaking at 5000 KB per second when handling around 1000 devices. However, as device numbers continue to grow, throughput begins to decline, dropping to 3333 KB per second at 2000 devices due to system overload from the massive workload. In contrast, regional computing maintains a stable throughput throughout, as it distributes the workload more evenly. This consistent resource usage in regional computing allows it to handle the regional workload loads without the performance degradation seen in cloud computing.

Comparison of throughput.
As shown in Fig. 9, congestion in cloud computing escalates sharply as the number of devices grows, with congestion levels reaching 75% at 800 devices and nearing 600% at 2000 devices. This increase in congestion results in significant network bottlenecks and degraded performance due to the high data transmission volume, which strains the cloud infrastructure. In contrast, regional computing maintains a consistently. It easily supports 1000 devices. This stability in regional computing is due to its localized data handling (limited devices), allowing it to efficiently manage the workload and avoid the severe congestion issues seen in cloud computing.

Comparison of congestion.
As shown in Fig. 10, cloud computing experiences a significantly higher average network delay of approximately 363 ms. This delay is primarily due to the long-distance data transfer to centralized cloud servers, which is further exacerbated by increased traffic and workload, leading to higher latency. In contrast, regional computing maintains a much lower and more stable average delay of around 163 ms, even as the number of devices increases. The lower delay in regional computing is attributed to the localized processing, which minimizes data transfer distances and avoids the bottlenecks commonly encountered in cloud computing, resulting in consistently faster data transfer times.

Comparison of network delay.
EdgeCloudSim
Figure 11 displays the server utilization metrics for both cloud and regional computing environments. Cloud server utilization shows slight fluctuations between 0.958 and 1.081 as the task load increases. In contrast, regional server utilization starts at 8.8877 for 119,357 tasks and increases to 29.2775 as the load reaches 257,252 tasks. Despite the higher utilization percentages observed in regional computing, it maintains optimal performance, demonstrating its resilience and effective resource allocation. The increased utilization in regional computing reflects its ability to scale efficiently without compromising performance.

Comparison server utilization.
Figure 12 illustrates the average processing time comparisons between cloud and regional computing environments. Cloud computing shows relatively stable processing times, ranging from 0.0733 to 0.0786 s as the number of tasks increases. In contrast, regional computing experiences significantly longer processing times, starting at 1.6110 s for 119,357 tasks and rising to 2.5716 s for 257,252 tasks. Despite the higher processing times in regional computing, this increase is gradual, reflecting its capacity to handle tasks efficiently at the regional level while maintaining a steady performance.

Comparison of processing time.
Figure 13 illustrates the comparison of failed tasks between cloud and regional computing environments. In cloud computing, the number of failed tasks is significantly higher, with failure rates ranging from 87.09% in iteration 1 to 91.74% in iteration 5. This higher failure rate is attributed to the larger network delay in cloud computing, which impacts task completion and results in a greater number of failures as the task load increases. In contrast, regional computing maintains a much lower failure rate, ranging from 0.81% in iteration 1 to 1.25% in iteration 10. This lower failure rate highlights regional computing’s ability to handle tasks more efficiently, with reduced delays and better task completion rates even as the task load increases.

Comparison of failed task.
Discussion
This section presents a comparative analysis of cloud computing and regional computing across multiple performance metrics, including communication cost, processing cost, throughput, congestion, network delay, server utilization, processing time, and task failure rates, as illustrated in Figs. 6, 7, 8, 9, 10, 11, 12 and 13.
The analysis reveals that communication costs in cloud computing increase sharply as the number of devices and data volume rise. This trend can be attributed to the extended distances data must travel to reach centralized cloud servers, which incurs significant transmission costs under high loads. In contrast, regional computing demonstrates a more stable communication cost pattern. Due to localized data processing, the transmission distance and hence the associated cost remains lower, making regional computing a scalable and cost-efficient solution, especially in scenarios involving a large number of connected devices.
Processing costs in cloud computing also rise steeply with the growth in devices and data, as seen in Fig. 7. The centralized nature of cloud computing necessitates higher resource allocation on central servers, which translates to higher computational expenses under increasing workloads. Regional computing, however, manages processing costs more effectively by leveraging localized resources. This decentralized approach enables a more stable cost structure, showcasing regional computing as a cost effective choice for environments with heavy processing requirements.
Regarding throughput, cloud computing initially demonstrates high performance as more devices are added, but this increase plateaus and eventually declines when system capacity is reached, leading to performance bottlenecks. Regional computing, on the other hand, maintains a consistent throughput throughout the workload increments. By distributing tasks across regional servers, regional computing avoids the extreme resource saturation seen in cloud infrastructure, enabling it to handle increased demands without substantial performance degradation.
Cloud computing experiences substantial congestion as device numbers increase, with data flow encountering network bottlenecks that degrade overall system efficiency, as displayed in Fig. 9. This congestion arises from the need to transmit large volumes of data over extended distances. Conversely, regional computing maintains low and stable congestion levels by processing data closer to the source, allowing it to better manage high workloads without experiencing severe congestion, thus providing more efficient data transmission.
Network delay in cloud computing escalates with device count, primarily due to the longer transmission distances to centralized cloud servers, exacerbated by increased traffic on the cloud infrastructure. Regional computing mitigates these latency issues by localizing data processing, resulting in consistently lower and stable network delays even as device numbers rise. The minimized distance and reduced potential for bottlenecks contribute to more reliable data transfer times in regional environments.
In terms of server utilization, regional computing shows steady and efficient resource usage, adapting to increasing tasks without compromising performance. The utilization rate in regional computing rises predictably, as shown in Fig. 11, indicating effective resource allocation. Cloud computing, however, shows minor fluctuations in utilization, suggesting less efficient handling of resources as workload demands grow, which can hinder scalability in intensive environments.
Although cloud computing achieves faster processing times, regional computing provides more stable processing durations as tasks increase. In Fig. 12, regional computing exhibits a gradual rise in processing time, but this increase remains controlled compared to cloud computing. While cloud processing may seem advantageous in speed, regional computing’s consistent handling of tasks and reduced latency make it better suited for sustainable and reliable performance at scale.
A critical area where regional computing excels is in task failure rates. Cloud computing encounters a high task failure rate as network delays and resource allocation challenges increase with the workload. Conversely, regional computing maintains a low task failure rate, as shown in Fig. 13. This lower rate indicates effective resource allocation and superior task management, making regional computing more reliable in maintaining task completion under heavy load.
In summary, while cloud computing remains a powerful solution for large-scale processing, it encounters issues such as increasing costs, network congestion, and higher latency as data and device volumes rise. Regional computing offers a viable alternative by providing lower communication and processing costs, stable throughput, efficient resource utilization, and reduced delays. Despite slightly longer individual processing times, regional computing’s advantages in scalability and performance make it especially suitable for edge and localized applications, where cost efficiency and reliability are paramount.
Conclusion
Cloud computing, while effective for large-scale data handling, presents notable limitations in the context of healthcare big data. The centralized nature of cloud infrastructure leads to high latency, network congestion, and costly data transmission, all of which impede the timely processing required for real-time healthcare applications like continuous patient monitoring and robotic surgery. These delays in data analysis can hinder quick decision-making, impacting patient outcomes and the overall efficiency of healthcare delivery. To address these issues, this study proposes a regional computing (RC) approach, designed to alleviate the dependency on cloud systems by incorporating strategically positioned regional servers. This RC framework processes and stores data closer to the source, reducing transmission distances and mitigating congestion, thus providing a more responsive, scalable solution for handling healthcare big data. Experimental results reinforce the advantages of RC, showing reduced communication costs, more stable throughput, lower congestion, and minimized network delays compared to cloud computing. By delivering timely data insights at a regional level, RC empowers healthcare professionals with the data-driven insights necessary to optimize treatment strategies, improve diagnostics, and enhance patient monitoring in real time. This decentralized approach effectively meets the demands of modern healthcare, ensuring data is processed efficiently and accessibly, ultimately supporting more personalized and responsive care. The proposed system demonstrated effective performance; however, challenges remain in optimizing data offloading decisions. As part of future work, we plan to integrate Artificial Intelligence and Fuzzy Logic Systems to enhance the efficiency of data offloading to edge, regional, and cloud computing environments. This approach aims to achieve optimal cost, reduced delay, and better handling of computational demands.
Data availability
The code and data used to generate the results reported in this paper are available from Dr. Afzal Badshah (afalbadshahkhattak@gmail.com) upon reasonable request.
References
Laney, D. et al. 3d data management: Controlling data volume, velocity and variety. META Group Res. Note 6, 1 (2001).
Badshah, A. et al. Use of regional computing to minimize the social big data effects. Comput. Ind. Eng. 171, 108433 (2022).
Badshah, A. et al. Big data applications: Overview, challenges and future. Artif. Intell. Rev. 57, 290 (2024).
Putra, K. T. et al. A review on the application of internet of medical things in wearable personal health monitoring: A cloud-edge artificial intelligence approach. IEEE Access. (2024).
Akila1, A., Parameswari, R. & Jayakumari, C. Big data in healthcare: Management, analysis, and future prospects. Handbook of Intelligent Healthcare Analytics: Knowledge Engineering with Big Data Analytics 309–326 (2022).
Pramanik, P. K. D., Pal, S. & Mukhopadhyay, M. Healthcare big data: A comprehensive overview. Res. Anthol. Big Data Analytics Architectures Appl. 119–147 (2022).
DemandSage. Big data statistics in 2023 (2023).
Statista. Big data—Statistics & facts (2023). Accessed: 2024-10-09.
Cremin, C. J., Dash, S. & Huang, X. Big data: Historic advances and emerging trends in biomedical research. Curr. Res. Biotechnol. 4, 138–151 (2022).
Badshah, A. et al. Smart cities’ big data: Performance and cost optimization with regional computing. IEEE Access. (2024).
Badshah, A. et al. Towards smart education through internet of things: A survey. ACM Comput. Surveys 56, 1–33 (2023).
Badshah, A., Daud, A., Khan, H. U., Alghushairy, O. & Bukhari, A. Optimizing the over and underutilization of network resources during peak and off-peak hours. IEEE Access. (2024).
Osama, M. et al. Internet of medical things and healthcare 4.0: Trends, requirements, challenges, and research directions. Sensors 23, 7435 (2023).
Guo, C. & Chen, J. Big data analytics in healthcare. In Knowledge technology and systems: Toward establishing knowledge systems science, 27–70 (Springer, 2023).
Mishra, P. & Singh, G. Internet of medical things healthcare for sustainable smart cities: Current status and future prospects. Appl. Sci. 13, 8869 (2023).
Hamdi, A., Nahali, A., Harrabi, M. & Brahem, R. Optimized design and performance analysis of wearable antenna sensors for wireless body area network applications. J. Inform. Telecommun. 7, 155–175 (2023).
Arafat, M. Y., Pan, S. & Bak, E. Distributed energy-efficient clustering and routing for wearable iot enabled wireless body area networks. IEEE Access 11, 5047–5061 (2023).
Li, L. et al. Automatic and continuous blood pressure monitoring via an optical-fiber-sensor-assisted smartwatch. PhotoniX 4, 21 (2023).
Zhao, L. et al. Emerging sensing and modeling technologies for wearable and cuffless blood pressure monitoring. NPJ Digital Med. 6, 93 (2023).
Cabanas, A. M., Martín-Escudero, P. & Shelley, K. H. Improving pulse oximetry accuracy in dark-skinned patients: Technical aspects and current regulations. Br. J. Anaesthesia 131, 640–644. https://doi.org/10.1016/j.bja.2023.07.005 (2023).
Troughton, J. G., Brige, P. & Ramuz, M. Flexible, implantable, pulse oximetry sensors: Toward long-term monitoring of blood oxygen saturations. Biomed. Mater. Devices 1, 912–924 (2023).
Zhang, S. et al. Wearable non-invasive glucose sensors based on metallic nanomaterials. Mater. Today Bio 20, 100638 (2023).
Ahmed, A., Aziz, S., Qidwai, U., Abd-Alrazaq, A. & Sheikh, J. Performance of artificial intelligence models in estimating blood glucose level among diabetic patients using non-invasive wearable device data. Comput. Methods Programs Biomed. Update 3, 100094 (2023).
Das, S., Adhikary, A., Laghari, A. A. & Mitra, S. Eldo-care: Eeg with kinect sensor based telehealthcare for the disabled and the elderly. Neurosci. Inform. 3, 100130 (2023).
Liu, Q. et al. The feature, performance, and prospect of advanced electrodes for electroencephalogram. Biosensors 13, 101 (2023).
Pereira, T. M., Conceição, R. C., Sencadas, V. & Sebastião, R. Biometric recognition: A systematic review on electrocardiogram data acquisition methods. Sensors 23, 1507 (2023).
Lu, H., Feng, X. & Zhang, J. Early detection of cardiorespiratory complications and training monitoring using wearable ecg sensors and cnn. BMC Med. Inform. Decision Making 24, 194 (2024).
Hussain, T., Ullah, S., Fernández-García, R. & Gil, I. Wearable sensors for respiration monitoring: A review. Sensors 23, 7518 (2023).
Dai, J. et al. A wearable self-powered multi-parameter respiration sensor. Adv. Mater. Technol. 8, 2201535 (2023).
Kuzmin, A., Ivashchenko, A. & Ryabova, E. Biomedical applications of accelerometers: General directions and publication trends. Biomed. Eng. 57, 300–304 (2023).
Biró, A., Szilágyi, S. M., Szilágyi, L., Martín-Martín, J. & Cuesta-Vargas, A. I. Machine learning on prediction of relative physical activity intensity using medical radar sensor and 3d accelerometer. Sensors 23, 3595 (2023).
Karim, S., Qadir, A., Farooq, U., Shakir, M. & Laghari, A. A. Hyperspectral imaging: A review and trends towards medical imaging. Curr. Med. Imaging 19, 417–427 (2023).
Arnold, T. C., Freeman, C. W., Litt, B. & Stein, J. M. Low-field MRI: Clinical promise and challenges. J. Magnetic Resonance Imaging 57, 25–44 (2023).
Chaban, Y. V. et al. Environmental sustainability and MRI: Challenges, opportunities, and a call for action. J. Magnetic Resonance Imaging 59, 1149–1167 (2024).
Hermena, S. & Young, M. Ct-scan image production procedures. StatPearls (2023).
Huang, H., Wu, R. S., Lin, M. & Xu, S. Emerging wearable ultrasound technology. IEEE Trans. Ultrasonics Ferroelectrics Frequency Control 71, 713–729 (2024).
Riis, T., Feldman, D., Losser, A., Mickey, B. & Kubanek, J. Device for multifocal delivery of ultrasound into deep brain regions in humans. IEEE Trans. Biomed. Eng. 71, 660–668 (2024).
Maken, P. & Gupta, A. 2d-to-3d: A review for computational 3d image reconstruction from x-ray images. Arch. Comput. Methods Eng. 30, 85–114 (2023).
Sahin, M. E. Image processing and machine learning-based bone fracture detection and classification using X-ray images. Int. J. Imaging Syst. Technol. 33, 853–865 (2023).
Pourpanah, F. & Etemad, A. Exploring the landscape of ubiquitous in-home health monitoring: A comprehensive survey. ACM Trans. Comput. Healthcare. (2023).
Vrany, E. A. et al. Continuous glucose monitors and virtual care in high-risk, racial and ethnic minority populations: Toward promoting health equity. Front. Endocrinol. 14, 1083145 (2023).
Marais, H. Automatic extraction of data from infra-red thermometers with computer vision. IFAC-PapersOnLine 56, 7038–7043 (2023).
MacNeil, M., Hirslund, E., Baiocco-Romano, L., Kuspinar, A. & Stolee, P. A scoping review of the use of intelligent assistive technologies in rehabilitation practice with older adults. Disability Rehabilit. Assistive Technol. 19, 1817–1848 (2024).
Hezam, I. M., Rani, P., Mishra, A. R. & Alshamrani, A. Assessment of autonomous smart wheelchairs for disabled persons using hybrid interval-valued fermatean fuzzy combined compromise solution method. Sustain. Energy Technol. Assessments 57, 103169 (2023).
Mealings, K. et al. Hearing aids reduce self-perceived difficulties in noise for listeners with normal audiograms. Ear Hearing 45, 151–163 (2024).
Lakshminarayanan, V., Ravikumar, A., Sriraman, H., Alla, S. & Chattu, V. K. Health care equity through intelligent edge computing and augmented reality/virtual reality: A systematic review. J. Multidiscip. Healthcare. 2839–2859 (2023).
Srivani, M., Murugappan, A. & Mala, T. Cognitive computing technological trends and future research directions in healthcare-a systematic literature review. Artif. Intell. Med. 138, 102513 (2023).
Haleem, A., Javaid, M., Singh, R. P. & Suman, R. Medical 4.0 technologies for healthcare: Features, capabilities, and applications. Internet Things Cyber-Phys. Syst. 2, 12–30 (2022).
Al Teneiji, A. S., Salim, T. Y. A. & Riaz, Z. Factors impacting the adoption of big data in healthcare: A systematic literature review. Int. J. Med. Inform. 105460 (2024).
Karatas, M., Eriskin, L., Deveci, M., Pamucar, D. & Garg, H. Big data for healthcare industry 4.0: Applications, challenges and future perspectives. Expert Syst. Appl. 200, 116912 (2022).
Zeadally, S., Siddiqui, F., Baig, Z. & Ibrahim, A. Smart healthcare: Challenges and potential solutions using internet of things (iot) and big data analytics. PSU Res. Rev. 4, 149–168 (2020).
Sasubilli, S. M., Kumar, A. & Dutt, V. Improving health care by help of internet of things and bigdata analytics and cloud computing. In 2020 International Conference on Advances in Computing and Communication Engineering (ICACCE), 1–4 (IEEE, 2020).
Akherfi, K., Gerndt, M. & Harroud, H. Mobile cloud computing for computation offloading: Issues and challenges. Appl. Comput. Inform. 14, 1–16 (2018).
Awad, A. I., Fouda, M. M., Khashaba, M. M., Mohamed, E. R. & Hosny, K. M. Utilization of mobile edge computing on the internet of medical things: A survey. ICT Express 9, 473–485 (2023).
Raj, J. S. & Jennifer, S. Optimized mobile edge computing framework for iot based medical sensor network nodes. J. Ubiquitous Comput. Commun. Technol. (UCCT) 3, 33–42 (2021).
Talebkhah, M. et al. Edge computing: architecture, applications and future perspectives. In 2020 IEEE 2nd International Conference on Artificial Intelligence in Engineering and Technology (IICAIET), 1–6 (IEEE, 2020).
Li, C., Xue, Y., Wang, J., Zhang, W. & Li, T. Edge-oriented computing paradigms: A survey on architecture design and system management. ACM Computing Surveys (CSUR) 51, 1–34 (2018).
Abirami, S. & Chitra, P. Energy-efficient edge based real-time healthcare support system. In Advances in computers, vol. 117, 339–368 (Elsevier, 2020).
Dong, P. et al. Edge computing based healthcare systems: Enabling decentralized health monitoring in internet of medical things. IEEE Netw. 34, 254–261 (2020).
Rajavel, R., Ravichandran, S. K., Harimoorthy, K., Nagappan, P. & Gobichettipalayam, K. R. Iot-based smart healthcare video surveillance system using edge computing. J. Ambient Intell. Human. Comput. 13, 3195–3207 (2022).
Kumar, D., Maurya, A. K. & Baranwal, G. Iot services in healthcare industry with fog/edge and cloud computing. In IoT-based data analytics for the healthcare industry, 81–103 (Elsevier, 2021).
Rahmani, A. M. et al. Exploiting smart e-health gateways at the edge of healthcare internet-of-things: A fog computing approach. Future Generation Computer Syst. 78, 641–658 (2018).
Lo’ai, A. T., Mehmood, R., Benkhlifa, E. & Song, H. Mobile cloud computing model and big data analysis for healthcare applications. IEEE Access 4, 6171–6180 (2016).
Singh, A. & Chatterjee, K. Securing smart healthcare system with edge computing. Comput. Security 108, 102353 (2021).
Alshammari, H., El-Ghany, S. A. & Shehab, A. Big iot healthcare data analytics framework based on fog and cloud computing. J. Inform. Process. Syst. 16, 1238–1249 (2020).
Sim, E. C. Edgecloudsim. https://github.com/CagataySonmez/EdgeCloudSim (2024).
Acknowledgements
This work was funded by the University of Jeddah, Jeddah, Saudi Arabia, under Grant no. (UJ-24-DR-446-1). Therefore, the authors thank the University of Jeddah for its technical and financial support.
Author information
Authors and Affiliations
Contributions
Dr Afzal Badshah wrote the main manuscript. Dr Tariq Alsahfi and Dr Omar Ibrahim Aboulola conducted the experiments. Dr Ali Daud revised the final draft. All authors reviewed the manuscript before submission.
Corresponding authors
Ethics declarations
Competing interests
The authors declare no competing interests.
Additional information
Publisher’s note
Springer Nature remains neutral with regard to jurisdictional claims in published maps and institutional affiliations.
Rights and permissions
Open Access This article is licensed under a Creative Commons Attribution-NonCommercial-NoDerivatives 4.0 International License, which permits any non-commercial use, sharing, distribution and reproduction in any medium or format, as long as you give appropriate credit to the original author(s) and the source, provide a link to the Creative Commons licence, and indicate if you modified the licensed material. You do not have permission under this licence to share adapted material derived from this article or parts of it. The images or other third party material in this article are included in the article’s Creative Commons licence, unless indicated otherwise in a credit line to the material. If material is not included in the article’s Creative Commons licence and your intended use is not permitted by statutory regulation or exceeds the permitted use, you will need to obtain permission directly from the copyright holder. To view a copy of this licence, visit http://creativecommons.org/licenses/by-nc-nd/4.0/.
About this article

Cite this article
Alsahfi, T., Badshah, A., Aboulola, O.I. et al. Optimizing healthcare big data performance through regional computing. Sci Rep 15, 3129 (2025). https://doi.org/10.1038/s41598-025-87515-5
Received:
Accepted:
Published:
Version of record:
DOI: https://doi.org/10.1038/s41598-025-87515-5
Keywords
This article is cited by
-
Artificial intelligence and big data in health policy and management: a comprehensive bibliometric analysis
Journal of Electrical Systems and Information Technology (2025)
-
Machine learning comparison for biomarker level estimation in wastewater dynamics monitoring
Scientific Reports (2025)
-
Enhancing remote patient monitoring with AI-driven IoMT and cloud computing technologies
Scientific Reports (2025)
-
Kademlia hash snow ablation resource optimized stride scheduling for mobile computing services in healthcare sector
Scientific Reports (2025)
-
Proximal Policy Optimization for Vehicular Big Data Offloading Across Edge, Regional, and Cloud Layers
Journal of Grid Computing (2025)
