
Abstract
As the importance of the prevention and premanagement of cardiovascular and cerebrovascular diseases continues to emerge, research is being conducted globally to create and compare risk factor prediction models using health examination big data. In this study, health insurance data were used to predict the incidence of cardiocerebrovascular disease using various models and compare the performance of the models on samples with different initial risk levels. This study analyzed data from 410,859 individuals from the National Health Insurance Service between 2002 and 2019. This study deployed various linear models to predict the occurrence of cardiocerebrovascular diseases in two distinct samples. Models based on logistic regression analysis with penalty terms on the objective function were used, and their predictive performances were compared using multiple evaluation metrics, including the area under the receiver operating characteristic curve. The logistic regression model incorporating variables selected by the LASSO algorithm exhibited superior predictive performance relative to other models, although the differences were not statistically significant. The models demonstrated improved performance for samples with higher incidence rates and initial risk levels. This study predicted and compared the incidence of cardiocerebrovascular disease (CCVD) in patients with different health conditions using national sample cohort data from the National Health Insurance Service. The findings underscore the importance of developing diverse models to predict diseases like CCVD, which have high medical costs and incidence rates, thus informing the development of healthcare policies.
Introduction
Due to an aging population and shifts in health behaviors, the incidence of cardiovascular diseases is steadily rising, contributing to an increasing burden in terms of both disease prevalence and medical expenses1,2,3. In Korea, the mortality rate from cardiovascular and cerebrovascular diseases has risen by 7% over the past decade, with medical related to these conditions accounting for approximately 17% of the nation’s total healthcare costs4.
Maintaining a healthy lifestyle is crucial for preventing cardiovascular and cerebrovascular diseases. Risk factors, including smoking, unhealthy eating habits, physical inactivity, and alcohol consumption, have been consistently linked to an increased likelihood of developing cardiovascular conditions5. As individuals age, prolonged exposure to these harmful lifestyle behaviors, as well as environmental factors, further elevates the risk of cardiovascular and cerebrovascular diseases. Consequently, as the population ages, both the incidence of these diseases and the associated healthcare costs are expected to rise significantly6.
Lifestyle habits related to cardiovascular and cerebrovascular diseases are modifiable, and these diseases can often be prevented through behavioral improvement5. Prevention and early management of cardiovascular and cerebrovascular are cost-effective strategies for reducing future disease burdens and mitigating soaring healthcare costs. Based on recent studies that utilize big data from both domestic and international healthcare systems, the evidence supporting the prevention of chronic diseases through healthcare interventions and behavioral changes has strengthened6.
Previous studies have primarily focused on utilizing large-scale health examination data to identify risk factors for cardiovascular diseases and develop predictive models7,8,9,10. However, most of these studies have relied on simple regression analyses or machine learning techniques, which pose limitations due to increased complexity in interpretation and issues related to overfitting. To address these challenges, this study employs linear models and penalized linear models, specifically LASSO and Ridge regression, to predict the risk of cardiocerebrovascular disease incidence. These models enhance interpretability through variable selection and dimensionality reduction while mitigating overfitting and improving generalizability. Furthermore, to account for the heterogeneity in individual health status and risk factors, this study incorporates underwriting criteria commonly used in private health insurance to classify the sample into two groups: the standard risk group and the simplified risk group, based on initial risk levels. This classification facilitates personalized risk prediction and enables the development of differentiated risk management strategies, thereby enhancing the practical applicability of the findings.
Accordingly, the objectives of this study are as follows. First, using NHIS big data, this study aims to predict the incidence risk of cardiocerebrovascular diseases by applying various linear and penalized linear models. Second, it seeks to identify key risk factors for each group categorized based on initial risk levels. By achieving these objectives, this study aims to provide scientific evidence to support the development of more effective strategies for the prevention and management of cardiocerebrovascular diseases.
In this study, linear and penalized linear models were utilized to predict the incidence of cardiocerebrovascular diseases. While various predictive models for major chronic diseases exist, ranging from linear models to machine learning approaches, many lack external validation and are highly specific to the study context, which limits their generalizability. Therefore, using a nationally representative sample and methodologies commonly employed by insurers for risk assessment and underwriting, this study applies logistic regression models due to their widespread use, interpretability, and computational efficiency.
Methods
Data source and study population
This study utilized the National Health Insurance Service National Sample Cohort (NHIS-NSC) as the primary data source to develop predictive models for CCVDs (NHIS-2022-2-318, IRB No. P01-202206-01-031). The NHIS covers over 97% of the population, and a random sample of 2% was extracted using the proportional allocation method, taking into account factors such as sex, age, enrollment type, insurance premium quantile, and region. Sampling was based on national health insurance enrollees in 2006, and data were collected from various databases, including eligibility factors (sex, age, insurance premium, etc.), health checkup information (body mass index [BMI], waist circumference, blood pressure, self-reported questionnaires, etc.), and hospital utilization data (hospital admissions, diagnoses, prescriptions, etc.) from 2002 to 2019. Additional details regarding the representativeness of the NHIS-NSC and supplementary information can be found in the available sources11 (Supplementary material).
Ascertainment of cardiovascular diseases
In this analysis, cerebrovascular disease (I60–I69) and ischemic heart disease (I20–I25) were used as dependent variables representing CCVDs. Subtypes of CCVDs were defined for additional analysis, including stroke (I60–I66, excluding I64), cerebral hemorrhage (I60–I62), and acute myocardial infarction (I21–I23). The baseline year was 2014, and a 5-year follow-up period was used to predict newly diagnosed CCVDs. To ensure the exclusion of patients with preexisting CCVD diagnoses, the washout period was defined as 2010–2014 (Fig. 1).

Data structure and research design.
Sample selection
The features used in the prediction models included health checkup variables that were conducted biennially. Initially, 418,208 participants with health checkup data available in either 2013 or 2014 and without a CCVD diagnosis between 2010 and 2014 were extracted. Participants with missing major examination variables or eligibility conditions were excluded, resulting in a total study population of 410,859 participants. Two groups were created to develop CCVD prediction models for individuals eligible for both private insurance types. Based on the conditions and operational definitions outlined in Tables 1, 126 and 413 samples met the criteria of the standardized insurance application form (henceforth, “standard group”) and 268,912 samples fulfilled the conditions of the simplified enrollment form (henceforth, “simplified group”) through restoration sampling. The “standard” group includes individuals who answered “No” to both Question A and Question B, while the “simplified” group includes those who answered “No” to both Question C and Question D. The standard questions are stricter regarding hospitalization, surgery, and prescriptions compared to the simplified questions. Therefore, the simplified group encompasses the standard group. The 15,534 individuals excluded from the sample are those who answered “Yes” to any of the simplified questions. A detailed discussion of screening for simplified and standard private insurance enrollees can be found in the literature12.
The items in this study were selected for two purposes: to mirror questionnaire responses typically provided by potential insurees to insurers before commencing insurance contracts and to be operationally defined within the dataset. Standard screening form questions typically mandate a longer period, often up to 5 years, during which individuals must have experienced no medical issues, including hospitalizations, surgeries, or diagnosed diseases. By contrast, simplified screening forms designed for individuals with substandard health conditions require shorter intervals without hospitalization or surgery. Disease diagnosis is limited to severe conditions, such as cancer.
Table 2 summarizes the descriptive statistics of the three samples; the incidence rate of the outcomes increased in the order of the standard group, the simplified enrollment group, and those without any screening process (referred to as the ‘all’ group). In particular, the standard group exhibited an incidence rate of approximately one-third of the overall incidence. The distribution of health checkup indicators and age followed a similar pattern. The standard group samples were characterized by younger age and exhibited lower levels of fasting blood serum triglycerides, systolic blood pressure (SBP), and various other health checkup indicators or family history records than the other groups.
Variables
Predictor variables were selected as follows: sex and age information were extracted from the eligibility database. Fifteen variables were obtained from the checkup database, including BMI, waist circumference, SBP, diastolic blood pressure, hemoglobin, fasting blood serum, total cholesterol, high-density lipoprotein cholesterol, low-density lipoprotein cholesterol, triglyceride, serum glutamic oxaloacetic transaminase, serum glutamic pyruvic transaminase, gamma-glutamyl transferase, urine dipstick test, serum creatinine, and estimated glomerular filtration rate.
Variables with specified thresholds were further processed to eliminate any variations in risk within the criteria defining the normal range for each index (Supplementary Table 1). Variables within the normal range were assigned a value of 0, whereas those beyond the normal range were adjusted to represent the absolute difference from the threshold value. This approach was adopted to estimate the incremental changes in risk beyond the normal range and capture the transition from no risk variation within the normal range to a potentially hazardous range. When the normal range provided was one-sided, a single variable indicating a deviation from the threshold value of the normal range was generated. For variables with a two-sided range, two variables representing the deviations from the minimum and maximum boundaries were generated. For example, if the normal range for BMI is 18.5–22.9, two variables—LOW_BMI and HIGH_BMI—were created to represent the distances from 18.5 to 22.9, respectively.
Statistical analysis
To predict the 5-year cumulative incidence of CCVDs, we utilized logistic regression and penalized logistic regression models, which offer the advantage of interpretability compared with black-box models. While complex models may improve predictive power, they often obscure the relationships between risk factors and outcomes. Logistic regression, widely used for binary outcomes, provides clear insights into variable importance, making it well-suited for clinical applications, without any severe loss of predictive ability.
To predict the 5-year cumulative incidence of CCVDs, we utilized logistic regression and penalized logistic regression models, which offer the advantage of interpretability compared with blackbox models. Logistic regression is widely used to predict binary outcomes using multiple variables. The logistic regression model is represented by the following equation:
By examining the signs and magnitudes of the coefficient vector (\(\:\beta\:\)) in the model, the marginal effects of each risk factor can be calculated, enabling a straightforward interpretation of the impact that each predictor has on the likelihood of developing CCVDs. Penalized logistic regression further enhances the prediction performance by incorporating \(\:{l}_{1}\) or \(\:{l}_{2}\) penalty terms into the objective function, reducing the size of the coefficient vector, and addressing the issue of overfitting. A nonnegativity constraint was also imposed on the coefficient vector, except for sex, as the features were preprocessed to indicate the absolute distance from the normal range of each health checkup variable, as previously discussed. Therefore, the objective function is given by:
In the LASSO model, the \(\:{l}_{1}\) penalty (\(\:{\lambda\:}_{1}\)) shrinks some coefficients to zero, allowing for the identification of the most influential predictors. This feature facilitates variable selection and the identification of key risk factors associated with CCVDs. Conversely, the ridge model, with its \(\:{l}_{2}\) penalty (\(\:{\lambda\:}_{2}\)), reduces the size of the coefficients without reducing them to zero. These regularization techniques help reduce data dependency and improve the generalizability of the model. Both models provide interpretable results while effectively addressing the issues of multicollinearity and overfitting13,14,15. For model training and validation, the study population was divided into an 80% training set and a 20% test set. The training set was further divided into 10 folds for hyperparameter tuning using 10-fold cross-validation (Fig. 2).
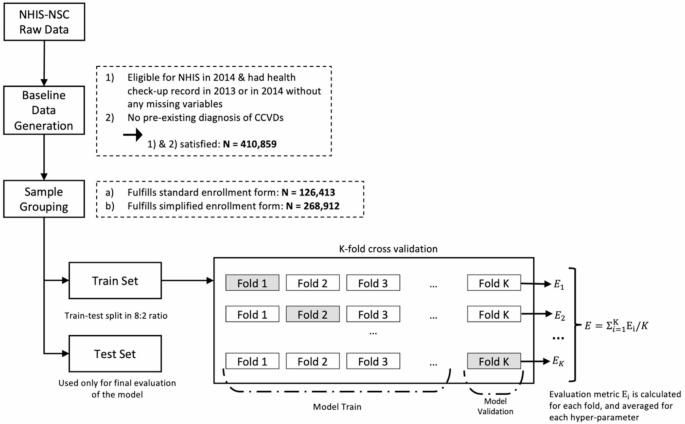
Sample selection, and data training process.
Evaluation metrics, such as the area under the receiver operating characteristic curve (AUROC), accuracy ([TN + TP]/[TN + FN + FP + TP]), recall (TP/[TP + FN]), and specificity (TN/[TN + FP]), were employed to compare the predictive powers between samples and models, where TN, TP, FN, and FP are the number of true negatives, true positives, false negatives, and false positives, respectively. Given the threshold dependency of these metrics and the imbalanced distribution of the outcome variables, a cutoff value was selected to optimize both recall and specificity. Specifically, the threshold was selected from the upper-left part of the receiver-operator curve, where the distance from the diagonal line was maximized16.
Results
Predictive performance
We use two samples in this analysis: the standard group and the simplified group. The standard group underwent a stricter screening process, resulting in a lower CCVD incidence rate, younger age distribution, and generally healthier checkup indices. In contrast, the simplified group exhibited a higher incidence rate and a less favorable health profile. These differences in initial risk factors, influenced by the screening process, are expected to impact the predictive performance of our models. Accordingly, we fitted and trained the models separately for each group. The training process for the models in each group was initiated via feature selection using the LASSO algorithm. Subsequently, logistic and ridge regressions were conducted separately to fit the selected variables. For comparison, logistic regression without penalty was also performed. Table 3 provides a comprehensive comparison of the predictive performances of these models. Within the table, “Logit” refers to a model trained with logistic regression without any penalty; “LASSO” refers to a model trained solely using the LASSO algorithm; and “LASSO & Logit” and “LASSO & Ridge” refer to models that employ logistic and ridge regression on the predictors selected by the LASSO algorithm, respectively. For a comprehensive evaluation of the models, AUROC, accuracy, recall, and specificity were used as evaluation metrics. After assessing the overall predictive ability, the optimal threshold to calculate accuracy, recall, and specificity was selected using the AUROC and its confidence interval17, regardless of the cutoff value of the models. Finally, the geometric mean of recall and specificity was calculated to evaluate the overall classification ability of the model.
When comparing the evaluation metrics of the four models, specifically focusing on the AUROC, both logistic regression without any penalty and nonnegativity-constrained logistic regression with variables selected using the LASSO algorithm exhibited superior predictive performance. However, it is worth noting that the differences in these performance measures were statistically insignificant. This trend remained consistent regarding the geometric mean. Except for cerebral hemorrhage in the standard group and ischemic heart disease in the simplified group, these two models generally outperformed the other models.
The AUROC of the simplified group—with a larger number of observations and incident cases—generally outperformed that of the standard group. This trend was also reflected in the geometric mean of recall and specificity, indicating that models of simplified samples were more balanced regarding the tradeoff between accuracy in positive and negative cases.
Regression coefficients
The coefficients that exhibited the highest overall AUROC values, estimated by the logistic regression models using variables selected by the LASSO algorithm, are shown in Table 4. Although logistic regression without constraints also demonstrated strong predictive performance, we encountered an issue with negative coefficients in this model. Because all variables were treated as risk factors, the presence of negative coefficients contradicted our expectations. Consequently, we focused our discussion solely on the regression results obtained from the logistic regression with variable selection.
Variables excluded through the LASSO algorithm for certain outcomes are denoted by a dash (-), whereas variables excluded for all outcomes are not included in the table. Several notable findings emerged from this study. Overall, models with heart disease outcomes (IHD and AMI) and those fitted to the standard group experienced more frequent variable exclusions. Furthermore, when comparing the coefficient values across different diseases, apart from cerebral hemorrhage, the simplified group consistently exhibited higher coefficients for all diseases. This implies that within the simplified enrollment group, the estimated incidence rate experiences a more significant increase with each unit increase in risk factors, such as screening indicators (e.g., blood pressure or age). This suggests that the same increase in these risk factors results in a greater escalation of risk within the simplified enrollment group, which already exhibits a higher prevalence of existing risk factors. These findings highlight the interplay between risk factors, disease incidence, and choice of insurance enrollment type. Specifically, individuals within the simplified enrollment group, who often possess a greater burden of risk factors, tend to experience a more pronounced increase in their estimated risk of various diseases.
Variable importance
Table 5 shows the variable importance of the logistic regression for the selected variables. The variable importance for each feature was calculated by conducting a logistic regression while normalizing the variables. Age has consistently emerged as the most important variable across all models. This finding is reasonable, considering that age is a factor that depreciates other health assets that are not measured in health checkups and self-reported questionnaires. Considering this, the importance of variables other than age, as shown in the table, is presented as relative importance; the importance of age was set at 100.
A notable finding demonstrated in the table is the elevated importance of variables related to smoking status and family history of stroke. Additionally, sex, BMI, and SBP showed high levels of importance. When comparing the two groups, the rankings of variable importance exhibited similar patterns for all variables, except cerebrovascular disease. Notably, for ischemic heart disease, the variable importance scores were remarkably similar between the two groups.
Discussion
This study employed various linear models to predict the incidence of CCVDs in two distinct samples. The logistic regression model with penalty terms demonstrated a superior fit regarding predictive performance compared to other penalized models, albeit without statistical significance. Furthermore, the model with the selected variables and penalty exhibited superior explainability compared to the model without any penalty. Notably, the overall model performance improved as the incidence rate of the samples and the prevalence of the target diseases increased.
These findings underscore the significance of customizing risk assessments to accommodate nuanced variations across individuals with different initial health statuses and diseases with varying risk factors. Such tailored approaches hold promise for enhancing disease prediction and developing insurance products. Moreover, they emphasize the need for further research and the refinement of predictive modeling techniques tailored to specific health conditions within various demographic groups.
Furthermore, by analyzing regression coefficients that are not excluded, it is essential to secure smoking habits or family history information related to the same area in advance to predict the risk factors for cardiovascular and cerebrovascular diseases. This is because, in almost all models, the family history of the risk-secured area appears as a variable with great significance. Several clinical studies have shown that family history is a major risk factor for cardiovascular disease18,19. Previous studies related to the predictive model in Korea did not consider family history7,10; therefore, accurate comparisons could not be made. However, in overseas studies, family history was a significant variable in the cardiovascular disease prediction model using machine learning20.
In situations where the prevalence of cardiovascular disease and medical expenses continue to increase, it is essential to secure a quantitative and objective basis. Cardiovascular diseases account for approximately 17% of Korea’s total medical expenses, and the burden of medical expenses due to cardiovascular diseases is significant4. In the United States, the estimated total cost of cardiovascular disease and related costs as of 2010 was $315.4 billion21, while in Russia, cardiovascular disease-related costs accounted for 0.19% of the gross domestic product as of 200922.
These findings have significant implications for public health policy and insurance risk management. First, the predictive models developed in this study can support personalized health management and policy interventions by assessing CCVD risk in advance. They enable early identification of high-risk individuals based on health screening data, facilitating timely preventive measures such as lifestyle modifications and medical treatments. Raising awareness of personal health risks can also encourage proactive health behaviors, ultimately improving public health and reducing healthcare costs.Second, these models can enhance insurers’ risk assessment and product development. By integrating predictive modeling into underwriting, insurers can quantify health risks, adjust premiums accordingly, and offer incentives for health management. For instance, premium discounts for high-risk individuals engaging in health programs can reduce insurer risk while promoting policyholders’ health, leading to more precise risk management and tailored insurance products.
This study has some limitations. First, as CCVDs were identified solely based on the International Classification for Diseases, Version 10 (ICD-10) codes, not all individuals with cardiovascular diseases were identified. Second, in the analysis group definition stage, the exclusion of low and high age groups was significant. This is related to the characteristics of patients undergoing health examinations, and there are reasons for their weakness regarding the purpose of prevention and access to examination reservations. This caused bias in this study, and it will thus be necessary to supplement our findings through customized DBs—such as elderly cohort DBs—for analyses that control for age in future studies.
Third, the data used in this study exhibit class imbalance between CCVD occurrence and non-occurrence cases. This imbalance may affect the model’s predictive performance, particularly recall, and performance improvement could be expected through techniques such as oversampling. However, in this study, oversampling was not applied to maintain the interpretability of the model and the consistency of variable selection. This remains a limitation that should be considered when interpreting the results.
Finally, although this study accounted for various confounders measured in the data, the possibility of residual confounding cannot be completely ruled out. Despite these limitations, this study is noteworthy because it compares the predictions of various models using the latest data.
Conclusion
This study utilized NHIS sample cohort data to predict CCVDs incidence and compare model performance across different health conditions. The logistic regression model with LASSO-selected variables showed the best predictive performance, particularly in the simplified group with higher incidence rates and risk levels. Age, smoking status, family history of stroke, sex, BMI, and systolic blood pressure were identified as key risk factors, emphasizing the need for personalized risk assessment and diverse predictive models for effective CCVDs prevention and management.
This study contributes to CCVDs prevention and management strategies through several strengths. First, using NHIS data, the study developed a robust predictive model representative of the Korean population, enhancing generalizability. Second, by classifying samples into standard and simplified groups, key risk factors were identified based on health status. Third, the application of penalized linear models, balancing interpretability and predictive performance, enhances practical utility. Collectively, these findings provide scientific evidence to support effective prevention and management strategies for CCVDs.
Data availability
Raw data were obtained from the Korean National Health Insurance System. The data supporting the findings of this study are available from the corresponding author upon request.
Abbreviations
- AUROC:
-
Area under the receiver operating characteristic curve
- BMI:
-
Body mass index
- CCVD:
-
Cardiocerebrovascular disease
- DALY:
-
Disability-adjusted life-years
- FN:
-
False negative
- FP:
-
False positive
- NHIS-NSC:
-
National Health Insurance Service National Sample Cohort
- SBP:
-
Systolic blood pressure
- TN:
-
True negative
- TP:
-
True positives
- IHD:
-
Ischemic heart disease
- AMI:
-
Acute myocardial infarction
References
Read, S. H. & Wild, S. H. Prevention of premature cardiovascular death worldwide. Lancet (London England). 395 (10226), 758–760 (2020).
Safiri, S. et al. Global, regional and National burden of osteoarthritis 1990–2017: A systematic analysis of the global burden of disease study 2017. Ann. Rheum. Dis. 79 (6), 819–828 (2020).
Kyu, H. H. et al. Global, regional, and National disability-adjusted life-years (DALYs) for 359 diseases and injuries and healthy life expectancy (HALE) for 195 countries and territories, 1990–2017: A systematic analysis for the global burden of disease study 2017. Lancet 392 (10159), 1859–1922 (2018).
Korean Statistical Information Service. Annual Report on the Cause of Death Statistics, Daejeon, Korea: Statistics Korea, (2022).
Artinian, N. T. et al. Interventions to promote physical activity and dietary lifestyle changes for cardiovascular risk factor reduction in adults: A scientific statement from the American heart association. Circulation 122 (4), 406–441 (2010).
Lee, S., Cho, E., Jeon, S. & Hong, S. C. Predicting the risk of major chronic diseases and its application: Using NHIS big data. Korean J. Insurance. 133, 23–48 (2023).
Lee, S. J. et al. Deep learning improves prediction of cardiovascular disease-related mortality and admission in patients with hypertension: Analysis of the Korean National health information database. J. Clin. Med. 11 (22), 6677 (2022).
Dinh, A., Miertschin, S., Young, A. & Mohanty, S. D. A data-driven approach to predicting diabetes and cardiovascular disease with machine learning. BMC Med. Inf. Decis. Mak. 19 (1), 1–15 (2019).
Goldstein, B. A., Navar, A. M. & Carter, R. E. Moving beyond regression techniques in cardiovascular risk prediction: Applying machine learning to address analytic challenges. Eur. Heart J. 38 (23), 1805–1814 (2017).
Joo, G., Song, Y., Im, H. & Park, J. Clinical implication of machine learning in predicting the occurrence of cardiovascular disease using big data (Nationwide cohort data in Korea). IEEE Access. 8, 157643–157653 (2020).
Lee, J., Lee, J. S., Park, S. H., Shin, S. A. & Kim, K. Cohort profile: The National health insurance service–national sample cohort (NHIS-NSC), South Korea. Int. J. Epidemiol. 46 (2), e15–e15 (2017).
Hwang, J. Y., Lee, S. Y. & Joo, S. H. Optimal underwriting questionnaire calculation of simplified issue product by coverage using National health insurance data. Korean J. Insurance. 124, 1–34 (2020).
Efron, B., Hastie, T., Johnstone, I. & Tibshirani, R. Least angle regression. Annals Stat. 32 (2), 407–499 (2004).
Gaines, B. R., Kim, J. & Zhou, H. Algorithms for fitting the constrained Lasso. J. Comput. Graphical Stat. 27 (4), 861–871 (2018).
Hu, Z., Follmann, D. A. & Miura, K. Vaccine design via nonnegative lasso-based variable selection. Stat. Med. 34 (10), 1791–1798 (2015).
Youden, W. J. Index for rating diagnostic tests. Cancer 3 (1), 32–35 (1950).
DeLong, E. R., DeLong, D. M. & Clarke-Pearson, D. L. Comparing the areas under two or more correlated receiver operating characteristic curves: A nonparametric approach. Biometrics 837–845. (1988).
Psaltopoulou, T. et al. Socioeconomic status and risk factors for cardiovascular disease: Impact of dietary mediators. Hellenic J. Cardiol. 58 (1), 32–42 (2017).
Kinoshita, M. et al. Japan atherosclerosis society (JAS) guidelines for prevention of atherosclerotic cardiovascular diseases 2017. J. Atheroscler. Thromb. 25 (9), 846–984 (2018).
Abdalrada, A. S., Abawajy, J., Al-Quraishi, T. & Islam, S. M. S. Machine learning models for prediction of co-occurrence of diabetes and cardiovascular diseases: A retrospective cohort study. J. Diabetes Metab. Disord. 21 (1), 251–261 (2022).
Korsnes, J. S., Davis, K. L., Ariely, R., Bell, C. F. & Mitra, D. Health care resource utilization and costs associated with nonfatal major adverse cardiovascular events. J. Manag. Care Specialty Pharm. 21 (6), 443–450 (2015).
Kontsevaya, A., Kalinina, A. & Oganov, R. Economic burden of cardiovascular diseases in the Russian federation. Value Health Reg. Issues. 2 (2), 199–204 (2013).
Acknowledgements
None.
Funding
This research was supported by the Academic Activity Support Program for Faculty at Seoul National University.
Author information
Authors and Affiliations
Contributions
Literature search: Sehyun Kim, Mingee Choi; writing—original draft: Mingee Choi, Sangyon Lee; writing—review and editing: Beomsang Ryu, Mingee Choi, Sangyon Lee; data analysis: Beomsang Ryu; validation: Beomsang Ryu; study design: Jaeyong Shin, Sok Chul Hong; methodology: Sok Chul Hong; data interpretation: Jaeyong Shin, & Sok Chul Hong; supervision: Jaeyong Shin, & Sok Chul Hong; project administration: Jaeyong Shin, & Sok Chul Hong.
Corresponding authors
Ethics declarations
Competing interests
The authors declare no competing interests.
Ethical approval and consent to participate
This study used secondary data, in which all personal information was anonymized and de-identified. Hence, obtaining patient consent was waived off. Ethical approval was waived by the Institutional Review Board of Seoul National University (IRB No. P01-202206-01-031).
Additional information
Publisher’s note
Springer Nature remains neutral with regard to jurisdictional claims in published maps and institutional affiliations.
Electronic supplementary material
Below is the link to the electronic supplementary material.
Rights and permissions
Open Access This article is licensed under a Creative Commons Attribution-NonCommercial-NoDerivatives 4.0 International License, which permits any non-commercial use, sharing, distribution and reproduction in any medium or format, as long as you give appropriate credit to the original author(s) and the source, provide a link to the Creative Commons licence, and indicate if you modified the licensed material. You do not have permission under this licence to share adapted material derived from this article or parts of it. The images or other third party material in this article are included in the article’s Creative Commons licence, unless indicated otherwise in a credit line to the material. If material is not included in the article’s Creative Commons licence and your intended use is not permitted by statutory regulation or exceeds the permitted use, you will need to obtain permission directly from the copyright holder. To view a copy of this licence, visit http://creativecommons.org/licenses/by-nc-nd/4.0/.
About this article

Cite this article
Kim, S., Ryu, B., Choi, M. et al. Data-driven prediction of cardiovascular and cerebrovascular diseases in a nationwide study. Sci Rep 15, 22585 (2025). https://doi.org/10.1038/s41598-025-94888-0
Received:
Accepted:
Published:
Version of record:
DOI: https://doi.org/10.1038/s41598-025-94888-0
