
Abstract
This study uses the World Health Organization’s AirQ+ model to assess the relationship between air pollution and mortality in Portugal from 2010 to 2021, focusing on the impact of the COVID-19 pandemic. By integrating AirQ+ with Linear Mixed Models, we analyzed long-term air pollution data and its health effects. Results indicate a significant decrease in \({\text{NO}}_{2}\) and \({\text{PM}}_{2.5}\) concentrations in 2020 and 2021 due to COVID-19 restrictions and reduced transportation emissions. Conversely, \({\text{O}}_{3}\) exposure slightly increased. The model estimates over 5000 annual deaths from \({\text{NO}}_{2}\) and \({\text{PM}}_{2.5}\) exposure and over 139 annual deaths from \({\text{O}}_{3}\)-related respiratory diseases for 2010–2021. Despite limitations like the need for better assessment of pollutant mixtures and climatic variables, the study shows a decrease in \({\text{NO}}_{2}\)-related disease burden during the pandemic. These trends reflect anomalies in mortality and pollution data rather than policy improvements. The study underscores the utility of AirQ+ in guiding public health strategies and tracking progress toward the 2030 Agenda, offering insights into reducing mortality and morbidity through decreased air pollutant exposure and highlighting the need for sustained, multidimensional pollution reduction efforts.
Introduction
In 2019, the combined effects of ambient (outdoor) air pollution and household air pollution were associated with 6.7 million premature deaths annually and was the 4th leading risk factor for early death worldwide, surpassed only by high blood pressure, tobacco use, and poor diet, demanding sustained and multidimensional endeavors to raise the attention of policymakers to its health hazards and their economic repercussions1,2,3.
The AirQ+ Model developed by the World Health Organization (WHO) estimates the mortality associated with acute and chronic exposures to air pollution by fine and coarse particulate matter (\({\text{PM}}_{2.5}\) and \({\text{PM}}_{10}\), respectively), nitrogen dioxide (\({\text{NO}}_{2}),\) ozone (\({\text{O}}_{3})\) and black carbon (BC)4,5,6. It provides valuable evidence that can assist national authorities in developing and implementing effective strategies to promote a healthy environment and ensure timely updates on national progress toward achieving the Sustainable Development Goals (SDG’s) outlined in the United Nations 2030 Agenda7,8. Despite the commitment of the various stakeholders, their efforts to report on the progress in the implementation of the 2030 Agenda in a timely manner have been insufficient and uneven across the world9. In Portugal, the corresponding reports for the period 2010–2021 do not include data on mortality rates attributed to household and ambient air pollution, on the grounds that the available data series are limited and irregular10,11.
In fact, we have reported an assessment of the spatial and temporal distribution of atmospheric pollution by \({\text{NO}}_{2}\), \({\text{PM}}_{2.5}\) and \({\text{O}}_{3}\), and associated mortality for the period 2010–2019 in the agglomerations and zones considered in Portugal for ambient air quality assessment and management purposes12. In that report, the AirQ+ Model was applied to public data retrieved from Portuguese governmental agencies, which were available to produce the required data series by any interested public or private institutions. As a further contribution to addressing the alleged lack of data, previous work has now been expanded to 2021, the last year with validated data from Statistics Portugal (INE) and the Portuguese Environment Agency (APA).
Extending the observation period of the relationship between air pollution and associated mortality, beyond the onset of the COVID-19 pandemic outbreak, raises several questions, particularly regarding the magnitude and timeliness of the potential effects of the pandemic on that relationship. Given the wide range of effects of COVID-19 on society in general, including the economic activity, which has been recognized as a relevant source of air pollution, it is conceivable that this pandemic may have an impact on the relationship between air pollution and mortality. Of course, while the effects of COVID-19 may manifest themselves within weeks, the health effects of air pollution may take years to manifest as chronic disease1. Nonetheless, evidence suggests that chronic exposure to air pollution may exacerbate vulnerability to acute respiratory infections, including COVID-1913,14, while also contributing to long-term risks of cardiovascular and respiratory diseases15,16, underscoring the relevance of examining chronic impacts even during a pandemic.
Recent research highlights the complex, bidirectional interaction between air pollution and COVID-19, with each factor influencing the mortality effects of the other. Studies17 show that air pollution exacerbates the severity and risk of death from COVID-19 by weakening immune defenses and increasing susceptibility to respiratory and systemic infections1. SARS-CoV-2—the virus that causes COVID-19—primarily affects the respiratory system, but also affects the cardiovascular and circulatory systems, exacerbating the risks in polluted environments1. Chronic health conditions such as diabetes, cardiovascular disease and chronic obstructive pulmonary disease, often associated with long-term exposure to pollution, further increase vulnerability to severe COVID-19 outcomes1. At the same time, the COVID-19 pandemic likely introduced systemic changes that affected pollution-related mortality. These include changes in access to health care, population mobility and exposure levels due to societal responses to the pandemic. Such factors may have altered the effect of air pollution on mortality17, highlighting COVID-19 as an important confounding factor. In Portugal, COVID-19 was the third leading cause of death in 2021, with 12,986 deaths attributed to it as the underlying cause, accounting for 10.4% of total deaths18.
This paper describes the application of the AirQ+ model in Portugal, from 2010 to 2021, extending our previous reports. In addition, the aims of this work also include the assessment of the impact of the COVID-19 pandemic on the relationship between air pollution and mortality in Portugal, as described by the AirQ+ model. To achieve this, time series forecasting models were employed. These models analyzed historical mortality data from the pre-COVID-19 era to predict mortality rates for the period 2020–2021. Specifically, we analyze whether observed mortality during the pandemic diverges from expected mortality, as predicted from historical data, to assess how the pandemic context influenced the established air pollution–mortality relationship.
Materials and methods
Assessing the human health impact using the AirQ+ model
The AirQ+ model (version 2.2) was employed to estimate the burden of specific health outcomes attributable to long-term exposure to air pollution from \({\text{NO}}_{2}\), \({\text{PM}}_{2.5}\), and \({\text{O}}_{3}\) among at-risk populations (aged 30 + years) across various municipalities in Portugal, covering the period from 2010 to 2021, following the same specifications as in previous work12. Briefly, the impact of long-term exposure to \({\text{PM}}_{2.5}\) on all natural causes of mortality was estimated in the population at risk. The analysis was based on a log-linear calculation method, with a relative risk (RR) value of \(1.062 \left( {95\% \;{\text{CI}} = 1.040, 1.083} \right)\) per \(10\;\upmu{\text{g}}/{\text{m}}^{3}\), at all levels of \({\text{PM}}_{2.5}\). The AirQ+ model was also used to estimate the health effects of \({\text{O}}_{3}\) on respiratory mortality in the population at risk. The quantity \(\text{SOMO}{35}_{\text{uncorrected}}/{\text{N}}_{\text{valid}}\) was entered as input in the model, as:
where the summation is yearly, \({C}_{i}\) is the daily maximum 8-h mean concentration over \(70\; \upmu {\text{g}}/{\text{m}}^{3}\), and \({\text{N}}_{{{\text{valid}}}}\) is the number of days with valid values. A relative risk coefficient of \(1.014{ }\left( 95\%\,{\text{CI}} = 1.005,{ }1.024 \right)\) per \(10\; \upmu {\text{g}}/{\text{m}}^{3}\) was considered for \({\text{O}}_{3}\). To estimate the health impact of \({\text{NO}}_{2}\) on all natural causes of mortality in the population at risk, the model was applied with a RR value of \(1.041{ }\left( 95\% \;{\text{ CI}} = 1.019,{ }1.064 \right)\) per \(10\;\upmu {\text{g}}/{\text{m}}^{3}\) annual average \({\text{NO}}_{2}\) and cut-off value of \(10\; \upmu {\text{g}}/{\text{m}}^{3}\).
For each pollutant, the RR and cut-off default values indicated above remained unchanged in all cases where the AirQ+ model was applied in this study.
Health and pollution data
The data set used in previous work12 was expanded to encompass population, health indicators, and air quality data at the municipal level for the years 2020 and 2021, sourced from the same official repositories. Population and health outcome data were acquired from PORDATA, the Database of Contemporary Portugal19, and included the number of deaths from all natural causes as well as deaths due to respiratory diseases (International Classification of Diseases (ICD-10): J00–J99) among individuals aged 30 years and older. COVID-19-related mortality data for Portugal, categorized by the month of death during 2020–2021, were sourced from databases available on the INE portal20.
Details on air pollution data collection are provided in prior studies12,21. Briefly, air pollution data include hourly levels of \({\text{NO}}_{2}\), \({\text{PM}}_{2.5}\), and \({\text{O}}_{3}\) recorded at multiple monitoring stations across various municipalities in Portugal as part of the Air Quality Network. Data for 2020–2021 were retrieved from the Online Database on Air Quality (QualAr) maintained by the Portuguese Environment Agency (APA)22. Additional information is provided in the Supplementary Material section.
Statistical methods
Time variations in mortality attributed to pollution (2010–2021)
The dataset used to estimate the environmental disease burden with AirQ+ was collected repeatedly within the same municipality from 2010 to 2021. This repeated data collection approach introduces potential correlations and variability in data variances, which must be accounted for in any analysis of trends over time. To address these challenges, Linear Mixed Models (LMM) were applied after determining an appropriate variance–covariance structure. These models were used to examine changes over time in air pollutant levels and the proportion of deaths attributable to these pollutants.
For analyzing temporal variations, the year was considered both as a repeated measure and as a fixed effect. Various covariance structures, including those assuming equal and unequal variances and correlations, were tested to determine the most suitable and efficient model. Model selection relied on information criteria such as Akaike (AIC), Hurvich-Tsai (AICC), Bozdogan (CAIC), and Bayesian Schwarz (BIC), with lower scores indicating superior fit. Significant differences were identified through post-hoc comparisons using the Bonferroni correction test.
Time series analysis
Separate time series models were developed for each air pollutant (\({\text{NO}}_{2}\) and \({\text{O}}_{3}\)) and each health outcome category (all-natural cause mortality and respiratory disease mortality). The analysis focused on selecting the best-fitting models for observed deaths from all natural causes and respiratory diseases in the adult population prior to the COVID-19 pandemic, with the goal of forecasting mortality trends for 2020–2021. Monthly data were used as the time unit for the analysis. The Augmented Dickey-Fuller (ADF) test was used to assess the stationarity of all series analyzed, an important assumption for time series modeling. After model identification and estimation, diagnostic checks applied to residuals and their autocorrelation coefficients were implemented to assess model adequacy and goodness of the fit.
For modeling purposes, the entire time series were divided into two periods: the historical or estimation period for model development (1 January 2015–31 December 2019), and the validation or forecast period (1 January 2020–31 December 2021), which was considered to verify how well the models developed for the pre-COVID-19 period fit the mortality data during the pandemic period.
The forecasts of each model were compared with the observed values to assess the impact of the pandemic on the long-term behavior of the mortality time series. This was performed using the LMM method with an unstructured variance–covariance matrix. The same approach was used to assess the impact of the pandemic on the quantities of interest used with AirQ+ , namely, to re-estimate the attributable proportion of deaths for the COVID-19 period of 2020–2021, specifically for \({\text{NO}}_{2}\) and \({\text{O}}_{3}\) pollutants.
Data analysis was carried out using SPSS (IBM SPSS Statistics, Version 29, Armonk, NY: IBM Corp). Time series analysis was conducted using the Time Series Modeler procedure.
Statistical significance was determined at the 5% level.
Results and discussion
Changes in air pollution levels over time and predicted health impacts
Table 1 shows the descriptive statistics of concentrations of air pollutants for 2020 and 2021. The results for the entire period (2010–2021) are presented in Table S.2. Figure 1 illustrates the yearly patterns of the mean levels of \({\text{NO}}_{2}\), \({\text{PM}}_{2.5}\) and \(\text{SOMO}35\), which is defined as \(\text{SOMO}{35}_{\text{uncorrected}}/{\text{N}}_{\text{valid}}\), used as input parameters for the AirQ+ model. Additionally, it presents the mean percentage of deaths attributed to exposure to each pollutant. These estimations were derived from all valid atmospheric data collected across 43 Portuguese municipalities for \({\text{NO}}_{2}\) and \({\text{PM}}_{2.5}\), and for 38 locations for \({\text{O}}_{3}\), from 2010 to 2021.

Mean values of indicators of atmospheric levels and estimates of attributable proportion of deaths over all municipalities in the observation period (2010–2021). Mean concentrations (lines), in µg/m3, of \({\text{NO}}_{2}\) (a), \({\text{PM}}_{2.5}\)(b), and \({\text{O}}_{3}\) (c) and mean AirQ + estimates of attributable proportion of deaths (bars), for each year, over all municipalities.
Linear Mixed Models applied to the analysis of time trends of the collected atmospheric data and AirQ+ estimates of attributable proportion of deaths in each municipality have shown that homogeneous variance–covariance matrices, namely the autoregressive first order and the autoregressive moving average matrices provide the best fit to the data.
The significance of the fixed effects (year as a categorical variable) in each LMM employed to analyze annual variations in pollutant levels and their attributable proportions of mortality was assessed using Type III Tests of Fixed Effects. All variables yield p-values \(<0.001\), indicating a strong influence of the year on pollutant levels and their attributable proportions. The pollutant levels and attributable proportions are described by the LMM equations shown in Table 2, in which the intercept represents the average value in the reference year (2010), while coefficients for each year (\({Y}_{2011},\dots ,{Y}_{2021}\)) indicate the deviation from the reference year. Positive coefficients indicate higher values compared to 2010, and negative coefficients indicate lower values.
Using the \({\text{NO}}_{2}\) equation as an example, the intercept \((18)\) represents the average \({\text{NO}}_{2}\) concentration (in µg/m3) in 2010. The coefficient for 2012 \((-1.2)\) indicates that the concentration was \(1.2\) µg/m3 lower in 2012 compared to 2010, while for 2021 the coefficient (\(-4.7\)) reflects a substantial reduction of \(4.7\) µg/m3 from the baseline. To supplement the LMM equations, all pairwise comparisons between years were performed for each variable to assess the statistical significance of differences. The complete results are presented in the supplementary material (Table S.3), providing detailed insight into year-to-year variations. On a cautionary note, the significance of the LMM coefficient estimates do not necessarily align closely with the significance of pairwise comparisons in Table S.3. This is because the former are unadjusted for multiple calculations, while the latter are adjusted to control the familywise error rate, which make it harder for pairwise comparisons to achieve significance. Nevertheless, a good agreement between significant results in both tables is observed. For example, the reduction in \({\text{NO}}_{2}\) levels from 2010 to 2013, estimated at \(3.3\) µg/m3 in the LMM equation, corresponds to a significant pairwise comparison between those years.
For \({\text{NO}}_{2}\) concentrations (Fig. 1a) in the period 2010–2021, there were significant differences between each year (from 2017 to 2019, excluding 2018), and year 2020, and significant differences between each year (from 2017 to 2019), and year 2021, with non-significant differences between 2020 and 2021 (Table S.3). \({\text{NO}}_{2}\), primarily emitted by the energy sector, especially the transport subsector, has been the dominant contributor to air pollution in Portugal’s major cities in recent years. The significant decline in \({\text{NO}}_{2}\) levels is likely linked to COVID-19 lockdowns, which sharply reduced atmospheric pollutant emissions and improved air quality in high-traffic areas23. Additionally, emissions from energy industries saw the largest drop between 2020 and 2021, driven by a shift to renewable energy (66% of production in 2021) and the complete cessation of coal use in electricity generation in 202124. The temporal trend of \({\text{NO}}_{2}\)-attributable deaths align closely with \({\text{NO}}_{2}\) levels, reflecting similar scales and statistically significant changes.
For \({\text{PM}}_{2.5}\) concentrations (Fig. 1b), in the period 2010–2021, there were significant differences between each year (from 2010 to 2019, excluding 2014 and 2016), and year 2020, and significant differences between each year (from 2010 to 2019, excluding 2014, 2016, 2018 and 2019), and year 2021, with non-significant differences between 2020 and 2021 (Table S.3). \({\text{PM}}_{2.5}\) emissions primarily originate from commercial, institutional, residential, industrial, manufacturing, construction, and transportation sectors25. The European Environment Agency (EEA) also identifies agricultural practices, wildfires, and North African dust as contributors26. Although COVID-19 lockdowns improved air quality, the reduction in \({\text{PM}}_{2.5}\) levels was less pronounced than \({\text{NO}}_{2}\), due to its diverse sources and meteorological influences23. The slight rise in concentrations from 2020 to 2021 likely reflects the lifting of lockdown restrictions and resumption of economic activity. Trends in \({\text{PM}}_{2.5}\)-attributable deaths mirror concentration patterns over time, as expected.
For the \(\text{SOMO}35\) indicator of \({\text{O}}_{3}\) exposure (Fig. 1c), there was a slightly, yet not statistically significant increase in the period 2020–2021 when compared with 2019. Tropospheric \({\text{O}}_{3}\) concentration patterns and annual fluctuations are complex, influenced by proximity to \({\text{O}}_{3}\) precursor sources (\(\text{NO}_{x}\) and VOCs), geography, and meteorological conditions. Despite the COVID-19 pandemic, \({\text{O}}_{3}\) levels did not decrease like other pollutants, as it is a secondary pollutant formed under high atmospheric stability and solar radiation, particularly in summer23. The rise in \({\text{O}}_{3}\) levels alongside significant \({\text{NO}}_{2}\) reductions in 2020–2021 reflects reduced \(\text{NO}\) availability limiting \({\text{O}}_{3}\) removal via titration27. The temporal trend of respiratory disease-related deaths linked to \({\text{O}}_{3}\) exposure mirrors these patterns, despite challenges in attributing emission sources to observed \({\text{O}}_{3}\) concentrations28.
A recent study29 discusses the complex challenge of managing ozone pollution, emphasizing the need for strategies beyond traditional air pollution control methods. It highlights the importance of addressing climate change, which affects ozone formation, and suggests measures such as controlling wildfires and reducing vehicle emissions to mitigate ozone levels. Additionally, selecting low biogenic BVOCs emission plants for urban green spaces can help improve air quality and decrease ozone precursors.
These findings demonstrate the effectiveness of the AirQ+ model and LMM data analysis in detecting temporal health impacts from pollutants. The methodology identifies changes from events like pandemic and emission reduction efforts, aiding authorities in setting and evaluating goals to minimize health impacts from air pollution, even at low exposure levels, despite source attribution challenges.
Excess incidence attributable to \({\text{NO}}_{2}\), \({\text{PM}}_{2.5}\) and \({\text{O}}_{3}\) in the population at risk
Table 3 presents the number of premature deaths from natural causes attributed to exposure to \({\text{NO}}_{2}\) and \({\text{PM}}_{2.5}\), along with respiratory illnesses associated with \({\text{O}}_{3}\) exposure, per 100,000 population at risk for the years 2020 and 2021. These figures were determined using two approaches: first, by averaging AirQ+ estimates of excess cases across all municipalities included in this analysis, and second, by applying AirQ+ directly with the total population at risk and weighted average atmospheric concentrations from the full dataset as inputs. Results covering the entire period from 2010 to 2021 are detailed in Table S.4.
The estimated excess incidence shows a reasonable level of consistency between the two methods for \({\text{PM}}_{2.5}\) and \({\text{O}}_{3}\), but not for \({\text{NO}}_{2}\). For \({\text{NO}}_{2}\), the annual weighted average is heavily influenced by elevated concentrations in larger urban centers. As a result, AirQ+ estimates for the entire country tend to be higher compared to the arithmetic average of model estimates across municipalities, where equal weight is assigned to each municipality. Nevertheless, estimates derived from the arithmetic means are also compromised by concerns over the unrepresentativeness of the monitors, which limits their ability to produce accurate country-level estimates.
These discrepancies are considered here to illustrate the methodological challenges faced by air quality studies conducted by international agencies in Europe. Indeed, research employing the entire country as the unit of analysis, without sub-national disaggregation, may potentially yield an imperfect understanding of the true extent of the environmental burden of disease. Moreover, these agencies assess the health effects of \({\text{NO}}_{2}\), \({\text{PM}}_{2.5}\) and \({\text{O}}_{3}\), using endpoints, population age groups, and cut-off values that diverge slightly from those proposed by the “Health risks of air pollution in Europe” (HRAPIE) project30 for specific pollutant-outcome pairs.
The annual number of premature deaths tends to be higher when \({\text{PM}}_{2.5}\) is used as a marker for the air pollution mixture, as shown in Table S.4, with the exception of the period 2017–2018. Given the preference for using the higher of the two individual pollutant estimates (\({\text{NO}}_{2}\) and \({\text{PM}}_{2.5}\)) to assess the effects of their mixtures31, it can be concluded that the annual number of premature deaths attributable to these mixtures in Portugal ranged from 5,071 to 6,413 deaths per year over the period 2010–2021. Additionally, the estimated annual premature deaths from respiratory diseases in the population at risk ranged from 139 cases in 2021 to 242 cases in 2013, based on AirQ+ modeling.
Impact of the COVID-19 pandemic on the long-term assessment of the relationship between atmospheric pollution and mortality in Portugal
A reliable long-term assessment of the environmental burden of disease using the AirQ+ model requires long time series data on mortality and air pollution levels, from which the quantities of interest are calculated to generate model estimates. As noted above, the estimates of the proportion of deaths attributable to exposure to a given pollutant are determined by the baseline mortality and average concentrations of the pollutant, both of which are required as model inputs. Conceivably, any sudden disturbance in the abovementioned time series due to unexpected factors, such as the COVID-19 pandemic and its associated increased mortality and reduced air pollution levels, could affect the AirQ+ inputs and estimates to an extent that does not exclusively reflect the adverse effects of air pollution on human health.
In this scenario, the expected baseline mortality from all natural causes and respiratory diseases in the population at risk, as well as the expected atmospheric levels of \({\text{NO}}_{2}\) and \({\text{O}}_{3}\) for the COVID-19 period (2020–2021), were calculated based on the observation of the available time series in an extended pre-COVID-19 period (1 January 2015–31 December 2019). The aim was to assess the impact of the pandemic on the quantities of interest used with AirQ+, and ultimately, on the AirQ+ estimates of the environmental burden of disease during the COVID-19 period of 2020–2021. This assessment focused specifically on the effects of \({\text{NO}}_{2}\) and \({\text{O}}_{3}\) exposure on mortality from all natural causes and respiratory diseases in the population at risk. It is noteworthy that \({\text{PM}}_{2.5}\) series was not included in this assessment because the database for \({\text{PM}}_{2.5}\) in Portugal during the considered period is incomplete, and not all monitoring stations measure this pollutant. Some stations measure \({\text{PM}}_{10}\) instead of \({\text{PM}}_{2.5}\). To avoid relying on estimates based on the correction factor described in Sect. 1.1 (Supplementary Material), we choose to use the pollutant with the most complete and continuous time series data, \({\text{NO}}_{2}\). This decision was also influenced by the wide range of sources contributing to \({\text{PM}}_{2.5}\) levels and the significant impact of meteorological conditions on its measured concentrations.
Therefore, time series analysis was performed to select the best fitting model for the observed number of deaths from all natural causes and from diseases of the respiratory system in the adult population prior to the COVID-19 era, and to forecast the mortality from each of those causes for the period 2020–2021.
Figure 2 shows the monthly number of deaths from all natural causes and respiratory diseases observed between 2015 and 2021, and the monthly atmospheric concentrations of \({\text{NO}}_{2}\) and \({\text{O}}_{3}\) in the same period in Portugal. Examination of Fig. 2 reveals important patterns in the observed data during the pre-COVID-19 period, such as the marked seasonal pattern of all the series, with a suggested periodic behavior occurring every 12 months. This seasonality is evidenced by the highest mortality and atmospheric concentrations of \({\text{NO}}_{2}\) in the winter months and secondary peaks in the summer, while the seasonality of the atmospheric concentrations of the \({\text{O}}_{3}\) series is evidenced by higher concentrations in the summer and secondary peak in the winter. Taken together, these observations suggest that none of the series are stationary or in statistical equilibrium, an important data requirement for the development of forecasting models. However, the application of the ADF test has shown that all the series can be made stationary by appropriate differencing of the data, as suggested by the significant results of the test \(\left(p<0.01\right)\), which guarantees the appropriateness of the modeling procedures.
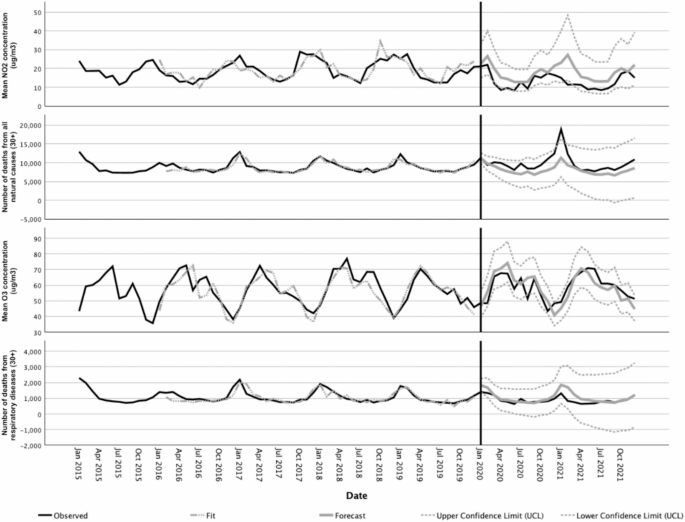
Observed and forecasted values for the time series of \({\text{NO}}_{2}\) and \({\text{O}}_{3}\) concentrations (in µg/m3) and different mortality causes in the period 2015–2021.
In line with these observations, the Time Series Modeler procedure has selected Seasonal Auto-Regressive Integrated Moving Average (ARIMA) models as the best models to fit the observed mortality time series prior to the COVID-19 era (see ARIMA models description in the Supplementary Material). Another potential approach could have been the use of contemporary techniques like machine learning (ML). The distinction between classical statistical techniques like ARIMA and ML approaches is nuanced. While ML models excel at capturing complex, non-linear relationships in data, they often require larger datasets than the one used in this study and tend to sacrifice interpretability. In contrast, ARIMA has remained a widely used and effective tool for forecasting in contexts with limited data, as highlighted in recent comparative reviews32,33.
Forecasts for mortality and atmospheric concentrations of \({\text{NO}}_{2}\) and \({\text{O}}_{3}\) and their confidence limits according to the selected models for the COVID-19 period are shown in Fig. 2. The predictions of each ARIMA model were compared with the observations to assess the impact of the pandemic on the relationship between pollution and mortality during this period. This was done using the LMM approach with an unstructured variance–covariance matrix. For \({\text{NO}}_{2}\), the observed values were significantly lower \((p<0.001)\) than the predicted values. For \({\text{O}}_{3}\) concentrations, the model predictions were not significantly different from the observed values \((p=0.849)\). For deaths from all natural causes the observed values were significantly higher than the predicted values \((p<0.001)\), whereas for deaths from respiratory diseases the observed values were significantly lower than the predicted values \((p=0.004)\). These outcomes are consistent with the plotted data in Fig. 2 and are taken here as evidence that the long-term behavior of the mortality time series for all natural causes and respiratory diseases changed significantly during the COVID-19 period covered in this study.
These findings are further corroborated by numerous studies that consistently highlight the significant impact of the COVID-19 pandemic on air quality and mortality patterns. For instance, global and regional analyses have reported substantial reductions in \({\text{NO}}_{2}\) and \({\text{PM}}_{2.5}\) concentrations during lockdown periods, while \({\text{O}}_{3}\) levels increased as \(\text{NO}_{x}\) emissions declined34,35. Additionally, notable variations in mortality rates were observed, with some regions experiencing higher-than-expected deaths from all natural causes, while others saw decreases in mortality from respiratory diseases36. These studies align with and reinforce our findings, emphasizing the role of pandemic-induced behavioral and environmental changes in shaping these outcomes.
The impact of these changes on the AirQ+ estimates of the environmental burden of disease attributable to \({\text{NO}}_{2}\) and \({\text{O}}_{3}\) exposure during the COVID-19 period was assessed. The observed versus expected values of the attributable proportion of deaths (AP) and the excess incidence (EI) of deaths from natural causes attributable to \({\text{NO}}_{2}\) and from respiratory diseases attributable to \({\text{O}}_{3}\), per 100,000 population at risk in Portugal were calculated and are shown in Table 4.
Taken together, the data presented in Fig. 2 and shown in Table 4 suggest that the AirQ+ estimates of the attributable proportion and the excess incidence of deaths from natural causes per 100,000 population at risk for the COVID-19 period suggest a steady decline in the environmental burden of disease in association with \({\text{NO}}_{2}\) exposure. Those estimates, however, should be perceived as singularities due to the severe disruption of the mortality and atmospheric pollution time series data in that period, instead of a result of the implementation of policies targeting a better health and environment in Portugal.
In fact, there is no evidence that living conditions that have an impact on health, as well as the quality of health services in Portugal, have suddenly improved in 2020–2021, to the point of justifying the significant decrease in the environmental burden of disease due to \({\text{NO}}_{2}\) exposure. In contrast, data from 2021 show that during the first 12 months of the COVID-19 pandemic, the proportion of unmet medical care needs have increased in Portugal (and in most Organization for Economic Cooperation and Development (OECD) countries), with an estimated percentage of 34% in Portugal for the first 12 months of the pandemic, which is higher than the average of the OECD (22%)37.
These observed trends in mortality figures and their future evolution should be analyzed in the light of the challenges faced by the Portuguese National Health System following the COVID-19 outbreak. In fact, the deficiencies of the health services in managing non-COVID cases, coupled with public fear of the virus, caused a decrease in follow-up consultations, screening tests and diagnoses as well as postponed surgeries. Consequently, urgent healthcare seeking may have been delayed and advanced stage diagnoses may have increased, threatening treatment effectiveness and raising short to medium-term patient mortality.
The AirQ+ model, is a tool designed to estimate the health effects of air pollution. While it offers robust quantitative insights, its utility in assessing progress towards the Sustainable Development Goals (SDGs)—notably SDG 3 (Good Health and Well-being) and SDG 11 (Sustainable Cities and Communities)—has been undermined by the unprecedented challenges posed by COVID-19.
Health impacts were further complicated by overlapping risks from COVID-19 and air pollution, making it difficult to isolate specific effects, particularly for vulnerable populations. Respiratory deaths attributable to COVID-19, included in all-cause mortality data, could mask the contribution of air pollution to respiratory and cardiovascular outcomes. Additionally, the concentration–response functions (CRFs) utilized in this study, as recommended by the WHO for the AirQ+ model, do not account for the disproportionate impact of COVID-19 on respiratory mortality, resulting in potentially biased estimates. Future research should explore the development of modified CRFs that incorporate pandemic-related mortality dynamics.
Data collection challenges, including monitoring disruptions and delays in reporting, compromised the model’s reliability. Behavioral and economic shifts, like reduced industrial activity introduced anomalies not accounted for by the AirQ+ model. Additionally, its narrow focus on air pollution health impacts fails to address broader SDG dimensions such as healthcare access and economic resilience, making it less relevant in capturing holistic progress.
To continue serving as a useful tool for assessing SDG progress, the AirQ+ model could benefit from recalibration to address limitations highlighted by the COVID-19 pandemic. Adjusting for adaptive baselines may help enhance its relevance. Additionally, linking AirQ+ outputs with broader indicators of resilience and equity might provide a more comprehensive view of progress toward sustainable development. These refinements have the potential to improve the AirQ+ model’s effectiveness in the post-COVID context.
In summary, sudden disturbances, such as the COVID-19 pandemic, which increased mortality from multiple factors and reduced pollution levels due to lockdown, have the potential to distort the relationship between air pollution and mortality, and thus, the true impact of air pollution on health. Therefore, caution is advised when using long time series on mortality and air pollution levels to generate accurate data to support effective policies and track progress toward the SDGs.
Conclusions
The AirQ+ model results indicate a significant reduction in \({\text{NO}}_{2}\) and \({\text{PM}}_{2.5}\) concentrations in 2020 and 2021, with a slight, nonsignificant increase in \({\text{O}}_{3}\) exposure during the same period. These changes are likely influenced by pandemic-related restrictions, emission sources, and meteorological factors. The model estimates over 5000 annual deaths due to \({\text{NO}}_{2}\) and \({\text{PM}}_{2.5}\) exposure, and over 139 annual deaths from respiratory diseases related to \({\text{O}}_{3}\) exposure during 2010–2021.
Using pre-COVID-19 data, the study predicted atmospheric and mortality values during the pandemic, focusing on \({\text{NO}}_{2}\) and \({\text{O}}_{3}\) exposure in Portugal. It revealed higher than expected mortality from all natural causes and lower than expected mortality from respiratory diseases and \({\text{NO}}_{2}\) levels during the pandemic. These findings influenced the assessment of the disease burden from \({\text{NO}}_{2}\) exposure using the AirQ+ model.
The findings suggest that the observed decline in the environmental burden of disease in 2020–2021 resulted from pandemic disruptions rather than public health or environmental policy improvements. The Portuguese National Health System’s challenges during the pandemic may have contributed to these trends.
Despite these factors and limitations, AirQ+ remains a valuable tool for guiding public health strategies, tracking progress towards the 2030 Agenda, and offering insights into potential reductions in mortality and morbidity from decreased air pollutant exposure.
Data availability
Data is provided within the manuscript or supplementary information files.
References
Health Effects Institute. State of Global Air Report 2020, State of Global Air. https://www.stateofglobalair.org/resources/report/state-global-air-report-2020 (2020).
Health Effects Institute. Air Quality and Health in Cities Report, State of Global Air. https://www.stateofglobalair.org/resources/report/air-quality-and-health-cities-report (2022).
GBD 2019 Risk Factors Collaborators. Global burden of 87 risk factors in 204 countries and territories, 1990–2019: A systematic analysis for the Global Burden of Disease Study 2019. Lancet 396, 1223–1249 (2020).
WHO Regional Office for Europe. AirQ+ software tool for health risk assessment of air pollution. https://www.who.int/europe/tools-and-toolkits/airq---software-tool-for-health-risk-assessment-of-air-pollution (2022).
Rovira, J., Domingo, J. L. & Schuhmacher, M. Air quality, health impacts and burden of disease due to air pollution (PM10, PM2.5, NO2 and O3): Application of AirQ+ model to the Camp de Tarragona County (Catalonia, Spain). Sci. Total Environ. 703, 135538 (2020).
Al-Hemoud, A., Gasana, J., Al-Dabbous, A., Al-Shatti, A. & Al-Khayat, A. Disability adjusted life years (DALYs) in terms of years of life lost (YLL) due to premature adult mortalities and postneonatal infant mortalities attributed to PM2.5 and PM10 exposures in Kuwait. Int. J. Environ. Res. Public Health 15, 2609 (2018).
United Nations. Transforming Our World: The 2030 Agenda for Sustainable Development. Resolution Adopted by the General Assembly on 25 September 2015. (2015).
United Nations. The Sustainable Development Goals Report 2023. https://unstats.un.org/sdgs/report/2023/The-Sustainable-Development-Goals-Report-2023.pdf (2023).
United Nations. The sustainable development Goals Report 2020. https://sdgs.un.org/sites/default/files/2020-09/The-Sustainable-Development-Goals-Report-2020.pdf (2020).
Instituto Nacional de Estatística. Objectivos de Desenvolvimento Sustentável—Agenda 2030: Indicadores para Portugal (2010–2019). https://www.ine.pt/xportal/xmain?xpid=INE&xpgid=ine_publicacoes&PUBLICACOESpub_boui=434725779&PUBLICACOESmodo=2 (2020).
Instituto Nacional de Estatística. Objectivos de Desenvolvimento Sustentável—Agenda 2030: Indicadores para Portugal (2015–2021). https://www.ine.pt/xurl/pub/31592402 (2022).
Brito, J., Bernardo, A. & Gonçalves, L. L. Atmospheric pollution and mortality in Portugal: Quantitative assessment of the environmental burden of disease using the AirQ+ model. Sci. Total Environ. 815, 152964 (2022).
Wu, X., Nethery, R. C., Sabath, M. B., Braun, D. & Dominici, F. Air pollution and COVID-19 mortality in the United States: Strengths and limitations of an ecological regression analysis. Sci. Adv. 6, eabd4049 (2020).
Domingo, J. L. & Rovira, J. Effects of air pollutants on the transmission and severity of respiratory viral infections. Environ. Res. 187, 109650 (2020).
Pope, C. A. et al. Cardiovascular mortality and long-term exposure to particulate air pollution. Circulation 109, 71–77 (2004).
World Health Organization. WHO Global Air Quality Guidelines: Particulate Matter (PM2.5 and PM10), Ozone, Nitrogen Dioxide, Sulfur Dioxide and Carbon Monoxide. https://www.who.int/publications/i/item/9789240034228 (2021).
Mehmood, K. et al. The impact of COVID-19 pandemic on air pollution: A global research framework, challenges, and future perspectives. Environ. Sci. Pollut. Res. 29, 52618–52634 (2022).
Instituto Nacional de Estatística. Causas de morte 2021. https://www.ine.pt/xportal/xmain?xpid=INE&xpgid=ine_destaques&DESTAQUESdest_boui=594417880&DESTAQUESmodo=2 (2023).
PORDATA. PORDATA—Estatísticas, gráficos e indicadores. https://www.pordata.pt/ (2023).
Instituto Nacional de Estatística. Estatísticas da Saúde: 2022. https://www.ine.pt/xurl/pub/439489924 (2024).
Brito, J., Bernardo, A., Zagalo, C. & Gonçalves, L. L. Quantitative analysis of air pollution and mortality in Portugal: Current trends and links following proposed biological pathways. Sci. Total Environ. 755, 142473 (2021).
APA. QualAR—Qualidade do AR. https://qualar.apambiente.pt/ (2023).
APA. Relatório do Estado do Ambiente 2020/21. https://sniambgeoviewer.apambiente.pt/GeoDocs/geoportaldocs/rea/REA2020/REA2020.pdf (2021).
Teresa Costa Pereira et al. Portuguese National Inventory Report on Greenhouse Gases, 1990–2021. https://apambiente.pt/sites/default/files/_Clima/Inventarios/20230404/NIR202315%20April.pdf (2023).
European Environment Agency, González Ortiz, A., Guerreiro, C. & Soares, J. Air Quality in Europe—2020 Report. (Publications Office, 2020). https://doi.org/10.2800/786656.
European Environment Agency. Air Quality in Europe—2019 Report. (Publications Office, 2019). https://doi.org/10.2800/822355.
Jhun, I., Coull, B. A., Zanobetti, A. & Koutrakis, P. The impact of nitrogen oxides concentration decreases on ozone trends in the USA. Air Qual. Atmos. Health 8, 283–292 (2015).
Monks, P. S. et al. Tropospheric ozone and its precursors from the urban to the global scale from air quality to short-lived climate forcer. Atmos. Chem. Phys. 15, 8889–8973 (2015).
Chen, Z.-Y. et al. Population exposure to multiple air pollutants and its compound episodes in Europe. Nat. Commun. 15, 2094 (2024).
WHO Regional Office for Europe. Health risks of air pollution in Europe—HRAPIE project New emerging risks to health from air pollution—results from the survey of experts. https://iris.who.int/bitstream/handle/10665/108632/WHO-EURO-2013-6696-46462-67326-eng.pdf?sequence=1 (2013).
COMEAP. Associations of long-term average concentrations of nitrogen dioxide with mortality. A report by the Committee on the Medical Effects of Air Pollutants. https://assets.publishing.service.gov.uk/media/5b76d41040f0b643410888e5/COMEAP_NO2_Report.pdf (2018).
Makridakis, S., Spiliotis, E. & Assimakopoulos, V. Statistical and Machine Learning forecasting methods: Concerns and ways forward. PLoS ONE 13, e0194889 (2018).
Kontopoulou, V. I., Panagopoulos, A. D., Kakkos, I. & Matsopoulos, G. K. A review of ARIMA vs. machine learning approaches for time series forecasting in data driven networks. Future Internet 15, 255 (2023).
Kumar, S. Insights on air pollution during COVID-19: A review. Aerosol Sci. Eng. 7, 192–206 (2023).
Bakola, M., Hernandez Carballo, I., Jelastopulu, E. & Stuckler, D. The impact of COVID-19 lockdown on air pollution in Europe and North America: A systematic review. Eur J. Public Health 32, 962–968 (2022).
Islam, N. et al. Excess deaths associated with covid-19 pandemic in 2020: Age and sex disaggregated time series analysis in 29 high income countries. BMJ n1137 https://doi.org/10.1136/bmj.n1137 (2021).
Direção-Geral da Saúde. Saúde Sustentável: de tod@s para tod@s. https://pns.dgs.pt/files/2022/03/PNS-21-30_Versao-editada-1_Final_DGS.pdf (2022).
Acknowledgements
First author work is funded by National Funds through the FCT—Fundação para a Ciência e a Tecnologia, I.P., under the scope of the studentship UI/BD/154565/2023. The authors thank FCT/MCTES for the financial support to CiiEM (10.54499/UIDB/04585/2020) through national funds.
Author information
Authors and Affiliations
Contributions
All authors conceived and designed the study; J.S. and A.B. assembled input data; J.B. and J.S. analyzed output data and prepared the manuscript; all authors reviewed and edited the manuscript.
Corresponding author
Ethics declarations
Competing interests
The authors declare no competing interests.
Additional information
Publisher’s note
Springer Nature remains neutral with regard to jurisdictional claims in published maps and institutional affiliations.
Electronic supplementary material
Below is the link to the electronic supplementary material.
Rights and permissions
Open Access This article is licensed under a Creative Commons Attribution-NonCommercial-NoDerivatives 4.0 International License, which permits any non-commercial use, sharing, distribution and reproduction in any medium or format, as long as you give appropriate credit to the original author(s) and the source, provide a link to the Creative Commons licence, and indicate if you modified the licensed material. You do not have permission under this licence to share adapted material derived from this article or parts of it. The images or other third party material in this article are included in the article’s Creative Commons licence, unless indicated otherwise in a credit line to the material. If material is not included in the article’s Creative Commons licence and your intended use is not permitted by statutory regulation or exceeds the permitted use, you will need to obtain permission directly from the copyright holder. To view a copy of this licence, visit http://creativecommons.org/licenses/by-nc-nd/4.0/.
About this article

Cite this article
Simões, J., Bernardo, A., Lima Gonçalves, L. et al. Assessment of air pollution and mortality in Portugal using AirQ+ and the effects of COVID-19 on their relationship. Sci Rep 15, 12862 (2025). https://doi.org/10.1038/s41598-025-97704-x
Received:
Accepted:
Published:
Version of record:
DOI: https://doi.org/10.1038/s41598-025-97704-x
