
Abstract
Heart disease is one of the major causes of death worldwide, and the traditional diagnostic procedures typically cause delays in treatment, particularly in low-resource regions. In this article, we propose a novel IoT-based Quantum Kernel-Enhanced Sardine Diffusion Attention Network (Qua-KSar-DCK-ArNet) for real-time prediction of heart disease. The system is capable of continuously monitoring heart-related data such as ECG and heart rate via IoT sensors. Quantum Clustering with k-Means is applied to cluster the data, and Z-score Min–Max Normalization is applied for preprocessing. Fast Point Transformer is utilized to identify salient features. The Qua-KSar-DCK-ArNet model, a combination of quantum and classical deep learning methods, classifies the data for predicting the risk of heart disease. The system is fast and accurate, with an accuracy of 99%, significantly improving patient outcomes, especially in resource-scarce regions.
Introduction
Heart disease claims the lives of more than three million people a year and has been the cause of 53% of deaths in the last 5 years1. Obesity, sugar, cholesterol, and high blood pressure are some causes. Improved treatment and death prevention are possible with early detection. Artificial intelligence, neural networks, and machine learning are some technologies used in research to forecast cardiac disease2,3. However, machine learning cannot see data in three dimensions and needs many data. Physicians who use real-time monitoring systems get better results, and IoT-based prediction allays worries about security and privacy. This service is also compatible with mobile applications for earlier prediction.Many industries, including industry, healthcare, agriculture, and urban areas, are utilising the Internet of Things (IoT)4,5. The Internet of Things (IoT) provides practical, reasonably priced, and ecologically friendly solutions, such as wireless sensor networks, smart mobile devices, and identification procedures.
It might lengthen equipment lifespans, optimise resource scheduling, and decrease equipment unavailability6,7. Through remote patient monitoring and the ability to store patient condition histories in databases, IoT also makes early disease detection and diagnosis possible. To tackle challenges and trends in the healthcare sector, researchers are exploring the use of IoT in healthcare8,9. For example, deep learning methods have been employed to detect heart disease, a complex condition that requires careful management10. Heart disease is the leading cause of death globally and is linked to various behavioural risk factors.Congenital heart disease (CHD) prevention and monitoring are being revolutionised by the Internet of Things (IoT). IoT-based solutions link medical equipment to the internet to collect background data on the surroundings and health of a patient11,12.
Compared to conventional testing procedures, this data can be utilised to follow changes, detect abnormalities, and provide quick diagnosis, potentially saving lives.Patients with Congenital Heart Disease (CHD) have a better long-term prognosis because of wearable sensors. Continuous monitoring is made possible by IoT-based technologies, which help physicians spot issues early13,14. Machine learning algorithms examine patient data to find risk variables. While telemedicine improves accessibility and patient care, remote monitoring lowers the number of doctor and hospital visits.Lengthy short-term memory (LSTM), appropriate for processing and forecasting crucial events in time series with lengthy intervals and delays, is used in the study for CVD research. However, due to varying time intervals, ordinary LSTM cannot successfully learn essential components of a patient’s medical state in the medical industry15.
Novelty and contribution
The Novelty and contribution of this paper is given below:
-
This manuscript proposes Quantum Kernel-Enhanced Sardine Diffusion Attention Network for Heart Disease Prediction in IoT-Based Smart Health Monitoring (Qua-KSar-DCK-ArNet).
-
Implement Quantum Clustering with k-Means to categorize heart-related data into distinct clusters based on disease risk factors, enhancing the organization and analysis of patient information. This method enhances predictive accuracy and enables focused interventions for managing heart disease within healthcare environments.
-
To preprocess heart-related data using the Z-score Min–Max normalization technique, ensuring improved data quality and consistency. This approach effectively scales the data, which helps improve model performance and accuracy in predicting heart disease, all while preserving the integrity of the underlying information for analysis.
-
To classify processed heart-related data by creating the Quantum Kernel Sardine Diffusion Classical Kernel Attention Network (Qua-KSar-DCK-ArNet).This novel method combines the Quantum–Classical Convolutional Neural Network (Q2CNN) with the Diffusion Kernel Attention Network (DKAN), optimizing parameters using the Sardine Optimization Algorithm (SOA) to enhance heart disease prediction accuracy.
-
Integration of cloud storage for secure, scalable, and accessible storage of patient data, enabling healthcare providers to access diagnostic results remotely.
-
Facilitation of remote diagnosis by sending detected TB data directly to healthcare professionals, accelerating response time and improving patient care in underserved regions.
The rest of the manuscript is organized as follows: Section “Literature survey” provides a literature review, Section “Proposed methodology” details the proposed technique, Section “Result and discussion” summarizes the findings, and Section “Discussion” closes with future studies. The Research work organization is given in Fig. 1.

Research work organization.
Literature survey
The papers related to Smart Health Monitor for Early Heart Disease Prediction: An IoT-Based Patient Monitoring System using Deep Learning Methods are given below:
In 2024, Yenurkar et al.16 introduced an ambulatory blood pressure monitoring (IABPM) systemfor Smart Health monitoring for early heart disease prediction of IoT-based patients. A cutting-edge IoT ambulatory blood pressure monitoring system can offer real-time blood pressure, systolic, diastolic, and pulse rate measurements at predetermined intervals. The system employs machine learning methods such as Naïve Bayes, K-Nearest Neighbors, random forest, decision tree, and Support Vector Machine to predict the early warning score for CHD. The system’s accuracy in forecasting blood pressure, a critical component of real-time intensive care for congestive heart failure, has reached 99.44%.
In 2023, Umer et al.17 introduced an Extra Tree Classifier-Convolutional Neural Network (ET-CNN) for Smart Health monitoring for early heart disease prediction of IoT-based patients. Due to the COVID-19 pandemic’s severe effects on healthcare, intelligent health monitoring systems have become more popular. Artificial intelligence (AI) and the Internet of Things (IoT) have transformed data collecting and communication. The activities of cardiac patients are monitored and reported using IoT and AI-based technologies in this study. An ensemble model called ET-CNN achieved an accuracy score of 0.9524.
In 2024, Alzakari et al.18 introduced a Bidirectional Long-Short-Term Memory (Bi-LSTM) for a Smart Health Monitor to predict early heart disease in IoT-based patients. The development of medical technology has revolutionized remote healthcare monitoring, especially in managing chronic conditions like heart disease and high blood pressure. A novel approach integrates ECD from comprehensive medical records and physical data from patients’ routine monitoring with regular medical monitoring.
In 2023, Almujally et al.19 introduced a Multilayer Perceptron Neural Network (MPNN) for Smart Health monitoring for early heart disease prediction of IoT-based patients.The research centres on a health monitoring system designed to track the activities of heart patients and diagnose illnesses through AI and IoT technology. The system enables real-time monitoring and disease classification by gathering data from various sources with intelligent sensors and AI. Experimental results demonstrate the system’s effectiveness, highlighting its potential to improve healthcare, especially during the challenges posed by COVID-19.
In 2023, Akhbarifar et al.20 introduced a Body Area Network and Personal Area Network (BAN-PAN) for Smart Health monitoring for early heart disease prediction of IoT-based patients. The COVID-19 pandemic has led to a surge in the need for remote patient screening and monitoring. However, the presence of sensitive health information raises significant security concerns. This study presents a method for remote health monitoring that safeguards health and medical data in cloud-based IoT environments through lightweight block encryption. The approach ensures the protection of sensitive information while utilizing data mining techniques to predict essential events.
In 2023, Islam et al.21 introduced a Convolutional Long Short-Term Memory Network (CLSTMN)for Smart Health monitoring for Early heart disease prediction of IoT-based patients. This research proposes an Internet of Things (IoT)-based system designed for remote health monitoring and the early detection of health issues in home clinical settings.The system uses three different types of sensors: the MLX90614 non-contact infrared sensor for body temperature, the AD8232 ECG sensor module for ECG signal data, and the MAX30100 for blood oxygen levels and heart rate. A pre-trained deep learning model classifies potential diseases once the gathered data is sent to a server using the MQTT protocol. The technology immediately puts the user in contact with a physician for a more precise diagnosis.
In 2024, Pachiyannan et al.22 introduced a Convolutional Neural Network (CNN) for Smart Health monitoring for early heart disease prediction of IoT-based patients. A novel healthcare tool called the Machine Learning-based Congenital Heart Disease Prediction Method (ML-CHDPM) helps quickly diagnose and categorize congenital heart disease (CHD) in expectant mothers. Using cutting-edge machine-learning techniques, the algorithm classifies instances according to clinical and demographic parameters. The model’s performance is assessed using six different measures, showing that it can accurately predict and categorize cases of CHD, which is a big step towards early detection and diagnosis. Table 1 shows the Summary of the reviewed approach.
Issues with the integration of IoT in healthcare and solutions
The integration of IoT in healthcare presents challenges such as data security risks, interoperability issues, high infrastructure costs, and data overload. Ensuring secure data transmission through encryption and block chain technology can mitigate security concerns. Standardized protocols and AI-driven analytics can address interoperability and data management issues, improving efficiency. The adoption of 5G and Mobile Edge Computing (MEC) enhances real-time data processing and connectivity, enabling faster decision-making. Additionally, public–private partnerships can help reduce costs and promote widespread adoption, ensuring seamless and efficient healthcare services.
Types of attacks and security mechanisms
The communication layer in IoT healthcare faces various security threats. MAC layer attacks like collision and DoS are countered with error-correction codes and rate limitation. Network threats like sinkhole, Sybil, and wormhole are mitigated using authentication and redundancy checks. Transport and application layers face SYN flooding, buffer overflow, and logical errors, defended by client puzzles and trusted computing. Physical and privacy attacks like PUEA, jamming, and traffic analysis are secured using spread-spectrum, homomorphic encryption, and ongoing routing.
Research gap
Heart disease is still a leading killer globally, and traditional diagnostic processes are typically ineffective and time-consuming, especially in low-resource settings. Due to the complexity of this system, health systems fail to diagnose diseases accurately and on time. Patients are at high risk, as most are treated late, and the dangers come from the many heart-related data points published by IoT devices. This research is proposed to solve these issues.
Proposed methodology
Quantum Kernel-Enhanced Sardine Diffusion Attention Network for Heart Disease Prediction in IoT-Based Smart Health Monitoring (Qua-KSar-DCK-ArNet) is explained in this section.
Figure 2 shows the workflow diagram of Qua-KSar-DCK-ArNet. The system begins by utilizing an IoT-based sensor worn by the patient to continuously collect heart-related data such as ECG, heart rate, and other relevant metrics. The data is transmitted through a mobile phone and securely stored in a cloud-based database. After that, the collected heart-related data is divided into clusters using Quantum Clustering with k-Means to categorize this data according to the disease risk factors. After that, the clustering of the data is followed by the preprocessing using the Z-score Min–Max Normalization technique for better data quality for further analysis. Next is feature extraction, which employs the Fast Point Transformer to identify some of the significant features in data, such as arrhythmia and variability in heart rate. The main subnetwork of the system is the Quantum Kernel Sardine Diffusion Classical Kernel Attention Network (Qua-KSar-DCK-ArNet), which is used to classify processed data and determine the probability of heart disease.

Workflow diagram of Qua-KSar-DCK-ArNet.

Pseudo code of OpHyp-NASH-Gra-Net
Data acquisition
The input dataset is from the IoT-based smart health monitoring sensors19. Then, this health data is stored in a cloud dataset. This section provides an overview of the dataset sourced from the UCI Machine Learning Repository, focusing on clinical records related to heart failure. The dataset comprises patient records for acute heart failure, featuring 11 clinical characteristics collected during the follow-up period. Of 299 records, 194 pertain to male and 105 to female patients. These IoT-detected health data are given to the Quantum clustering with k-Means27 to separate heart-related data for detecting heart disease, and its explanations are given below:
Clustering using quantum clustering with k-Means
Clustering using Quantum clustering with k-Means27 is used for clustering for heart disease prediction. The procedure entails grouping related records by clustering a dataset of histories into clusters and allocating every entry to a cluster represented by a centroid. Given a dataset \(F = \left\{ {\overrightarrow {{q_{1} }} ,.....,\overrightarrow {{q_{P} }} } \right\}\) of entries in which each entry is a \(Q\)-dimensional vector, the purpose of grouping is to allocate every record to one of the different clusters \(\left\{ {B_{1} ,....,B_{l} } \right\}\) denoted through centroid correspondingly for comparable records to get the same assignment based on a particular distance measure.
\(k\)-Means and \(\delta - k\)-Means
A popular technique for clustering is the \(k\)-Means algorithm, which uses a certain distance measure to assign each element to its nearest centroid until a predetermined convergence condition is satisfied.It usually uses the Euclidean distance, which is given by Eq. (1):
here are two-dimensional real vectors. The second step entails computing a new cluster centre for every cluster to update the centroids for the subsequent iteration.
The grouping distribution step is the main emphasis of this, and its classical complexity in time is where the quantity of centroids is, is the number of records, and is their dimension. The quantum variant of \(k\)-Means, known as quantum k-Means, incorporates noise in cluster assignment while preserving classical centroid update steps, simulating traditional methods in a quantum environment.
Then, the modernized version of the measured \(\delta - k\)-Means. Let \(\overrightarrow {b}\) be the centroid closest to the point. Then, \(\delta - k\)-Means defines the set of possible labels \(K_{\delta } \left( {\overrightarrow {q} } \right)\) for \(\overrightarrow {q}\) is given in (2):
When \(\delta = 0\), \(\delta - k\)-Means is comparable to the norm, \(k\)-means that since there is no consideration of uncertainty, \(K_{\delta } \left( {\overrightarrow {q} } \right)\) contains only the centroid computed. Conversely, though a high level of permits means to contain centroids far from the minimal cluster label, the assignment rule randomly chooses a cluster label from the collection, adding additional noise to the process. While quantum k-means guarantees centroid assignments without uncertainty by reducing to standard k-means, using more significant \(\varepsilon\) values to achieve proper grouping creates noise.
Quantum distance estimate
An amplitude-encoded quantum circuit for calculating the quantum Euclidean distance between two quantum states is shown in this study. The circuit makes use of an extra qubit that is entangled with the states. Between the two vectors, the Euclidean distance represents the likelihood of measuring the ancilla in a given state. Calculating the quantum Euclidean distance between several vectors in superposition can be done generally using this process. This work uses similar principlesto define the quantum k-Means algorithm, allowing for the practical assignment of records to clusters based on proximity.
In summary, the clustering methodology aims to enhance heart disease prediction by leveraging classical and quantum techniques for efficient data clustering, leading to improved outcomes in predictive analytics. Then, this separated heart disease data are given to the pre-processing stage to remove unwanted noise, and its explanations are given below:
Pre-processing using Z-score Min–Max normalization technique
This section uses the Z-score Min–Max normalization technique28 to preprocess the input dataset for efficient heart disease prediction. The methodologies of data preparation for health data for modelling include data scaling techniques such as Z-score normalization and Min–Max normalization. Then, Z-score normalization normalizes the data to a mean of one mean and scales it according to the standard deviation. In contrast, Min–Max normalization scales the data to range over certain limits.
These approaches are used on several health indicators, including blood pressure levels, cholesterol and other health factors, including cardiovascular ones, to reduce biases and enhance the efficiency by which models are developed to predict heart diseases. Missing values should be dealt with, and certain characters, such as commas, should be deleted to keep the data clean. The comical ways of dealing with missing data include mean imputation forward and backward filling. The Z-score Min–Max normalization technique preserves the data from clutter and is vital for the correct heart disease evaluation. These approaches are instrumental in the activation functions, such as sigmoidal functions and guarantee that each feature’s contribution to the model is proportional. For efficient heart disease prediction, the Min–Max normalization scales the data using the following formulas (3–4):
where \(V^{P}\), \(i^{p}\) Represents the normalized value of a financial metric, xxx is the original value, and \(\min (i)\), \(\min (v)\) and \(\max (v)\), \(\max (i)\) these are the minimum and maximum values of the dataset, respectively. With daily/weekly/monthly data on patient’s health, most of the vital signs are standardized so that they are on the same scale to enhance comparison. This process also reduces the tendency and bias that might be seen in the model, and the model’s efficiency improves. Where \(i^{p}\) is denoted as the normalized value and \(i\) signifies the current stock price output. Then the input \([J]_{J}\) and output \([O]_{0}\) pre-processed output is given in Eqs. (5–6):
Such techniques are used in the everyday record of the historical health data obtained from IoT-based monitoring systems, which ensures that each health parameter can be easily correlated with others to enhance the efficiency of the prediction model. Following this preprocessing stage, the data is then forwarded to the feature extraction stage to identify and extract the most relevant features for heart disease prediction, as explained below:
Feature extraction based on fast point transformer
After the preprocessing stage, the data moves on to feature extraction to predict outcomes related to heart disease, including the chances of disease presence, its severity, and various patient risk factors. This step uses the network architecture known as the Fast Point Transformer (FPT)29, designed to integrate complex spatial patterns specific to HL datasets while preserving local and global context dependencies. The FPT performs feature extraction in three main steps: The three components of centroid-aware voxelization, LSA and centroid-aware de-voxelization as defined below:
-
Step 1 Centroid-aware Voxelization
The FPT is initially divided into units, with each health unit having patient coordinates, health features, and details of centroids. Because the positions are generally relative to the others, a centroid-to-point positional encoding is used to maintain semantic and context features. This encoding captures the relationship between data points and their respective units. Given an input set of health data, where \(M^{in} = \{ (M_{p} ,i_{p} )\}_{p = 1}^{P}\), where \(M_{p}\) represents the embeddings of the patient health metrics, the FPT voxelized this data into discrete units of the \(p\)-th patient health metrics and \(i_{p}\) represents the embeddings of the equivalentto patient health metrics, the FPT vowelizes this data into discrete units \(u = \{ (u_{i} ,f_{i} ,a_{i} )\}_{i = 1}^{I}\). Each unit \(a_{i}\) includes its coordinates \(f_{i},\) features \(f_{i}\), and centroid coordinates \(a_{i}\).
To preserve semantic and contextual information during voxelization, a centroid-to-point positional encoding \(f_{p} \in \aleph^{Denc}\) is introduced. This encoding retains the relationship between health metrics and their corresponding units. The centroid of a unit is computed as the average of all data points within that unit, defined in Eq. (7):
$$f_{p} = \mu_{enc} \left( {M_{p} - a_{i = \eta (p)} } \right)$$(7)where \(a_{i = \eta (p)}\) is the centroid of the unit containing the health data \(M_{p}\), and \(\mu_{enc}\) positional encoding maps the relative position to a higher-dimensional feature space. The centroid \(a_{i}\) is computed as the average of all patient data points within a unit, as shown in Eq. (8):
$$a_{i} = \frac{1}{|P(i)|}\sum\nolimits_{q \in P(i)} {M_{p} } ,P(i)$$(8)where \(P(i)\) denotes the set of patient data points within the \(i\)-th unit, and \(\eta (i)\) maps thepatient data points \(p\) to its corresponding unit \(i\).
The unit feature \(f_{i} \in \aleph^{Din + Denc}\) is then computed by concatenating the input patient data points \(M_{p}\) (e.g., blood pressure, cholesterol levels) and the positional encoding \(f_{p}\) and its equation is given in (9):
$$f_{i} = \Psi_{p \in P(i)} (i_{p} \oplus f_{p} )$$(9)where \(\oplus\) denotes vector concatenation and \(\Psi\) it is a permutation-invariant operation, such as averaging over the features in the unit.
-
Step 2 Lightweight Self-Attention (LSA)
Post-voxelization, the features are processed through the Lightweight Self-Attention (LSA) block. This mechanism refines the unit features by updating them with contextual information from neighboring units. In the best way possible, the LSA gathers essential information from the surrounding area, enhancing feature representations to predict heart disease rates better. This inevitably guarantees the computational efficiency of the mechanism while at the same time keeping the level of complexity controllable.
-
Step 3 Centroid-aware devoxelization
Finally, translations of the newly updated unit feature representations back to the original data space are obtained. This is done through positional encoding by matching unit-wise features to continuous health data points through centroid-to-point style. The resulting feature is computed using a Multilayer Perceptron (MLP) with the updated unit feature combined with positional encoding. Following the self-attention process, the updated unit features \(u = \{ (u_{i} ,f_{i} ,a_{i} )\}^{\prime}\) are devoxelized back into the heart disease outcome space to produce the output set \(P^{out} = \{ (M_{q} ,l_{q} )\}\) where \(l_{q}\) is the output feature associated with health metrics? \(M_{q}\).
The devoxelization process uses centroid-to-point positional encoding. \(f_{p}\) To assign unit-wise features to continuous health data points. Specifically, the output feature \(o_{q} \in \aleph^{{D_{out} }}\) is computed using a Multilayer Perceptron (MLP) applied to the concatenation of the updated unit feature \(f^{\prime}_{i = \eta (p)}\) and the positional encoding \(f_{p}\) and its equation is given in (10):
$$o_{q} = MLP(f^{\prime}_{i = \eta (p)} \oplus f_{p}$$(10)where \(f^{\prime }_{i = \eta (p)}\) maps the question \(M_{q}\) to its corresponding unit \(i\), \(MLP\) maps the health data to its corresponding output features.
The method used in the FPT to perform feature extraction is particularly viable for producing feature representation with robust local and global dependencies. These features are subsequently used by the Quantum Kernel-Enhanced Sardine Diffusion Attention Network (Qua-KSar-DCK-ArNet) to predict heart disease outcomes, as detailed below.
Heart disease detection using Quantum Kernel-Enhanced Sardine Diffusion Attention Network
After completing feature extraction using FPT, the extracted features are processed by the Quantum Kernel-Enhanced Sardine Diffusion Attention Network (Qua-KSar-DCK-ArNet). The hybrid network enhances learning by combining quantum and classical networks with nested convolutional layers for feature abstraction, multiple-dense nested layers for feature patterns, and an attention mechanism for representation. This innovative approach merges the Quantum-Classical Convolutional Neural Network (Q2CNN)30 with the Diffusion Kernel Attention Network (DKAN)31, optimizing parameters through the Sardine Optimization Algorithm (SOA)32 to improve the accuracy of heart disease predictions, with further explanations provided below in Fig. 3.

Architecture ofQua-KSar-DCK-ArNet.
Quantum-classical convolutional neural network
The Quantum-Classical Convolutional Neural Network (Q2CNN) integrates quantum computing principles with classical deep learning methods to enhance computational efficiency and predictive accuracy in detecting heart disease from IoT intelligent environments. In this hybrid model, circuits process extensive health data from multiple IoT devices and find latent correlations that classical networks may not see. The first type of layers, the classical convolutional layers, are oriented towards feature extraction and pattern recognition of the health metrics. The second type of layers, quantum layers, bring entanglement and superposition into play while incorporating them into more expressive data representations. This amalgamation of quantum and classial parts allows the Q2CNN to improve the performance of relevant tasks such as heart disease detection with perfect precision while reducing the computational parameter of the structure.
-
a.
Quantum state preparation
To process the classical health data to be fed to quantum processing systems, real-time parameters from IoT devices are collected. PPM also defines conditions such as body functions, including blood pressure, heart rates and activities, environments, and health records. This data is normalized and encoded into a quantum-compatible format. The data vector \(e\) is represented as shown in Eq. (11):
$$e = \left[ {e_{1} ,e_{2} ,...,e_{{q^{2} }} } \right]$$(11)This vector \(f\) is converted into angle values \(\vartheta\) as (12):
$$\vartheta = \pi f$$(12)where \(\vartheta = \left[ {\vartheta_{1} ,\vartheta_{2} ,...,\vartheta_{{q^{2} }} } \right]\), these angles \(\vartheta\) is a function mapping the health metrics to angle values suitable for quantum state preparation. For a quantum system with \(q^{2}\) input the quantum state \(\left| {\Psi_{data} } \right\rangle\) is created by applying a rotation gate \(s_{y}\) to the initial quantum state \(\left| 0 \right\rangle^{{ \otimes p^{2} }}\) as (13),
$$\left| {\Psi_{{{\text{data}}}} } \right\rangle = \otimes_{l = 1}^{{p^{2} }} s_{y} (\vartheta_{l} )\left| 0 \right\rangle$$(13)This state \(\left| {\Psi_{data} } \right\rangle\) represents the rotation gate parameterized by \(\left| {\Psi_{data} } \right\rangle\).
-
b.
Quantum-classical convolution operation
In the quantum-classical convolutional layer, a quantum kernel \(u(\varphi )\) is designed using quantum circuits to transform the quantum state \(\left| {\Psi_{data} } \right\rangle\). The kernel parameters \(\left( {\varphi_{1} ,\varphi_{2} ,\varphi_{3} ,\varphi_{4} ,\varphi_{5} } \right)\) control the quantum operations applied to \(\left| {\Psi_{data} } \right\rangle\). The transformation performed by this kernel is described by Eq. (18):
$$\left| {\Psi_{conv} } \right\rangle = R(\varphi )\left| {\Psi_{data} } \right\rangle$$(14)where \(R(\varphi ) = u_{1} (\varphi )u_{2} (\varphi )...u_{l} (\varphi )\) represents the sequence of unitary operations applied by the quantum kernel to extract relevant features from the health data.
-
c.
Quantum pooling and measurement
To reduce the dimensionality of the quantum convolution results, a quantum pooling gate \({\rm O}\) consisting of controlled-NOT gates, is applied. This pooling operation maps the convolution results to specific inputs and is defined in Eq. (15):
$$\left| {\Psi_{pool} } \right\rangle = {\rm O}\left| {\Psi_{conv} } \right\rangle$$(15)After pooling, measurements are performed on the quantum state in the Z-basis to obtain expected values, as shown in Eq. (16):
$$T = \left\langle {\Psi_{data} } \right|{\rm O}^{ + } Z_{1} {\rm O}V(\varphi )\left| {\Psi_{data} } \right\rangle$$(16)where \(Z\) is the operator applied to different inputs and \({\rm O}\) represents the pooling gate.
The resulting vector \(T\), with dimensions \(1 \times (q - 1)^{2}\), is the fed attention network for further processing. The resulting vector \(T\), with reduced dimensions, serves as input to the attention network for further processing, enabling more accurate predictions of heart disease outcomes based on data from the IoT bright environment. Then, to improve the accuracy, the Q2CNN is integrated with DKAN, and its explanations are given below.
Diffusion kernel attention network (DKAN)
In the context of heart disease prediction from intelligent IoT devices, conventional self-attention mechanisms face challenges in effectively modeling indirect relationships between various health-related variables, such as heart rate, blood pressure, physical activity, and lifestyle factors. Traditional methods typically focus on pairwise relationships without indirectly capturing the more profound and complex interactions that may exist among these variables. This limitation can reduce the accuracy of heart disease prediction models and hinder the identification of hidden patterns influencing patient health. To address this problem, this study proposes the Diffusion Kernel Attention Network (DKAN) as a subroutine of the proposed Q2CNN. The DKAN enhances how the model computes both first-degree and other-level connections between health-related issues to make better decisions and predict better heart disease risk. The DKAN uses the random walk process to capture adjacent and non-adjacent correlations between various measures of health gathered from connected intelligent IoT devices, including pulse rate, movement and eating patterns.
This random walk is characterized by a transition matrix \(R \in \aleph^{P \times P}\), representing the chance of passing from one health variable to another within the data set. The transition matrix \(R\) is computed by normalizing the kernel attention \(K\) matrix derived from the self-attention mechanism, ensuring that relationships between variables are encoded effectively, and its equation is given in (17):
where \(R_{pq}\) denotes the probability of transitioning from variable \(p\) to variable \(q\) in one step. By performing \(S\). The sum ensures proper normalization of the matrix. Thus, the ordering of diffusion kernel attention is combined using the DKAN through a weighted sum. This approach allows the model to sort out indirect relationships between health variables of different levels while considering all the discussed levels of interaction. The weights ensure. This transition matrix forms the basis for modeling the direct and indirect relationship between health metrics.
Since a given clinical quantity may depend on several other clinical quantities, and the clinical quantities may, in turn, depend on other clinical quantities in a two-tiered fashion, the multi-step random walks of the DKAN create awareness of much broader liaisons in the health-related network beyond just duality. An A \(k\)-step random walk expands the spectrum of relations considered, relationships between the variables that are connected not directly. The condition of the heart disease prediction network following -step random walks is represented in Eq. (18):
where \(R^{K}\) denotes the \(T\)-th power of the transition matrix \(R\). This formulation effectively captures the state of the network after considering interactions up to \(k\) orders of connectivity. In the context of predicting heart disease, this enables the model to gain a deeper insight into the intricate and nuanced factors that contribute to the risk of heart disease, as outlined in Eq. (19):
here are adaptive weights learned during training to optimize the model’s performance. The DKAN combines the different orders of diffusion kernel attentions into a weighted sum to integrate them. The above method helps the model to focus on the relative indirect couplings between health variables at different interaction levels while incorporating all of them. The weights add up some inputs to have a normalized weight for various layers of indirect relationships, so working with the DKAN improves the ability to predict the risks of heart disease. In an attempt to increase accuracy and decrease the error rates, computational complexity and cost, the weight parameters Of Q2CNN-DKAN are fine-tuned with the Sardine Optimization Algorithm (SOA) and its explanations are given below:
Optimization with Sardine Optimization Algorithm (SOA)
To further enhance the accuracy of heart disease prediction from smart IoT devices, the weight of the proposed model, namely, Q2CNN-DKAN, is fine-tuned by employing a metaheuristic named the Sardine Optimization Algorithm (SOA). This optimization aids in enhancing the model that suppresses the risk levels as well as the health condition of the patients by reducing the rates of mispredictions and computations of the model. In particular, the SOA strategy allows the exploration and exploitation of the given space and the search for such a set of model parameters, which will achieve the maximum accuracy indefining the risks of heart diseases. Figure 4 shows the flow chart of Qua-KSar-DCK-ArNet. The step-by-step procedure of Qua-KSar-DCK-ArNet are given below:

Flow chart of Qua-KSar-DCK-ArNet.

Pseudo code of Qua-KSar-DCK-ArNet
-
Step 1 Initialization
The optimization process begins with the random distribution of sardine schools, representing a potential solution. Every solution is connected with a set of parameters, such as the weight of the Q2CNN-DKAN measure or weights of the network components and the attention layers in the Q2CNN-DKAN architecture. These parameters are crucial to span the risk of heart disease indicators, including physiological measures and behavioral aspects.
-
Step 2 Random generation
During this phase, the random generation of the school of sardines is the first step in exploring the SOA space to ensure proper exploration. The purpose here is to identify sets of parameters that would exhibit the activity of health data, including voltage signals that represent HRV, systolic/diastolic BP, etc. In the implementation process, the algorithm will go through most of the possible parameter values to identify settings that enhance the reliability of heart disease predictions.
-
Step 3 Fitness function
Through the measures of the fitness function, the ability of the Q2CNN-DKAN model is evaluated based on the accuracy, error rate and amount of time it takes for the model to make predictions. The purpose is to minimize the loss function, which aids in improving the forecastsof risk factors of heart disease in the model. The fitness function can be expressed as in Eq. (20):
$$Fitness\,function = Optimize\left( \alpha \right)$$(20) -
Step 4 Sardine schools for attaining the best solution
The optimization process involves the movement and transformation of sardine schools. Operators, such as the “oval operator,” are used to iteratively update each sardine’s position in the solution space, guiding the search toward the optimal solution. The sardine schools are updated based on adjacent odd and even dimensions \(\left( {y_{p} ,x_{f} } \right)\), adjusting their positions according to the school’s radius and optimization settings. This movement follows these Eqs. (21–23):
$$\left\{ {\begin{array}{*{20}l} {\chi = rand() \times 2\Pi } \hfill \\ {y_{p} = q\cos \left( {\delta_{l} + \delta } \right)} \hfill \\ {x_{f} = q\sin \left( {\delta_{l} + \delta } \right)} \hfill \\ \end{array} } \right.$$(21)$$\left\{ {\sigma_{l} \left| {\sigma_{l} = l\frac{2\Pi }{{TSize}}1 \le l \le TSize \cap l \in W} \right.} \right\}$$(22)$$\begin{aligned} q & = \frac{t \times SearchScope}{6} \times \left| {\frac{UpLimit - LowLimit}{2}} \right| \\ & \quad \times e^{{ - 5 \times \left( \frac{k}{K} \right)^{2} }} t = 1,2,3,....,6 \\ \end{aligned}$$(23)An odd dimension is an even dimension, and it is school size. Returns a random number from 0 to 1. \(q\) is the radius of the school, \(K\) is the maximum number of evaluating sardines (i.e., the maximum number of using fitness function), and is the present number of evaluating sardines. With \(k\) increasing, it decreases gradually. Besides, there \(UpLimit\,and\,LowLimit\) are the upper and lower limits in each dimension. It is a setting parameter that is equal to 30%. Worth noting that it \(\frac{t \times SearchScope}{6}\) has six values. A set parameter is set to 30%, and each school randomly selects a value from six values (5%, 10%, 15%, 20%, 25%, 30%). These generated points are uniformly distributed around the center \(B\), \(\alpha\) representing the optimization parameters needed to achieve the best solution (improving accuracy, reducing error rates, and minimizing computational complexity).
-
Step 5 Termination
The optimization process continues until the termination criteria are met, when the optimal solution is identified, or a pre-defined number of iterations is reached. The best solution corresponds to the parameters that maximize the model’s accuracy in predicting heart disease risk. By optimizing the regularization coefficients, the model effectively balances minimizing error rates and computational complexity, thus enhancing predictive performance for heart disease risk assessment based on data collected from intelligent IoT devices.
This manuscript presents the Quantum Kernel-Enhanced Sardine Diffusion Attention Network (Qua-KSar-DCK-ArNet) for heart disease prediction using IoT-based sensors. The system collects heart data, clusters it via Quantum Clustering, preprocesses it with Z-score Min–Max normalization, and extracts features using the Fast Point Transformer. It combines quantum and classical techniques for accurate predictions, facilitating timely clinical decision-making.
Result and discussion
This section presentsthe results and discussions of Quantum Kernel-Enhanced Sardine Diffusion Attention Network (Qua-KSar-DCK-ArNet) for heart disease prediction using IoT-based sensors. Here, the concept of An IoT-Based Patient Monitoring System is presented.
Dataset descriptions
The input dataset is taken from the IoT-based smart health monitoring sensors. Then, this health data is stored in a cloud dataset. This section provides an overview of the dataset sourced from the UCI Machine Learning Repository, focusing on clinical records related to heart failure. The dataset comprises patient records for acute heart failure, featuring 11 clinical characteristics collected during the follow-up period. Of 299 records, 194 pertain to male and 105 to female patients. Among them, 70% of data are taken for training and 30% for testing. The training process involves initially dividing the dataset into training, validation, and test sets (70%, 15%, and 15% respectively). Hyperparameters include a learning rate of 0.001, batch size of 32, number of epochs set to 100, quantum clustering k-value of 5, and diffusion optimization iterations set at 50. The Adam optimizer was used to minimize the cross-entropy loss function. Evaluation criteria encompass accuracy, precision, recall, F1-score providing comprehensive metrics for model performance assessment.
Performance metrics
The performance metrics such as Accuracy, precision, recall, sensitivity, Computational complexity, computational time, and error rate analysis of neural network models such as IoT-based ambulatory blood pressure monitoring (IABPM)16, Extra Tree Classifier-Convolutional Neural Network (ET-CNN)17, Bidirectional Long Short-Term Memory (Bi-LSTM)18, Multilayer Perceptron Neural Network (MPNN)19, Body Area Network and Personal Area Network (BAN-PAN)20, Convolutional Long Short-Term Memory Networks (CLSTMN)21 and Convolutional Neural Network (CNN)22 respectively are analyzed.
Table 2 shows the performance metrics equations are given below:
-
True Positive
 : Normal correctly calculates as usual.
 -
False Positive \(\hbar\): Normal incorrectly calculates as abnormal.
-
False Negative \(\ell\): Abnormal incorrectly calculates, abnormal as usual.
-
True Negative \(\xi\): Abnormal correctly calculates, abnormal.
 : Normal correctly calculates as usual.
Performance analysis
The examinations of the introduced method are clarified here.
Figure 5 shows the examination of Training Accuracy over Epochs with 99.9% accuracy. By evaluating the method’s output using the training dataset, training accuracy offers invaluable information about how effectively the model assimilates the info it has encountered. A critical measure of the model’s training effectiveness is the loss function. A smaller loss function value indicates better model performance.

a Training Accuracy, b Training loss function over Epochs for Qua-KSar-DCK-ArNet.
Figure 6a shows the Convergence plot over Epochs with existing methods. The convergence plot across epochs shows the performance of the proposed model compared with existing methods. It illustrates the consistency and quickness of the learning process by tracking accuracy or loss over iterations. While a fast convergence indicates that the model learns the best patterns quickly, a steady curve indicates robustness. When our model is compared with current methods, it shows speedier convergence, lower loss, more robust optimization, better generalization, and higher accuracy over alternatives in complex tasks.

a Convergence plot over Epochs and b ROC curves comparison with existing methods.
Figure 6b compares the ROC curves with existing methods. The proposed model’s ROC curves show improved sensitivity and specificity compared to existing processes, resulting in more accurate predictions, fewer misclassifications, and an overall diagnostic or detection accuracy improvement.
Figure 7a shows the Accuracy across epochs (stacked).The suggested Qua-KSar-DCK-ArNet routinely beats alternative techniques such as IABPM, EFCMN, BI-LSTM, MPNN, and BAN-PAN over several epochs (100–500), as shown by the accuracy graph. This suggests that the proposed model performs exceptionally well in predicting heart illness with its excellent classification performance. It isessential for efficient health monitoring in the Internet of Things-based intelligent systems.

a Accuracy, b Specificity and c Sensitivity Comparison of existing methods across epochs.
Figure 7a shows the Specificityacross epochs (stacked).Compared to IABPM, EFCMN, BI-LSTM, MPNN, and BAN-PAN, Qua-KSar-DCK-ArNet performs better overall epochs and maintains fewer false positives, according to the specificity comparison. In IoT-based health monitoring systems, high specificity guarantees the system correctly detects those without cardiac disease, minimizing needless warnings.
Figure 7a shows the Sensitivityacross epochs (stacked). The suggested Qua-KSar-DCK-ArNet leads consistently in recognizing true positives across several epochs in terms of sensitivity. To maintain patient safety in IoT-based health systems, high sensitivity is essential for the prompt and accurate diagnosis of cardiac disease, proving the model’s efficacy in decreasing missed diagnoses.
Figure 8a shows the F1 scores across epochs (stacked). Higher F1 scores are routinely achieved by the proposed Qua-KSar-DCK-ArNet, demonstrating its superior ability to handle unbalanced heart disease datasets. This guarantees accurate forecasts in IoT-based intelligent health monitoring systems, where it’s essential to reduce false positives and negatives.

a F1-Score b Recall and c Error Rate Comparison of existing methods across epochs.
Figure 8b shows the recall across epochs (stacked). The recall graph shows the accuracy of various approaches toidentifyingheart disease patients. With its consistent recall leadership, Qua-KSar-DCK-ArNet efficiently catches true positives, minimizing the number of missed heart disease diagnoses. High recall is crucial in IoT-based health systems to guarantee early detection and prompt medical actions.
Figure 8c shows the error rate across epochs (stacked). The Qua-KSar-DCK-ArNet approach, as compared to alternative methods, consistently maintains a reduced error rate over several epochs, as seen by the error rate comparison. This illustrates its resilience in lowering false positives and negatives, essential for precise and trustworthy heart disease prediction in Internet of Things-based intelligent health monitoring systems.
Table 3 and Fig. 9 shows the performance metrics of various models in detecting abnormal and normal cases. The proposed Qua-KSar-DCK-ArNet demonstrates exceptional performance, achieving the highest accuracy (99.98%), precision (99.34%), recall (99.56%), and F1-score (96.34%). This indicates its effectiveness in distinguishing between abnormal and typicalcases, significantly outperforming other models in the analysis.

Accuracy, Precision, Recall and F1-Score Comparison of existing methods.
Table 4 and Fig. 10 show the Positive Predictive Value (PPV) percentages for different approaches across multiple data points (DP) displayed in the table. With near-perfect PPV values, the suggested Qua-KSar-DCK-ArNet consistently beats the other methods, particularly with larger datasets (99.79% for 567 records and 99.79% for 5000 records). While techniques like IABPM, ET-CNN, Bi-LSTM, and MPNN exhibit lower and more variable PPV, indicating decreased accuracy in positive categorization, BAN-PAN performs well.

Analysis of disease prevalence using positive predicted values (PPV).
Table 5 and Fig. 11 show that the proposed Qua-KSar-DCK-ArNet model is among the models whose Negative Predictive Value (NPV) percentages are displayed across various data points (DP) and record counts. Among other models, Qua-KSar-DCK-ArNet is particularly good at identifying negative cases in prediction tasks; it consistently outperforms other models and achieves the highest NPV across all data sets.

Analysis of disease prevalence using Negative Predicted values (NPV).
Table 6 and Fig. 12 compare the performance of the proposed Qua-KSar-DCK-ArNet with existing methods across various metrics. Qua-KSar-DCK-ArNet achieves superior results in accuracy (99.97%), recall (98.47%), and precision (99.59%), along with the lowest Mean Squared Error (0.01) and computational costs. These results highlight its effectiveness and efficiency in heart disease detection, outperforming all other methods.

Overall analysis of the introduced technique related to prevailing approaches.
Table 7 and Fig. 13 present a comparison of various optimization techniques used for training neural networks, highlighting their fitness regarding training execution duration and accuracy. These methods include the Sea-Horse Optimizer Algorithm (SHOA), Green Anaconda Optimization Algorithm (GAOA), Greylag Goose Optimization Algorithm (GGOA), Triangulation Topology Aggregation Optimizer Algorithm (TTAOA), Gorilla Troops Optimizer Algorithm (GTOA) and the Quantum Kernel-Enhanced Sardine Diffusion Attention Network (Qua-KSar-DCK-ArNet). Notably, the proposed Qua-KSar-DCK-ArNet attains the highest training accuracy of 99% in the experiment. 89%, while also highly efficient, with an execution time as low as 0. 1 s.

Fitness of fittest agents.
Statistical analysis of the proposed method vs. existing methods
The effectiveness of the projected method is evaluated using five statistical tests: the Shapiro–Wilk test (SW test), Wilcoxon Signed-Rank Test (WSR), Friedman Test (FT), Kruskal–Wallis H-test, and Kolmogorov–Smirnov test (KS test).
-
a.
SW Test
The Shapiro–Wilk test, or SW test, can be used to determine a sample’s normal distribution. It computes a W statistic to compare the sample distribution to a normal distribution. A p-value of less than 0.05 indicates statistical significance and suggests that the data may not follow a normal distribution.
-
b.
WSR Test
The Wilcoxon Signed-Rank Test (WSR), a non-parametric statistical test, compares matching data. In cases when the data are not regularly distributed, it ascertains whether the median difference between paired observations is zero. It rates them to see if there is a substantial deviation of the absolute differences from zero.
-
c.
Friedman Test (FT)
A non-parametric statistical tool called the Friedman technique (FT) can be used to find differences in treatment between test runs. It is used in matched-subject designs and repeated measures to determine whether there are statistically significant differences in rankings between related groups when the data are ordinal or non-normally distributed.
-
d.
Kruskal–Wallis H-test
Based on ranking data, the Kruskal–Wallis H-test is a nonparametric statistical procedure used to evaluate whether there is a statistically significant difference between three or more independent groups. It is appropriate for ordinal or nonnormally distributed data since it considers whether the group median ranks fluctuate.
-
e.
Kolmogorov–Smirnov Test (KS Test)
The Kolmogorov–Smirnov Test (KS) determines whether a sample conforms to a given distribution by comparing the empirical distribution function to the theoretical distribution. It establishes the degree to which these roles vary from one another. A high KS statistic suggests that the sample does not fit the expected distribution and indicates a significant difference.
Table 8 and Fig. 14 presentthe statistical analysis of the proposed Qua-KSar-DCK-ArNet model, showcasing its superior performance compared to existing methods. The p-values below 0.001 in tests like the F-test and Wilcoxon Signed-Rank indicate high statistical significance. The model also has the lowest Variance Inflation Factor (1.001), suggesting minimal multi-collinearity. Its mean performance (61,429.83) and moderate standard deviation (3,725.78) further highlight its reliability and stability, outperforming other models.
Table 8 Statistical Analysis of the proposed method versus existing methods. Fig. 14 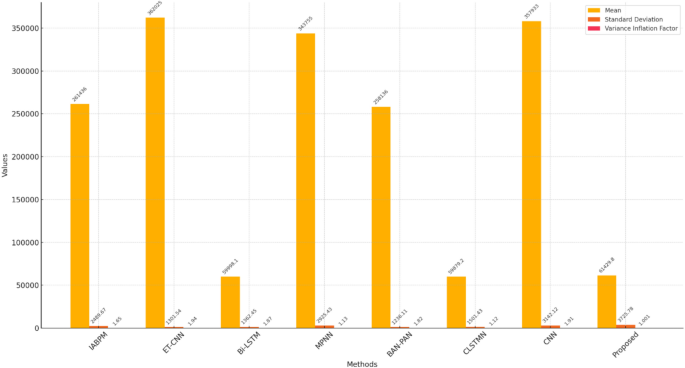
Statistical analysis of the proposed method versus existing methods.

Ablation study of the proposed method
An ablation study is a methodical experiment to examine the effects of specific elements or characteristics of a suggested approach. An ablation study for the proposed method (Qua-KSar-DCK-ArNet) would include methodically eliminating or adjusting particular aspects or techniquesto regulate how they affect the model’s overall presentation. Table 9 shows the ablation study of the proposed method compared with previous Siamese networks.
Table 9 and Fig. 15 comparisons of different configurations of the model and their performance on datasets.

Ablation study.
The proposed method provides better results by adding DKAN and Q2CNN. With these networks, this method would have more accuracy. The configuration DKAN exhibits a slight drop in accuracy and attains. 94.78% for the first dataset and 96.87% for the second dataset. Like that, the newly developed variant Q2CNN has slightly improved from the DKAN CNN with the following accuracy: first dataset 96.86%, second dataset 93.45%. Therefore, the accuracy obtained from the proposed Qua-KSar-DCK-ArNet for the first dataset is 99.95% and for the second dataset is 99.97%.
Discussion
The proposed Qua-KSar-DCK-ArNet system demonstrates significant potential in enhancing heart disease prediction through IoT-based smart health monitoring. The integration of quantum clustering, advanced preprocessing, and deep learning-based attention mechanisms ensures high accuracy and efficient data processing. Compared to traditional methods, our approach achieves superior predictive performance while enabling real-time diagnosis, which is crucial for early intervention. However, challenges such as data security, computational complexity, and system scalability must be addressed for widespread implementation. Future improvements will focus on optimizing resource utilization, integrating additional physiological parameters, and enhancing model interpretability for clinical applications.
Conclusions
This study presents the Qua-KSar-DCK-ArNet system, an IoT-based smart health monitoring framework for heart disease prediction. By leveraging quantum clustering, advanced preprocessing, and a diffusion attention network, the system achieves an impressive 99% accuracy, enabling real-time diagnosis and improved patient outcomes. The findings highlight its potential for quick and precise heart disease detection, particularly in resource-limited settings. Future work will focus on integrating additional physiological data and enhancing deep learning techniques to further improve prediction quality and scalability. Moreover, addressing challenges related to data security, computational efficiency, and seamless cloud integration will be crucial for its broader adoption in clinical practice. Next, we will explore the feasibility of using RTA for, for instance, anticipating and preventing heart disease cases, and we aspire to advance the system’s applicability to as many facilities, especially those in LMICs, as possible.
Data availability
The data that supports the findings of this study are available within the article.
Abbreviations
- Qua-KSar-DCK-ArNet:
-
Quantum Kernel-Enhanced Sardine Diffusion Attention Network
- CNN:
-
Convolutional Neural Network
- IoT:
-
Internet of Things
- CHD:
-
Congenital heart disease
- LSTM:
-
Long short-term memory
- DKAN:
-
Diffusion Kernel Attention Network
- SOA:
-
Sardine Optimization Algorithm
- FPT:
-
Fast Point Transformer
- LSA:
-
Lightweight Self-Attention
- MLP:
-
Multilayer Perceptron
References
Ramkumar, G., Seetha, J., Priyadarshini, R., Gopila, M. & Saranya, G. IoT-based patient monitoring system for predicting heart disease using deep learning. Measurement 218, 113235 (2023).
Mistry, J. & Ganesh, A. An analysis of IoT-based solutions for congenital heart disease monitoring and prevention. J. Xidian Univ. 17(7), 325–334 (2023).
Arthy, S. & Prasanth, A. An intelligent heart disease prediction system using IoT and adaptive deep convolution neural network, in AIP Conf. Proc., Vol. 2802, No. 1 (2024).
Kumar, V. et al. Development of medical IoT system for the prediction of heart disease, in 2024 4th Int. Conf. Adv. Comput. Innov. Technol. Eng. (ICACITE) 951–956 (2024).
Yashudas, A., Dinesh Gupta, G. C., Prashant, A. D., Dokhyl AlQahtani, A. & Reddy, S. K. DEEP-CARDIO: Recommendation system for cardiovascular disease prediction using IoT network. IEEE Sens. J. 24(9), 14539–14547. https://doi.org/10.1109/JSEN.2024.3373429 (2024).
Amune, A. et al. Integrated healthcare system for saline monitoring, patient communication, and heart disease prediction using IoT and machine learning algorithms, in 2024 Int. Conf. Emerg. Smart Comput. Inform. (ESCI) 1–6 (2024).
Rajkumar, G., Devi, T. G. & Srinivasan, A. Heart disease prediction using IoT-based framework and improved deep learning approach: Medical application. Med. Eng. Phys. 111, 103937 (2023).
Mistry, J., Ganesh, A., Ramakrishnan, R. & Logeshwaran, J. An IoT-based congenital heart disease prediction system will amplify authentication and data security by using cloud computing. Eur. Chem. Bull. 12, 7201–7213 (2023).
Krishnamoorthy, R. et al. An intelligent IoT-based smart healthcare monitoring system using machine learning. In 5G-Based Smart Hospitals and Healthcare Systems: Evaluation, Integration, and Deployment (eds Kumar, A. et al.) 230–247 (CRC Press, 2023).
Safa, M. et al. Real-time healthcare big data analytics model for improved quality of service in cardiac disease prediction with IoT devices. Health Technol. 13(3), 473–483 (2023).
Nancy, A. A. et al. Fog-based innovative cardiovascular disease prediction system powered by modified gated recurrent unit. Diagnostics 13(12), 2071 (2023).
Vishnu, K., Sebastian, T., Binu, P. K. Smart healthcare systems: A survey of IoT and AI technologies for heart disease prediction, in 2024 Int. Conf. Adv. Power, Commun. Intell. Syst. (APCI) 1–7 (2024).
Janarthanan, V., Annamalai, T. & Arumugam, M. Enhancing healthcare in the digital era: A secure e-health system for heart disease prediction and cloud security. Expert Syst. Appl. 255, 124479 (2024).
Bebortta, S. et al. Fedehr: A federated learning approach towards the prediction of heart diseases in IoT-based electronic health records. Diagnostics 13(20), 3166 (2023).
Mishra, J. & Tiwari, M. IoT-enabled ECG-based heart disease prediction using three-layer deep learning and meta-heuristic approach. Signal Image Video Process. 18(1), 361–367 (2024).
Yenurkar, G. et al. Revolutionizing chronic heart disease management: The role of IoT-based ambulatory blood pressure monitoring system. Diagnostics 14(12), 1297 (2024).
Umer, M. et al. Heart failure patients monitoring using IoT-based remote monitoring system. Sci. Rep. 13(1), 19213 (2023).
Alzakari, S. A. et al. Enhanced heart disease prediction in remote healthcare monitoring using IoT-enabled cloud-based XGBoost and Bi-LSTM. Alex. Eng. J. 105, 280–291 (2024).
Almujally, N. A. et al. Monitoring acute heart failure patients using internet-of-things-based smart monitoring system. Sensors 23(10), 4580 (2023).
Akhbarifar, S. et al. A secure remote health monitoring model for early disease diagnosis in cloud-based IoT environment. Pers. Ubiquitous Comput. 27(3), 697–713 (2023).
Islam, M. R. et al. Deep learning-based IoT system for remote monitoring and early detection of health issues in real-time. Sensors 23(11), 5204 (2023).
Pachiyannan, P. et al. A novel machine learning-based prediction method for early detection and diagnosis of congenital heart disease using ECG signal processing. Technologies 12(1), 4 (2024).
Mazhar, T. et al. A novel expert system for the diagnosis and treatment of heart disease. Electronics 11(23), 3989 (2022).
Khan, M. A. et al. Optimal feature selection for heart disease prediction using modified Artificial Bee colony (M-ABC) and K-nearest neighbors (KNN). Sci. Rep. https://doi.org/10.1038/s41598-024-78021-1 (2024).
Mazhar, T. et al. Analysis of integration of IoMT with blockchain: issues, challenges and solutions. Discov. Internet Things https://doi.org/10.1007/s43926-024-00078-1 (2024).
Ghadi, Y. Y. et al. Enhancing patient healthcare with mobile edge computing and 5G: challenges and solutions for secure online health tools. J. Cloud Comput. https://doi.org/10.1186/s13677-024-00654-4 (2024).
Poggiali, A. et al. Quantum clustering with k-means: A hybrid approach. Theor. Comput. Sci. 992, 114466 (2024).
Sholeh, M. & Nurnawati, E. K. Comparison of Z-score, min-max, and no normalization methods using support vector machine algorithm to predict student’s timely graduation, in AIP Conf. Proc., Vol. 3077, No. 1 (2024).
Park, C., Jeong, Y., Cho, M., & Park, J. Fast point transformer, in Proc. IEEE/CVF Conf. Comput. Vis. Pattern Recognit. 16949–16958 (2022).
Matic, A. et al. Quantum-classical convolutional neural networks in radiological image classification, in 2022 IEEE Int. Conf. Quantum Comput. Eng. (QCE) 56–66 (2022).
He, K., Cai, Y., Peng, S. & Tan, M. A diffusion model-assisted multiscale spectral attention network for hyperspectral image super-resolution. IEEE J. Sel. Top. Appl. Earth Observ. Remote Sens. 17, 8612–8625. https://doi.org/10.1109/JSTARS.2024.3386702 (2024).
Soltani, N. & Maybodi, N. A. Image thresholding based on sailfish optimizer algorithm, in 2024 3rd Int. Conf. Distrib. Comput. High Perform. Comput. (DCHPC) 1–10 (2024).
Zhao, S. et al. Sea-horse optimizer: A novel nature-inspired meta-heuristic for global optimization problems. Appl. Intell. 53(10), 11833–11860 (2023).
Dehghani, M., Trojovský, P. & Malik, O. P. Green anaconda optimization: A new bio-inspired metaheuristic algorithm for solving optimization problems. Biomimetics 8(1), 121 (2023).
Sharma, A. et al. Multi-objective greylag goose optimization, in 2024 2nd Int. Conf. Adv. Comput. Comput. Technol. (InCACCT) 374–379 (2024).
Zeidan, M. A. et al. Enhancement of a hybrid electric shipboard microgrid’s frequency stability with triangulation topology aggregation optimizer-based 3DOF-PID-TI controller. IEEE Access 12, 66625 (2024).
Elymany, M. M., Enany, M. A. & Elsonbaty, N. A. Hybrid optimized-ANFIS based MPPT for hybrid microgrid using zebra optimization algorithm and artificial gorilla troops optimizer. Energy Convers. Manag. 299, 117809 (2024).
Acknowledgements
The authors extend their appreciation to the Deanship of Research and Graduate Studies at King Khalid University for funding this work through Large Research Project under grant number RGP2/441/46.
Author information
Authors and Affiliations
Contributions
Conceptualization, D.K.H, S.N.T; Writing—Review and Editing, C.N.R, D.D; Methodology, Q.N.N, S.K; Supervision, M.K, A.F.E.
Corresponding authors
Ethics declarations
Competing interests
The authors declare no competing interests.
Ethical approval
This article does not contain any studies with human participants or animals performed by any of the author.
Additional information
Publisher’s note
Springer Nature remains neutral with regard to jurisdictional claims in published maps and institutional affiliations.
Rights and permissions
Open Access This article is licensed under a Creative Commons Attribution-NonCommercial-NoDerivatives 4.0 International License, which permits any non-commercial use, sharing, distribution and reproduction in any medium or format, as long as you give appropriate credit to the original author(s) and the source, provide a link to the Creative Commons licence, and indicate if you modified the licensed material. You do not have permission under this licence to share adapted material derived from this article or parts of it. The images or other third party material in this article are included in the article’s Creative Commons licence, unless indicated otherwise in a credit line to the material. If material is not included in the article’s Creative Commons licence and your intended use is not permitted by statutory regulation or exceeds the permitted use, you will need to obtain permission directly from the copyright holder. To view a copy of this licence, visit http://creativecommons.org/licenses/by-nc-nd/4.0/.
About this article

Cite this article
Hembram, D.K., Tripathy, S.N., Reddy, C.N. et al. IoT driven smart health monitoring for heart disease prediction using quantum kernel enhanced sardine diffusion and CNN. Sci Rep 15, 17306 (2025). https://doi.org/10.1038/s41598-025-99990-x
Received:
Accepted:
Published:
Version of record:
DOI: https://doi.org/10.1038/s41598-025-99990-x
