
Abstract
The liliaceous ornamental plant Tricyrtis sp. produces unique flowers, whose tepals have many random reddish-purple spots on a light purple background. In our previous studies, we performed comprehensive isolation and expression analysis of the anthocyanin biosynthesis-related genes to elucidate the molecular mechanism underlying flower color pattern formation in this plant, and identified the R2R3-MYB transcription factor gene, TrMYB1, expressed in tepals. In the present study, we carried out detailed expression and functional analyses of TrMYB1. Shading treatment of flower buds markedly reduced background coloration of the tepals, while there was little effect on spot formation. In addition, TrMYB1 expression level decreased in the tepals of shaded flower buds. Overexpression of TrMYB1 in Tricyrtis sp. resulted in deeper coloration and significantly increased anthocyanin content in tepals. RNAi-mediated knockdown of TrMYB1 significantly suppressed the expression of the anthocyanin biosynthetic enzyme genes, resulting in a significant decrease in anthocyanin contents and marked reduction in background coloration in the tepals, with little effect on spot formation. These results indicate that tepal background coloration and spot formation may be regulated by different molecular mechanisms, and that background coloration is likely induced by light through activation of TrMYB1.
Introduction
Flower color and flower color pattern are among the most important traits for ornamental plants. Flower color is determined primarily by the type and concentration of pigments, as well as the combination of multiple pigments. Whereas flower color patterns, such as spots, variegation, stripes, picotee, and gradation, are caused by different patterns of pigment accumulation in tepals1. Among flower pigments, anthocyanins, members of flavonoids, are found in various plant species and are responsible for a wide range of colors including orange, red, purple, and blue2,3.
The anthocyanin biosynthetic pathway is broadly conserved among higher plant species and is well understood3. In this pathway, eight enzymes, chalcone synthase (CHS), chalcone isomerase (CHI), flavanone-3-hydroxylase (F3H), flavonoid 3′-hydroxylase (F3′H), flavonoid 3′,5′-hydroxylase (F3′5′H), flavonol synthase (FLS), dihydroflavonol 4-reductase (DFR), and anthocyanin synthase (ANS) are involved in the biosynthesis of anthocyanidins and flavonols3,4. The expression of these enzyme genes is known to be mainly regulated by the MBW transcription factor complex consisting of R2R3-myeloblastosis (MYB), basic helix-loop-helix (bHLH), and WD40 repeats (WDR) proteins5. These transcription factors and their functions have also been characterized in various higher plant species3,5,6.
Anthocyanin biosynthesis is known to be affected by environmental stimuli such as light, temperature, and drought. Among them, light has been extensively studied as a key factor influencing anthocyanin biosynthesis7. It has been reported that shading treatments reduce anthocyanin accumulation in tepals or fruit skins in Eustoma grandiflorum8, Gerbera hybrida9, Malus domestica10, Chrysanthemum morifolium11, Solanum melongena12, and Lilium regale13. The molecular mechanisms underlying light-induced anthocyanin biosynthesis have been investigated in several plant species. In Petunia hybrida, both an R2R3-MYB transcription factor PHZ and a bHLH transcription factor AN1 are expressed in response to light and play key roles in regulating anthocyanin biosynthesis in floral and vegetative organs14,15. In L. regale, light-induced R2R3-MYB factor LhMYB15 is implicated in the regulation of anthocyanin biosynthesis, contributing to characteristic pigmentation pattern formation in tepals13. In C. morifolium, light induces the expression of CmMYB9a while suppressing that of CmBBX28, a B-box protein that negatively regulates anthocyanin biosynthesis, thereby leading to anthocyanin accumulation in petals16.
Tricyrtis spp. are liliaceous ornamental plants native to Japan. One of the Tricyrtis cultivars, ‘Shinonome’, produces unique flowers with tepals bearing numerous randomly distributed reddish-purple spots on a light purple background. This flower color pattern is clearly different from variegation patterns caused by transposons17,18,19 and bicolor patterns caused by post-transcriptional gene silencing20,21. To elucidate the molecular mechanism of flower color pattern formation in Tricyrtis sp. ‘Shinonome’, we performed comprehensive isolation and expression analysis of the anthocyanin biosynthesis-related genes in this plant1,22. To date, seven flavonoid biosynthetic enzyme genes, TrCHS (AB478624; GenBank/EMBL/DDBJ databases; the same applies below), TrCHI (AB908277), TrF3H (LC209222), TrF3′H (AB480691), TrDFR (AB830112), TrFLS (LC103181), and TrANS (LC209106), and three transcription factor genes for the MBW complex, TrMYB1 (AB856412), TrbHLH2 (LC223741), and TrWDR (LC223742), have successfully been isolated. The expression of TrMYB1 in tepals is correlated with that of ‘late’ biosynthetic enzyme genes (TrF3’H, TrDFR, TrFLS and TrANS), suggesting that TrMYB1 may contribute to anthocyanin biosynthesis in tepals through regulation of these genes. However, the role of TrMYB1 in flower color pattern formation remains unclear.
In the present study, we examined the effects of light on anthocyanin biosynthesis and the expression of TrMYB1 in the tepals of Tricyrtis sp. ‘Shinonome’ by shading treatment of flower buds, and further analyzed the function of TrMYB1 through overexpression and RNAi-mediated knockdown in transgenic plants.
Result
Shading treatment of flower buds in Tricyrtis sp. ‘Shinonome’
To examine the effects of light on anthocyanin accumulation and the expression of anthocyanin biosynthesis-related genes in tepals of Tricyrtis sp. ‘Shinonome’, shading treatment of flower buds was carried out. Under non-shaded conditions, background coloration in tepals was observed from S1 flower buds onwards particularly on the abaxial side of the outer tepals (Fig. 1A). Spot formation was detectable in tepals of the S1 flower buds and expanded over the entire tepals from S2 onwards (Supplementary Fig. S1). In S5 flowers, tepals were characterized by numerous randomly distributed reddish-purple spots on a light purple background. On the other hand, under shaded conditions, background coloration in tepals was suppressed in S1–S4 flower buds (Fig. 1A). In S5 flowers, tepal background coloration was much reduced compared with those under non-shaded conditions, although reddish-purple spots were produced in the same manner as under non-shaded conditions (Fig. 1A).

Effects of shading treatment on flower buds in Tricyrtis sp. (A) Representative flower phenotypes at each developmental stage under non-shaded and shaded conditions. ab, abaxial side; ad, adaxial side. Bar = 1 cm. (B) Relative amounts of total anthocyanins in outer tepals at each developmental stage under non-shaded and shaded conditions. Data are shown as means ± standard errors (SE; n = 9). * indicates significant differences at p < 0.001 by Student’s t-test. (C) Expression levels of anthocyanin biosynthesis-related genes in outer tepals at S4 under non-shaded and shaded conditions. TrAct2 was used as an internal control. Cropped gel images are shown, and the corresponding full-length gel images are provided in Supplementary Figure S2.
Under shaded conditions, the relative amounts of total anthocyanins in outer tepals significantly decreased at all stages of flower development compared with those under non-shaded conditions (Fig. 1B). Real-time RT-PCR analysis for the expression of anthocyanin biosynthesis-related genes in outer tepals of S4 flower buds revealed that shading treatment reduced the expression levels of TrMYB1, TrbHLH2, TrF3’H, TrDFR, and TrANS (Fig. 1C). On the other hand, no apparent differences in the expression level of TrWDR and TrCHS were observed between shaded and non-shaded conditions (Fig. 1C). In inner tepals, background coloration was inherently faint, making the effect of shading less apparent than in outer tepals (Supplementary Fig. S2).
Promoter isolation and cis-element analysis of TrMYB1
To investigate whether TrMYB1 expression may be regulated by light, the upstream promoter region (− 2934 bp) of TrMYB1 was isolated, and cis-elements in the promoter sequence were analyzed. Several putative light-responsive cis-elements, including G-box, LAMP-element, AE-BOX, Box 4, and GT1-motif, were identified (Supplementary Fig. S3).
Overexpression of TrMYB1 in Tricyrtis sp. ‘Shinonome’
To assess the effect of TrMYB1 overexpression, TrMYB1 under the control of the cauliflower mosaic virus (CaMV) 35S promoter was introduced into Tricyrtis sp. ‘Shinonome’ (Fig. 2). Five independent transgenic lines (TrMYB1-OE2, -OE7, -OE8, -OE9, and -OE12) were obtained (Fig. 3A), among which TrMYB1-OE7 and -OE8 produced flowers (Fig. 3B). These transgenic lines showed enhanced pigmentation in most floral organs as well as in leaves compared with the wild type (WT) (Fig. 3A, B). However, no obvious pigmentation was observed in the basal region of the tepals. In contrast, pigmentation was markedly enhanced in naturally pigmented regions of the tepals of wild-type plants (Fig. 3B). In particular, TrMYB1-OE2, -OE7, -OE8, and -OE9 showed significantly increased anthocyanin accumulation in leaves (Fig. 3C), and TrMYB1-OE8 showed significantly increased anthocyanin accumulation in outer tepals of S5 flowers (Fig. 3D). Real-time RT-PCR analysis using leaves showed that the expression levels of TrMYB1 and enzyme genes (TrCHS, TrCHI, TrDFR, and TrANS) significantly increased in all five transgenic lines (Fig. 3E). TrbHLH2 expression also significantly increased in TrMYB1-OE2, -OE7, and -OE8, whereas no significant changes in TrWDR expression levels were observed in any of the five transgenic lines (Fig. 3E).
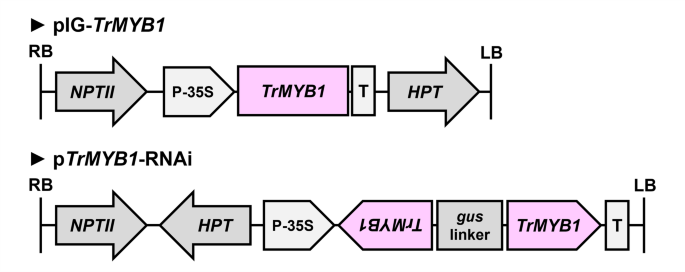
T-DNA regions of the vectors used for transformation. T-DNA regions of the overexpression vector (pIG-TrMYB1) and the RNAi-mediated knockdown vector (pTrMYB1-RNAi). gus linker, an internal fragment of the β-glucuronidase (GUS) gene connecting trigger sequences; HPT, hygromycin phosphotransferase gene driven by the CaMV35S promoter; LB, left border; NPTII, neomycin phosphotransferase II gene driven by the NOS promoter; P-35S, CaMV35S promoter; RB, right border; T, NOS terminator; TrMYB1, full-length cDNA or trigger sequence of TrMYB1.

Effects of TrMYB1 overexpression in transgenic plants (A) Representative leaf phenotypes of WT and transgenic plants. Bar = 2 cm. (B) Phenotypes of flowers of WT and transgenic plants. Bar = 1 cm. ab, abaxial side; ad, adaxial side. (C) Relative amounts of total anthocyanins in leaves of WT and transgenic plants. Data are shown as means ± SE (n = 3). *, ** and *** indicate significant differences compared with WT at p < 0.05, p < 0.01 and p < 0.001, respectively, by Dunnett’s test following one-way ANOVA. ns, not significant. (D) Relative amounts of total anthocyanins in outer tepals of WT and transgenic plants. Data are shown as means ± SE (n = 3). * indicates significant differences compared with WT at p < 0.01 by Dunnett’s test following one-way ANOVA. ns, not significant. (E) Relative expression levels of anthocyanin biosynthesis-related genes in leaves of WT and transgenic plants by real-time RT-PCR. Data are shown as means ± SE (n = 3). *, ** and *** indicate significant differences compared with WT at p < 0.05, p < 0.01 and p < 0.001, respectively, by Dunnett’s test following one-way ANOVA. ns, not significant.
RNAi-mediated knockdown of TrMYB1 in Tricyrtis sp. ‘Shinonome’
To further examine the function of TrMYB1, RNAi-mediated knockdown construct was introduced into Tricyrtis sp. ‘Shinonome’ (Fig. 2). Two independent transgenic lines (TrMYB1-RNAi1 and -RNAi2) were obtained and both produced flowers (Fig. 4A). In S5 flowers of both transgenic lines, background coloration on both the adaxial and abaxial sides of the tepals almost completely disappeared (Fig. 4A). By contrast, reddish-purple spots were still detectable, although their pigmentation intensity was markedly reduced compared with that in WT flowers (Fig. 4A). For both transgenic lines, the relative amounts of total anthocyanins in outer tepals of S5 flowers significantly decreased compared with WT (Fig. 4B). Real-time RT-PCR analysis using outer tepals of S5 flowers showed that the expression levels of TrMYB1 in TrMYB1-RNAi1 and -RNAi2 were reduced to approximately 10% and 20% of that in WT, respectively (Fig. 4C). The expression levels of enzyme genes (TrCHS, TrCHI, TrDFR, and TrANS) and TrbHLH2 were also substantially reduced in TrMYB1-RNAi1 and -RNAi2 (Fig. 4C). In particular, the expression levels of TrCHI and TrANS showed significant decreases in both transgenic lines (Fig. 4C). On the other hand, no significant changes in the TrWDR expression levels were observed in both transgenic lines (Fig. 4C).

Effects of RNAi-mediated knockdown of TrMYB1 in transgenic plants (A) Phenotypes of flowers of WT and transgenic plants. Bar = 1 cm. ab, abaxial side; ad, adaxial side. (B) Relative amounts of total anthocyanins in outer tepals of WT and transgenic plants. Data are shown as means ± SE (n = 3). * and ** indicate significant differences compared with WT at p < 0.05 and p < 0.01, respectively, by Dunnett’s test following one-way ANOVA. (C) Relative expression levels of anthocyanin biosynthesis-related genes in outer tepals of WT and transgenic plants by real-time RT-PCR. Data are shown as means ± SE (n = 3). * and ** indicate significant differences compared with WT at p < 0.05 and p < 0.01, respectively, by Dunnett’s test following one-way ANOVA. ns, not significant.
Discussion
To elucidate the molecular mechanism of flower color pattern formation in tepals of Tricyrtis sp., we previously performed comprehensive isolation and expression analyses of the anthocyanin biosynthesis-related genes1,22. In the present study, as a next step, we investigated the effect of light on anthocyanin biosynthesis in tepals and performed functional analysis of the R2R3-MYB gene TrMYB1, which may be involved in the regulation of anthocyanin biosynthesis in tepals.
Shading treatment of flower buds or inflorescences has been reported to reduce anthocyanin accumulation in tepals of several plant species, such as G. hybrida9, C. morifolium11, and L. regale13. Interestingly, background coloration in the tepals of Tricyrtis sp. was also largely reduced under shading conditions, whereas spot formation was scarcely affected (Fig. 1A). This differential response suggests that background coloration and spot formation in tepals are regulated by distinct mechanisms, in which background coloration is light dependent, whereas spot formation is largely light independent. Furthermore, the expression level of TrMYB1 decreased under shading conditions (Fig. 1C), indicating that TrMYB1 may be positively regulated by light. Consistent with this observation, several putative light-responsive cis-elements were identified in the TrMYB1 promoter (Supplementary Fig. S3), suggesting that its transcription may be associated with light-responsive regulatory mechanisms. Together, these findings suggest that TrMYB1 plays an important role in light-induced anthocyanin biosynthesis in tepals of Tricyrtis sp. Light-induced R2R3-MYB gene expression and anthocyanin biosynthesis have also been reported in other plant species, including P. hybrida14,15, L. regale13, and C. morifolium16, suggesting that similar regulatory mechanisms may be conserved across a wide range of higher plants.
In Arabidopsis thaliana, the anthocyanin biosynthesis–related R2R3-MYB transcription factors PAP1 and MYB12 are directly regulated by the light-responsive bZIP transcription factor HY523,24. HY5 directly interacts with the ubiquitin ligase COP1 and is degraded in the nucleus under dark conditions. In contrast, COP1 is inactivated upon light exposure, preventing HY5 degradation and resulting in its stabilization25. COP1 also directly regulates the stability of the R2R3-MYB transcription factors PAP1 and PAP226. Together, these light-dependent mechanisms regulate both the expression and protein stability of R2R3-MYB transcription factors, ultimately modulating anthocyanin biosynthesis. Similar regulatory mechanisms of light-induced anthocyanin biosynthesis mediated by COP1 and HY5 have been reported in other plant species, such as M. domestica and S. melongena12. Further studies are needed to clarify the molecular mechanism of light-induced TrMYB1 expression in Tricyrtis sp.
In our previous studies, heterologous expression of TrMYB1 increased anthocyanin accumulation in transgenic Pelargonium crispum and Kalanchoe blossfeldiana27,28, suggesting that TrMYB1 functions as a conserved regulator of anthocyanin biosynthesis across species. To further clarify its role in its native genetic background, we generated transgenic Tricyrtis plants overexpressing TrMYB1. Overexpression of TrMYB1 resulted in a significant increase in anthocyanin accumulation in the leaves (Fig. 3A, C). The expression levels of several anthocyanin biosynthetic enzyme genes (TrCHS, TrCHI, TrDFR, and TrANS) were also increased in the leaves of these transgenic plants (Fig. 3E), supporting the involvement of TrMYB1 in regulating anthocyanin biosynthesis. This result is consistent with our previous finding that TrMYB1 is associated with regulation of late biosynthetic genes1. The expression level of TrbHLH2 was also increased in the leaves of these transgenic plants, suggesting a possible regulatory relationship between TrMYB1 and TrbHLH2, either directly or indirectly through regulatory feedback mechanisms. Similarly, overexpression of R2R3-MYB genes has been shown to activate the expression of bHLH genes in various plant species29,30,31,32. Although the coordinated expression patterns strongly suggest the involvement of TrMYB1 in anthocyanin biosynthesis, direct binding between TrMYB1 and the promoters of anthocyanin biosynthesis-related genes has not yet been demonstrated. Further studies will be necessary to determine whether TrMYB1 directly regulates these genes. In addition, overexpression of TrMYB1 resulted in enhanced pigmentation in most floral organs (Fig. 3B). However, the absence of ectopic pigmentation in the basal region of the tepals in TrMYB1-overexpressing lines suggests that additional regulatory factors, such as bHLH and WDR transcription factors, may be required for anthocyanin accumulation in this region. By contrast, enhanced pigmentation was observed in regions that are already pigmented in the tepals of WT plants, implying that TrMYB1 alone may be sufficient to enhance anthocyanin biosynthesis in such regions.
In transgenic Tricyrtis sp. plants with RNAi-mediated knockdown of TrMYB1, both anthocyanin accumulation and the expression levels of anthocyanin biosynthetic enzyme genes, as well as TrbHLH2, decreased in outer tepals (Fig. 4B, C). Moreover, the flowers of transgenic plants showed a pronounced reduction of background coloration on both the adaxial and abaxial sides of the tepals, whereas reddish-purple spots were still detectable (Fig. 4A). These results indicate that background coloration and spot formation may be regulated by different mechanisms, and that TrMYB1 may play a central role in the formation of tepal background coloration through regulation of anthocyanin biosynthesis-related genes in Tricyrtis sp. The involvement of multiple R2R3-MYB transcription factors in the regulation of flower color pattern formation has been reported in several plant species. In P. hybrida, four R2R3-MYB genes have been identified as regulators of anthocyanin biosynthesis in tepals. Among them, AN2 and AN4 control pigmentation in the limb and tube of tepals, respectively33,34. In addition, DPL regulates veining in the petal tube, and PHZ is light inducible and associated with blushing flower buds15. In Clarkia gracilis, four R2R3-MYB genes involved in tepal pigmentation have also been identified35. Among them, CgMYB1C controls red spot formation, whereas CgMYB12 regulates background coloration in the basal (cup) region. CgMYB6 and CgMYB11 are also suggested to contribute to background coloration. In the present study, spot pigmentation was clearly reduced in the TrMYB1-RNAi lines. It is possible that additional R2R3-MYB transcription factors are involved in the regulation of spot pigmentation and that their activities may have been partly affected by off-target effects of the RNAi construct. Taken together, these findings suggest that multiple R2R3-MYBs, including TrMYB1, may cooperatively regulate flower color pattern formation in Tricyrtis sp.
In the present study, we demonstrated that TrMYB1 is expressed in response to light and regulates tepal background coloration by promoting anthocyanin biosynthesis. The results obtained here are expected to contribute significantly to studies on flower color pattern formation in ornamental plants. However, the molecular mechanism of tepal spot formation in Tricyrtis remains unclear. In particular, the mechanism underlying the formation of randomly distributed spots of various sizes has not yet been reported and represents a highly intriguing biological phenomenon. Therefore, elucidating the molecular basis of spot formation in Tricyrtis sp. may provide an important model system for understanding the general principles of flower color pattern formation, and further advances in this area are strongly anticipated.
Materials and methods
Plant materials and callus cultures
Potted plants of Tricyrtis sp. ‘Shinonome’ were obtained from commercial sources and cultivated in a greenhouse without heating at Niigata University. Embryogenic callus cultures used for transformation were induced and maintained as described by Nakano et al.36. No wild plant materials were collected for this study, and therefore no specific permits or licenses were required. The study did not involve endangered or protected species, and all experiments were conducted in accordance with relevant institutional guidelines.
Shading treatment of flower buds
Shading treatment was carried out by covering shoot apices with aluminum foil from the time of bract emergence until anthesis. Outer tepals were collected from samples with and without shading treatment at five different developmental stages: S1, flower buds of 6–10 mm in length; S2, flower buds of 11–15 mm in length; S3, flower buds of 16–20 mm in length; S4, flower buds just before anthesis (over 21 mm in length); and S5, flowers just after anthesis1.
RNA isolation and cDNA synthesis
Total RNA was extracted using RNeasy Mini Kit (QIAGEN, Hilden, Germany) and treated with RNase-Free DNase Set (QIAGEN, Hilden, Germany) according to the manufacturer’s instructions. cDNA was synthesized using ReverTra Ace qPCR RT Master Mix (Toyobo Co., Ltd., Osaka, Japan) according to the manufacturer’s instructions.
RT-PCR and real-time RT-PCR
Reverse transcription-polymerase chain reaction (RT-PCR) was performed using EmeraldAmp MAX PCR Master Mix (Takara Bio Inc., Shiga, Japan) on the T100 thermal cycler (Bio-Rad, Hercules, CA, USA) according to Otani et al.1.
Real-time RT-PCR was performed using KOD SYBR qPCR Mix (Toyobo Co., Ltd., Osaka, Japan) on the MyGo real-time PCR system (IT-IS Life Science Ltd., Dublin, Ireland). The specificity of the amplification products was confirmed by melting curve analysis. Real-time RT-PCR was performed in biological triplicate for each sample. Relative amounts of transcripts were normalized to the actin gene of Tricyrtis sp. (TrAct2; AB196260) and calculated using the 2−ΔΔCt method37.
Primer sets used for these analyses are listed in Supplementary Table S1 online.
Measurement of total anthocyanins
Total anthocyanins were extracted from outer tepals of flowers at different developmental stages and from leaves using the methanol-HCl method according to Rabino and Mancinelli38. Absorbance of the extracts was measured at 530 and 657 nm using a spectrophotometer (Eppendorf BioSpectrometer basic; Eppendorf, Hamburg, Germany). Total anthocyanin contents were calculated with the following formula: (A530—0.25 × A657) × M−1 [M: weight (g) of the plant material used for extraction].
Promoter isolation and cis-element analysis of TrMYB1
The upstream promoter region of TrMYB1 was isolated by TAIL-PCR39. Cis-regulatory elements in the promoter sequence were identified using the PlantCARE database40. Putative light-responsive cis-elements were identified based on the database annotations.
Vector construction and Agrobacterium-mediated transformation
Agrobacterium tumefaciens strains EHA101/pIG-TrMYB1 and EHA101/pTrMYB1-RNAi were used to produce transgenic plants for TrMYB1 overexpression and RNAi-mediated knockdown, respectively. The T-DNA region of pIG-TrMYB1 contained TrMYB1 driven by the CaMV 35S promoter, neomycin phosphotransferase II (NPTII) driven by the Nopaline Synthase (NOS) promoter, and hygromycin phosphotransferase (HPT) driven by the CaMV35S promoter (Fig. 2). The pTrMYB1-RNAi vector was constructed based on the pANDA35HK vector41,42. The T-DNA region of pTrMYB1-RNAi contained two inverted repeats of a 22-bp TrMYB1 trigger sequence fragment driven by the CaMV35S promoter, NPTII driven by the NOS promoter, and HPT driven by the CaMV35S promoter (Fig. 2). All primers used for vector construction are listed in Supplementary Table S1 online.
Transformation of Tricyrtis sp. ‘Shinonome’ was performed as previously described by Adachi et al.43. To confirm the transgenic nature of regenerated plantlets, PCR analyses were performed using primer sets specific to the T-DNA region (Supplementary Table S1 online). Transgenic plantlets were acclimatized and cultivated in a growth room at 25 °C under continuous light-emitting diode (LED) lighting (ca. 170 μmol m–2 s–1). Morphological, biochemical, and molecular characterizations of transgenic plants were performed during the flowering season.
Data availability
The datasets generated during and/or analysed during the current study are available from the corresponding author on reasonable request.
References
Otani, M. et al. Comprehensive isolation and expression analysis of the flavonoid biosynthesis-related genes in Tricyrtis spp. Biol. Plant. 62, 684–692. https://doi.org/10.1007/s10535-018-0802-7 (2018).
Winkel-Shirley, B. Flavonoid biosynthesis. A colorful model for genetics, biochemistry, cell biology, and biotechnology. Plant Physiol. 126, 485–493. https://doi.org/10.1104/pp.126.2.485 (2001).
Tanaka, Y., Sasaki, N. & Ohmiya, A. Biosynthesis of plant pigments: Anthocyanins, betalains and carotenoids. Plant J. 54, 733–749. https://doi.org/10.1111/j.1365-313X.2008.03447.x (2008).
Holton, T. A. & Cornish, E. C. Genetics and biochemistry of anthocyanin biosynthesis. Plant Cell 7, 1071–1083. https://doi.org/10.1105/tpc.7.7.1071 (1995).
Hichri, I. et al. Recent advances in the transcriptional regulation of the flavonoid biosynthetic pathway. J. Exp. Bot. 62, 2465–2483. https://doi.org/10.1093/jxb/erq442 (2011).
Jaakola, L. New insights into the regulation of anthocyanin biosynthesis in fruits. Trends Plant Sci. 18, 477–483. https://doi.org/10.1016/j.tplants.2013.06.003 (2013).
Ma, Y. et al. Light induced regulation pathway of anthocyanin biosynthesis in plants. Int. J. Mol. Sci. 22, 11116. https://doi.org/10.3390/ijms222011116 (2021).
Kawabata, S., Kusuhara, Y., Li, Y. & Sakiyama, R. The regulation of anthocyanin biosynthesis in Eustoma grandiflorum under low light conditions. J. Jpn. Soc. Hort. Sci. 68, 519–526. https://doi.org/10.2503/jjshs.68.519 (1999).
Meng, X. et al. The role of light in the regulation of anthocyanin accumulation in Gerbera hybrida. Plant Growth Regul. 44, 243–250. https://doi.org/10.1007/s10725-004-4454-6 (2004).
Feng, F., Li, M., Ma, F. & Cheng, L. Phenylpropanoid metabolites and expression of key genes involved in anthocyanin biosynthesis in the shaded peel of apple fruit in response to sun exposure. Plant Physiol. Biochem. 69, 54–61. https://doi.org/10.1016/j.plaphy.2013.04.020 (2013).
Hong, Y., Yang, L.-W., Li, M.-L. & Dai, S.-L. Comparative analyses of light-induced anthocyanin accumulation and gene expression between the ray florets and leaves in chrysanthemum. Plant Physiol. Biochem. 103, 120–132. https://doi.org/10.1016/j.plaphy.2016.03.006 (2016).
Jiang, M., Ren, L., Lian, H., Liu, Y. & Chen, H. Novel insight into the mechanism underlying light-controlled anthocyanin accumulation in eggplant (Solanum melongena L.). Plant Sci. 249, 46–58. https://doi.org/10.1016/j.plantsci.2016.04.001 (2016).
Yamagishi, M. A novel R2R3-MYB transcription factor regulates light-mediated floral and vegetative anthocyanin pigmentation patterns in Lilium regale. Mol. Breed. 36, 3. https://doi.org/10.1007/s11032-015-0426-y (2016).
Albert, N. W. et al. Light-induced vegetative anthocyanin pigmentation in Petunia. J. Exp. Bot. 60, 2191–2202. https://doi.org/10.1093/jxb/erp097 (2009).
Albert, N. W. et al. Members of an R2R3-MYB transcription factor family in Petunia are developmentally and environmentally regulated to control complex floral and vegetative pigmentation patterning. Plant J. 65, 771–784. https://doi.org/10.1111/j.1365-313X.2010.04465.x (2011).
Zhou, L.-J. et al. CmBBX28-CmMYB9a module regulates petal anthocyanin accumulation in response to light in Chrysanthemum. Plant Cell Environ. 48, 3750–3765. https://doi.org/10.1111/pce.15390 (2025).
Inagaki, Y., Hisatomi, Y., Suzuki, T., Kasahara, K. & Iida, S. Isolation of a suppressor-mutator/enhancer-like transposable element, Tpn1, from Japanese morning glory bearing variegated flowers. Plant Cell 6, 375–383. https://doi.org/10.1105/tpc.6.3.375 (1994).
van Houwelingen, A. et al. Analysis of flower pigmentation mutants generated by random transposon mutagenesis in Petunia hybrida. Plant J. 13, 39–50. https://doi.org/10.1046/j.1365-313X.1998.00005.x (1998).
Itoh, Y., Higeta, D., Suzuki, A., Yoshida, H. & Ozeki, Y. Excision of transposable elements from the chalcone isomerase and dihydroflavonol 4-reductase genes may contribute to the variegation of the yellow-flowered carnation (Dianthus caryophyllus). Plant Cell Physiol. 43, 578–585. https://doi.org/10.1093/pcp/pcf065 (2002).
Morita, Y. et al. Tandemly arranged chalcone synthase A genes contribute to the spatially regulated expression of siRNA and the natural bicolor floral phenotype in Petunia hybrida. Plant J. 70, 739–749. https://doi.org/10.1111/j.1365-313X.2012.04908.x (2012).
Koseki, M., Goto, K., Masuta, C. & Kanazawa, A. The star-type color pattern in Petunia hybrida ‘Red Star’ flowers is induced by sequence-specific degradation of chalcone synthase RNA. Plant Cell Physiol. 46, 1879–1883. https://doi.org/10.1093/pcp/pci192 (2005).
Kamiishi, Y. et al. Flower color alteration in the liliaceous ornamental Tricyrtis sp. by RNA interference-mediated suppression of the chalcone synthase gene. Mol. Breed. 30, 671–680. https://doi.org/10.1007/s11032-011-9653-z (2012).
Shin, D. H. et al. HY5 regulates anthocyanin biosynthesis by inducing the transcriptional activation of the MYB75/PAP1 transcription factor in Arabidopsis. FEBS Lett. 587, 1543–1547. https://doi.org/10.1016/j.febslet.2013.03.037 (2013).
Stracke, R. et al. The Arabidopsis bZIP transcription factor HY5 regulates expression of the PFG1/MYB12 gene in response to light and ultraviolet-B radiation. Plant Cell Environ. 33, 88–103. https://doi.org/10.1111/j.1365-3040.2009.02061.x (2010).
Osterlund, M. T. et al. Targeted destabilization of HY5 during light-regulated development of Arabidopsis. Nature 405, 462–466. https://doi.org/10.1038/35013076 (2000).
Maier, A. et al. Light and the E3 ubiquitin ligase COP1/SPA control the protein stability of the MYB transcription factors PAP1 and PAP2 involved in anthocyanin accumulation in Arabidopsis. Plant J. 74, 638–651. https://doi.org/10.1111/tpj.12153 (2013).
Fujimoto, T., Otani, M. & Nakano, M. Production of colored foliage phenotypes in Kalanchoe blossfeldiana by ectopic expression of R2R3 MYB genes. J. Plant Biochem. Biotechnol. 31, 665–672. https://doi.org/10.1007/s13562-021-00760-3 (2022).
Kanemaki, A. et al. Ectopic expression of the R2R3-MYB gene from Tricyrtis sp. results in leaf color alteration in transgenic Pelargonium crispum. Sci. Hortic. 240, 411–416. https://doi.org/10.1016/j.scienta.2018.06.029 (2018).
Baudry, A., Caboche, M. & Lepiniec, L. TT8 controls its own expression in a feedback regulation involving TTG1 and homologous MYB and bHLH factors, allowing a strong and cell-specific accumulation of flavonoids in Arabidopsis thaliana. Plant J. 46, 768–779. https://doi.org/10.1111/j.1365-313X.2006.02733.x (2006).
Gao, R. et al. MYB transcription factors GmMYBA2 and GmMYBR function in a feedback loop to control pigmentation of seed coat in soybean. J. Exp. Bot. 72, 4401–4418. https://doi.org/10.1093/jxb/erab152 (2021).
Spelt, C., Quattrocchio, F., Mol, J. N. M. & Koes, R. Anthocyanin1 of Petunia encodes a basic helix-loop-helix protein that directly activates transcription of structural anthocyanin genes. Plant Cell 12, 1619–1631. https://doi.org/10.1105/tpc.12.9.1619 (2000).
Xu, W. et al. Regulation of flavonoid biosynthesis involves an unexpected complex transcriptional regulation of TT8 expression, in Arabidopsis. New Phytol. 198, 59–70. https://doi.org/10.1111/nph.12142 (2013).
Quattrocchio, F., Wing, J. F., Leppen, H., Mol, J. & Koes, R. E. Regulatory genes controlling anthocyanin pigmentation are functionally conserved among plant species and have distinct sets of target genes. Plant Cell 5, 1497–1512. https://doi.org/10.1105/tpc.5.11.1497 (1993).
Quattrocchio, F., Wing, J. F., v. d. Woude, K., Mol, J. N. M. & Koes, R. Analysis of bHLH and MYB domain proteins: Species-specific regulatory differences are caused by divergent evolution of target anthocyanin genes. Plant J. 13, 475–488. https://doi.org/10.1046/j.1365-313X.1998.00046.x (1998).
Martins, T. R., Jiang, P. & Rausher, M. D. How petals change their spots: Cis-regulatory re-wiring in Clarkia (Onagraceae). New Phytol. 216, 510–518. https://doi.org/10.1111/nph.14163 (2017).
Nakano, M. et al. Somatic embryogenesis and plant regeneration from callus cultures of several species in the genus Tricyrtis. In Vitro Cell. Dev. Biol.-Plant 40, 274–278. https://doi.org/10.1079/IVP2003506 (2004).
Livak, K. J. & Schmittgen, T. D. Analysis of relative gene expression data using real-time quantitative PCR and the 2−ΔΔCT method. Methods 25, 402–408. https://doi.org/10.1006/meth.2001.1262 (2001).
Rabino, I. & Mancinelli, A. L. Light, temperature, and anthocyanin production. Plant Physiol. 81, 922–924. https://doi.org/10.1104/pp.81.3.922 (1986).
Liu, Y. G. & Chen, Y. High-efficiency thermal asymmetric interlaced PCR for amplification of unknown flanking sequences. Biotechniques 43, 649–656. https://doi.org/10.2144/000112601 (2007).
Lescot, M. PlantCARE, a database of plant cis-acting regulatory elements and a portal to tools for in silico analysis of promoter sequences. Nucleic Acids Res. 30, 325–327. https://doi.org/10.1093/nar/30.1.325 (2002).
Miki, D. & Shimamoto, K. Simple RNAi vectors for stable and transient suppression of gene function in Rice. Plant Cell Physiol. 45, 490–495. https://doi.org/10.1093/pcp/pch048 (2004).
Miki, D., Itoh, R. & Shimamoto, K. RNA silencing of single and multiple members in a gene family of Rice. Plant Physiol. 138, 1903–1913. https://doi.org/10.1104/pp.105.063933 (2005).
Adachi, Y., Mori, S. & Nakano, M. Agrobacterium-mediated production of transgenic plants in Tricyrtis hirta (Liliaceae). Acta Hort. 673, 415–419. https://doi.org/10.17660/ActaHortic.2005.673.52 (2005).
Funding
This work was supported in part by Grants-in-Aid for Scientific Research (Nos. 19K06028 and 24K08880) from the Ministry of Education, Culture, Sports, Science and Technology, Japan.
Author information
Authors and Affiliations
Contributions
Y.S. drafted the manuscript. M.N. and M.O. reviewed and edited the manuscript. Y.K. and M.S. performed gene isolation and characterization, and Y.S., K.I., and J.O. performed the transgenic experiments. I.K. performed promoter isolation and cis-element analysis. M.N. and M.O. designed and integrated the project.
Corresponding author
Ethics declarations
Competing interests
The authors declare no competing interests.
Additional information
Publisher’s note
Springer Nature remains neutral with regard to jurisdictional claims in published maps and institutional affiliations.
Supplementary Information
Below is the link to the electronic supplementary material.
Rights and permissions
Open Access This article is licensed under a Creative Commons Attribution 4.0 International License, which permits use, sharing, adaptation, distribution and reproduction in any medium or format, as long as you give appropriate credit to the original author(s) and the source, provide a link to the Creative Commons licence, and indicate if changes were made. The images or other third party material in this article are included in the article’s Creative Commons licence, unless indicated otherwise in a credit line to the material. If material is not included in the article’s Creative Commons licence and your intended use is not permitted by statutory regulation or exceeds the permitted use, you will need to obtain permission directly from the copyright holder. To view a copy of this licence, visit http://creativecommons.org/licenses/by/4.0/.
About this article

Cite this article
Shinoku, Y., Kazama, I., Kanemaki, Y. et al. Identification of an R2R3-MYB gene regulating tepal background coloration in Tricyrtis sp.. Sci Rep 16, 10743 (2026). https://doi.org/10.1038/s41598-026-46254-x
Received:
Accepted:
Published:
Version of record:
DOI: https://doi.org/10.1038/s41598-026-46254-x

