
Abstract
Over the past 15 years, research on Border Carbon Adjustment (BCA) advanced rapidly. However, comprehensive reviews of this field remained scarce, let alone visual analyses. Based on bibliometrics, this paper utilized CiteSpace and VOSviewer to analyze BCA-related literature from the WOSCC, CNKI, and arXiv databases spanning 2009 to 2024. The findings reveal three key insights: (1) Using WOSCC data, we construct the first knowledge network encompassing 46 countries, 464 institutions, 712 authors, and 122 journals. Through keyword timeline analysis, we trace the policy-driven thematic evolution of BCA research, while literature co-citation clustering identifies five global research hotspots: BCA mechanism design, policy efficacy assessment, socioeconomic impacts, supply chain complexities, and post-implementation governance strategies. (2) CNKI-based analysis highlights China’s transition from passive policy evaluation to proactive institutional innovation, offering a replicable framework for emerging economies. Meanwhile, arXiv publications emphasize technological innovations in emission reduction. (3) Emerging research frontiers coalesce around five directions: Multilateral rule games & North-South coordination, BCA policy refinement, Climate justice frameworks, AI/blockchain-driven carbon pricing and hybrid technology innovation, and advances in quantitative analytical tools. Furthermore, emerging economies are seeking context-specific solutions, such as China’s approach of integrating digital finance into the pathways toward achieving the dual-carbon goals.
Introduction
As an international climate governance agreement adopted at the United Nations Climate Conference, the core goal of the Paris Agreement is to limit the increase in global average temperature to within 2 degrees Celsius above pre-industrial levels (Mitchell et al., 2018; Rogelj et al., 2016). However, its implementation faces many challenges, one of which is the carbon leakage caused by differences in emission reduction goals and policy stringency (Babiker, 2005; King and van den Bergh, 2021). Carbon leakage refers to the phenomenon that when a country unilaterally implements a carbon pricing policy, its positive impact on the global environment is weakened, and the spillover effect in the international market results in an increase in carbon emissions in other countries, which partially or completely offsetting the effectiveness of the country’s emission reduction (Branger and Quirion, 2014a; Michalek and Schwarze, 2015). In order to deal with the carbon leakage problem, current strategies include strengthening international cooperation, output-based emission allowance allocation mechanism, and Border Carbon Adjustment (BCA)(van Asselt and Brewer, 2010). Among them, many scholars have pointed out that BCA is a very effective method (Christoph Böhringer et al., 2012a, 2012b; Mörsdorf, 2022; Winchester et al., 2011), as it represents a climate governance mechanism specifically designed to mitigate carbon leakage risks and preserve the integrity of domestic carbon pricing systems. This mechanism achieves competitive equity by levying carbon cost differentials on imports equivalent to domestic producers’ compliance costs, while simultaneously allowing export rebates for industries subject to carbon pricing regulations (Mehling et al., 2019). The call to introduce BCA originally originated in industrialized countries, but this concept remained at the level of theoretical discussion (Cosbey et al., 2019; DrÖGe et al., 2004). Until 2023, the European Union formally legislated to establish the Carbon Border Adjustment Mechanism (CBAM), which sparked a new wave of discussion (Bellora and Fontagné, 2023; Leal-Arcas et al., 2022). In this context, a systematic review of the literature in the field of BCA and in-depth insight into current research hotspots and cutting-edge developments is of great significance for guiding scholars to explore research in this field.
Currently, there are five major reviews in the field of BCA. Ma and Xu (2024) systematically reviewed the potential economic impact of BCA on target countries based on 109 articles, pointing out that major energy-exporting and industrialized countries will be adversely affected. The degree of influence for carbon-intensive exporting countries and countries with higher economic risks mainly depends on factors such as the identity of the implementing country and the specific design of the BCA. Zhong and Pei (2024) conducted a literature review of CBAM’s latest economic research, highlighting the potential impact of CBAM in protecting fair competition; reducing carbon leakage; and limiting global welfare costs. Böhringer et al. (2022) reviewed the potential environmental and economic impact of BCA in reducing carbon leakage, restoring competitiveness, cost effectiveness, fairness, and strengthening cooperation, noting that the feasibility of the BCA program may be significantly reduced due to current legal and practical implementation restrictions. Overland and Huda (2022) aimed to study the connection between CBAM and climate clubs. Fournier Gabela et al. (2024) proposed an agriculture-based CBAM design. However, existing reviews are mainly limited to a specific aspect of BCA, such as the policy impact level. No scholar has conducted a comprehensive review of the research course of BCA, let alone systematically summarize and analyze research in this field through information visualization. Therefore, this study integrates literature from the WOSCC, CNKI, and arXiv databases, employing CiteSpace and VOSviewer to comprehensively analyze knowledge networks, research hotspots, and frontiers in the field through bibliometric visualization.
We will answer the following questions about BCA:
RQ1: What are the pivotal countries/regions, institutions, authors, and journals in BCA research, and how do their collaboration networks operate globally?
RQ2: What are the dominant research hotspots and thematic evolution trends in BCA studies
RQ3: What are the research frontiers in BCA studies?
The remainder of this paper is structured as follows: “Methodology” describes the research instruments, methodologies, and data sources. “Results and discussion” analyzes and discusses the literature research from different databases, identifying the research frontiers in this domain. “Conclusions and limitations” provides a synthesis of the findings and addresses the limitations.
Methodology
Data collection
This study selects Web of Science Core Collection (WOSCC) as the primary database due to its extensive indexing of multidisciplinary, high-impact, international journals and its high compatibility with Citespace software (Archambault et al., 2006; Singh et al., 2021). To ensure comprehensive coverage, we incorporate data from China National Knowledge Infrastructure (CNKI), given China’s significant role as the world’s largest developing country and a major supplier of carbon-intensive products to the EUFootnote 1(S. Yan et al., 2023). Additionally, we include arXiv preprint data to capture the latest BCA research trends, enhancing the objectivity and timeliness of our analysis through multi-source cross-validation.
We downloaded relevant publications from WOSCC on 2024.11.9, applying the PRISMA 2020 guidelines with the following search strategy: TS = (“border carbon adjustment*” OR “carbon border adjustment*” OR “carbon border adjustment mechanism*” OR “carbon border adjustment measure*” OR “carbon border tax adjustment*” OR “border carbon tax adjustment*” OR “carbon border tax*” OR “border carbon tax*” OR “carbon tariff*”). Citation indexes were limited to SCIE and SSCI (Hue and Hung, 2025). Language was restricted to English. The study period ranged from 2009.1.1 to 2024.11.8. Research directions were filtered to exclude low-yield disciplines (e.g., physical geography, mathematical methods in social sciences), where each contributed ≤3 articles irrelevant to BCA research. Document types were confined to articles and review articles (Tang et al., 2024). A total of 300 articles were finalized for subsequent visual analysis, with the data collection process illustrated in Fig. 1.

Flowchart of literature screening using PRISMA2020 for WOSCC, CNKI, and arXiv.
The CNKI database employed the same search terms, selecting academic journals with source categories restricted to PKU Core Journals and CSSCI to ensure correspondence with high-quality articles from WOSCC. The study period was from 2009.1.1 to 2024.11.8. A total of 499 articles were retrieved, downloaded, and exported on 2025.4.4 for subsequent visualization analysis. The data collection process is illustrated in Fig. 1.
The preprint repository arXiv employed the same search terms on 2025.4.10, with the study period from 2009.1.1 to 2024.11.8. Using an “All fields” query, a total of 11 articles were retrieved. Compared with WOSCC, 4 duplicate articles were removed, leaving 7 articles for subsequent analysis. The data collection process is illustrated in Fig. 1.
Bibliometric analysis and visualization software
Bibliometric analysis is a method that uses software to visualize the distribution, connections among, and trends of countries, institutions, authors, journals, and research areas (Ellegaard and Wallin, 2015). It provides valuable predictions for future development in specific areas by providing insights into hot spots and trends (Chen, 2006). As databases such as the WOSCC become increasingly accessible to research data, bibliometric analysis is becoming increasingly popular as a research framework for assessing impact and evidence (Donthu et al., 2021; Wang et al., 2024).
This paper uses the built-in functions of the WOSCC to obtain key indicators such as the number of publications, citation frequency, and h-index (Joshi, 2014). In particular, the h-index, as a quantitative measure, was originally used to evaluate the contribution of individual researchers to academia (Bornmann and Daniel, 2007). Gradually, the application scope of the h-index has expanded to evaluate the academic influence of national or regional research teams, research institutions, academic groups, and even academic journals (Bornmann and Daniel, 2009). In addition, we use the Impact Factor (IF) and the latest version of Journal Citation Reports (JCR) as key indicators to measure the scientific value of journals (Eyre-Walker and Stoletzki, 2013; Magri and Solari, 1996).
In order to visualize and build a bibliometric network, this paper uses VOSviewer (version 1.6.20) and CiteSpace (version 6.4.R1) for bibliometric analysis (Moral-Muñoz et al., 2020; Todeschini, 2016). “VOSviewer, developed by Leiden University in the Netherlands, facilitates in-depth analysis of citation networks, co-citations, keyword co-occurrence, and international cooperation (van Eck and Waltman, 2017). Because it can simultaneously draw a network diagram and detect clusters in the network, the software can be combined with cluster analysis methods to divide the network into different clusters (Arruda et al., 2022). The CiteSpace software, created by Professor Chen Chaomei, is based on the Java platform to detect and identify the emergence and development of new technologies (Chen, 2014). CiteSpace can quickly understand the latest developments in literature, locate relevant information, such as core research literature, authors, etc., and draw a chronological chart of citations based on the relationship between literature development and the evolution of the field (Chen, 2017).
Results and discussion
Annual publication volume and trend
Between 2009 and 2024, we collected 300 and 499 articles related to BCAs from the WOSCC database and the CNKI database, respectively. Figure 2 illustrates the annual publication trends in both databases. For WOSCC, the initial publication count stood at 2 articles in 2009, rising to 17 by 2012 as the EU Aviation Carbon Tax dispute prompted academic discussion on carbon tariff legitimacy (Mendes and Santos, 2008). The 2015 Paris Agreement stimulated research on carbon leakage, with a rebound in related articles to 13 in 2016 (Christoff, 2016). However, the U.S. withdrawal from the Paris Agreement in 2017 resulted in a decline in publications from 2017 to 2019 (Pickering et al., 2018). Subsequently, the EU’s CBAM proposal in the 2019 European Green Deal reignited BCA research (Siddi, 2020). For CNKI, China’s initial carbon intensity pledge at the 2011 Copenhagen Conference (COP15) (Christoff, 2010) and emphasis on low-carbon economic development in domestic policiesFootnote 2 sparked academic interest (average of 88 articles per year in 2010–2011). The establishment of China’s carbon market in 2013 partially diverted research attention, leading to a subsequent decline in publications (Jiang, 2014). Until 2019, the EU CBAM proposal prompted a recovery in BCA-related publications, albeit not reaching previous peaks. A comparative analysis reveals that academic research is closely linked to policy, with WOSCC reflecting global policy trends and CNKI potentially emphasizing Chinese policy responses.

A comparison of annual publication volumes based on WOSCC and CNKI.
Analysis based on WOSCC database
Important countries or regions and cooperation network
BCA research has garnered global attention and is currently being conducted in 46 countries or regions worldwide. Table 1 lists the top 10 countries/regions in terms of the number of publications, along with information such as total citations, average citations, and h-index. China leads with an absolute advantage, publishing 90 articles (30%), followed by the United States with 67 (22.33%), and Germany with 54 (18%). Together, these three countries account for 70.33% of the total publications, serving as the main contributors and leaders in this field. In terms of citations, the United States ranks first with 1864 total citations, Germany second with 1683, and China third with 939. Notably, despite China’s high ranking in total citations among the top ten, its average citations are significantly lower, at only 10, compared to Germany’s 31 and the United States’ 28. Additionally, Norway has the highest average citations, with 43. In terms of the h-index, China, the United States, and Germany have values of 17, 24, and 23, respectively, which are notably higher than those of other countries, reflecting their higher academic standards.
Figure 3 presents a national geographical visualization cooperation network map generated by VOSviewer, which screens the top 30 countries in terms of BCA publications with a minimum of two articles. The network is divided into seven clusters, each represented by a distinct color. The size of the nodes indicates the number of publications, while the connections between them symbolize cooperation (Van Eck and Waltman, 2011). It is evident that key countries in the BCA field are primarily located in Europe, North America, and Asia. In Europe, Germany, Norway, and Spain stand out with significant network nodes, aligning with the EU’s position as an early international organization promoting climate policy and reflecting the advanced exploration of European countries in mitigating climate change (Oberthür and Roche Kelly, 2008). In addition, the United States and China also demonstrate robust research strength and influence (Bao et al., 2013). The dense and intertwined connections between these three countries—the US, China, and Germany—not only reveal their core roles in the global BCA network but also showcase their crucial function as bridges connecting different continents and fostering transnational cooperation (Kuehner et al., 2022).

Country/Region collaboration network analysis based on the WOSCC database.
Key institutions and collaborative network
Through the analysis of 464 research institutions, important institutions and cooperation networks for BCA research can be identified. Table 2 details the top ten research institutions in productivity and their information. Carl Von Ossietzky Universität Oldenburg leads with 16 publications (5.33%), followed by the University of London with 8 (2.67%). Beijing Institute of Technology, Massachusetts Institute of Technology, Tsinghua University, and the University of Wisconsin System tie at 7 (2.33% each). In citations, Carl Von Ossietzky Universität Oldenburg (906 citations, avg. 57 per paper) and the University of Wisconsin System (507 citations, avg. 72 per paper) significantly outperform others. Statistics Norway ranks third (231 citations, avg. 46 per paper). Notably, Carl Von Ossietzky Universität Oldenburg also boasts the highest h-index of 14, affirming its leading role in BCA research.
Figure 4 showcases an institutional cooperation network in the field of BCA produced by CiteSpace. In this network, nodes represent institutions, filtered using the g-index method with a threshold K set at 100 to include a broader range of institutions. The research spans from 2009 to 2024, employing an annual slicing approach (Chen, 2014). The display strategy for node labels is to showcase only those institutions with more than 4 publications. The size of the nodes reflects the number of publications, while the color represents the publication timeline. The density of connecting lines indicates the intensity of cooperation (Wang and Lu, 2020). Early institutions that were deeply involved in this field, such as Carl Von Ossietzky Universität Oldenburg, Statistics Norway, Norwegian University of Life Sciences, and University of Wisconsin System, have laid a solid foundation for the initial construction of a theoretical framework, but activities have slowed down in recent years (Christoph Böhringer et al., 2012a, 2012b; Böhringer et al., 2016; Böhringer et al., 2014). Although the cooperation networks of Beijing Institute of Technology, Xiamen University, Tsinghua University, Australian National University are relatively sparse, they have all shown a high degree of activity in the current field, reflecting their exploration of the frontiers of the field (Ren et al., 2023; Siy et al., 2023; Sun et al., 2024).

Institutional collaboration network analysis based on the WOSCC database.
An important network of authors and collaborators
Through an analysis of 712 authors and 6462 co-cited authors, significant authors and collaborations in this field have been identified. Table 3 lists the top ten authors by publication volume and the top ten co-cited authors by citation count. Boehringer tops the list with 12 papers, closely followed by Jakob with 7. Tied in third place with five papers each are Overland, Rutherford, Fischer, and Rosendahl. Notably, despite similar publication volumes among these top authors, there are significant differences in citation counts. Boehringer leads with 766 citations, while Jakob and Overland have relatively lower totals of 123 and 64 citations, respectively. Rutherford and Fischer also stand out in terms of citations, with 542 and 482, respectively, demonstrating strong influence. In terms of average citations per paper, Rutherford ranks first with 108, followed by Fischer with 96 and Boehringer with 64. These three authors excel both in output and academic influence within the BCA field.
Figure 5 is a co-cited author chord diagram generated by VOSviewer in conjunction with the Charticulator website. It displays the co-occurrence among 26 highly cited authors, each cited over 40 times. The entire circle is divided proportionally based on the citation frequency of each author. The wider the chord segment, the stronger the co-citation relationship between the authors it represents. Boehringer, Fischer, and Branger rank among the top three in terms of citations, with 407, 117, and 103 citations, respectively. Furthermore, authors such as Boehringer, Babiker, Fischer, Hoel, Kuik, Monjon, Nordhaus, and others have demonstrated close co-citation relationships, revealing their high correlation and mutual influence within academic research and knowledge contexts.

Chord diagram of co-cited authors based on WOSCC database.
Important journals and subject trends
A total of 122 academic journals have published articles in the BCA field, with the top ten in publication volume and citation listed in Table 4. The top ten journals account for 38.67% of total publications, six of which are also in the top ten most cited. “Climate Policy” published the most articles (23), with 486 citations. “Energy Economics” followed with 22 articles, but had a higher total of 843 citations. “Energy Policy” published 19 articles, with a total of 565 citations. These three are high-quality Q1 journals in the JCR, with IFs of 5.3, 13.6, and 9.3, respectively.
This study generates, for the first time, a dual-map overlay of BCA journal research (Fig. 6). The left half shows the discipline distribution of the citing journals (in dark yellow), representing the research frontier. The right half displays the discipline distribution of the cited journals (in light blue), reflecting the knowledge base (Chen, 2006). The numbers in parentheses next to the journal names indicate publication volumes (on the left) and citation counts (on the right). The colors of the arcs match those of the citing journals, and the ellipses represent journal clusters, with the number of ellipses reflecting the quantity of journals within each cluster (Chen, 2014).

Dual-graph overlay atlas of Journals based on the WOSCC database.
Based on Fig. 6, we observe two clusters of citing journals on the left. The top-left cluster (in bright yellow font) includes [10] Journal of Cleaner Production, categorized under “Veterinary, Animal, Science.” The bottom-left cluster (in dark blue) comprises [19] Energy Policy, [22] Energy Economics, and [23] Climate Policy, all focusing on “Economics, Economic, Political”. This indicates that these disciplines are at the forefront of BCA research, reflecting in-depth exploration of energy policies and climate change from economic, political, and scientific perspectives. On the right, the cited journal cluster (in dark blue) including [725] Energy Policy and [697] Energy Economics, among others, predominantly focuses on “Economics, Economic, Political,” demonstrating that these disciplines are not only at the cutting edge of BCA research but also serve as the foundational disciplines supporting the study. A smaller subset, [147] Applied Energy and [247] Journal of Cleaner Production, focuses on “Environmental, Toxicology, Nutrition,” highlighting that these disciplines provide indispensable knowledge support for BCA research and showcasing the unique appeal of interdisciplinary integration in BCA research.
Keywords time line analysis
This paper is based on a complementary analysis using both VOSviewer (Van Eck and Waltman, 2011) and CiteSpace (Chen, 2006) software to construct a co-occurrence network with 1113 keywords. The screening criteria were set as a co-occurrence frequency of no less than 7 for the analysis conducted using VOSviewer (as depicted in Fig. 7) or no less than 10 for the analysis conducted using CiteSpace (as shown in Fig. 8). The node size reflects the keyword frequency, and the colors and lines correspond to a year color scale. Since BCA is a policy instrument and inextricably linked to national regulations, the keyword timeline is analyzed in conjunction with policies.
-
(1)
Initial Exploration Period (2009–2017)
2009: Global Origins of BCA Policy Initiatives
The European Union adopted the Revised Emissions Trading System Directive, introducing the Carbon Leakage List during Phase III of the EU ETS (2013–2020)Footnote 3. This mechanism provided free quota allocations to high-carbon industries facing international competition, sparking academic research on the connection between “competitiveness loss” and “border tax adjustment” (Veel, 2009).
The U.S. House of Representatives passed the American Clean Energy and Security Act, which proposed International Reserve Allowances on imported goodsFootnote 4. Although never enacted, this was the first domestic bill to explicitly include BCA provisions, fueling discussions on “trade” (Weber and Peters, 2009) and “border tax adjustment” in academic circles (Izard et al., 2010; Zhang, 2010).
The Copenhagen Climate Summit (COP15) recognized “border measures to address competitiveness” Footnote 5. elevating BCA from unilateral national actions to a multilateral climate governance agenda. It also causes more and more international scholars to join the research of BCA (Gros and Egenhofer, 2011; Holmes et al., 2011; Moore, 2011).
2012: EU ETS Phase III Launch
The launch of Phase III of the EU ETS (2013–2020) marked the inclusion of the aviation sector in carbon regulations and a gradual increase in the auction quota ratio from 20 to 70% [3]. These reforms highlighted terms like “unilateral climate policy”, “energy”, and “EU ETS” in academic discourse (Helm et al., 2012; Springmann, 2012).
2017: China’s Carbon Market Pilot
China initiated its carbon market pilot program with the “National Carbon Emissions Trading Market Construction Plan” (Power Generation Industry) Footnote 6. This introduced “carbon pricing” and reflected China’s growing engagement in BCA research (Chen and Guo, 2017; Xu et al., 2017).
-
(2)
Deepening Development Period (2018–2021)
2019: European Green Deal
The European Commission unveiled the “European Green Deal” aiming for carbon neutrality by 2050 and proposing CBAM to mitigate carbon leakage risksFootnote 7. The policy has stimulated discussions on policy details such as “model” (Zhu et al., 2020), “carbon footprint” (Ortiz et al., 2022), and “efficiency”, with “EU” emerging as a key regional policy term (Evans et al., 2021; Fragkos et al., 2021).
2021: China’s National Carbon Market Launch
Following pilot programs, China established a unified national carbon market, initially covering the power generation industry, with plans to expand to high-emission sectors like cement, steel, and electrolytic aluminumFootnote 8. This reflects the institutional exploration of developing countries in participating in global climate governance (Eicke et al., 2021).
-
(3)
Mechanism Maturity Period (2021–2023)
Fig. 7 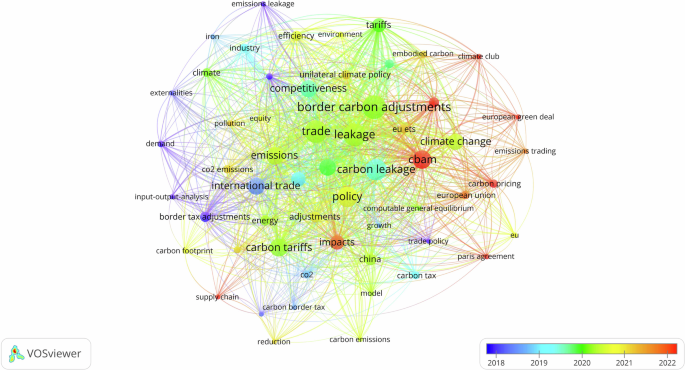
Keyword co-occurrence network based on the WOSCC database.
Fig. 8 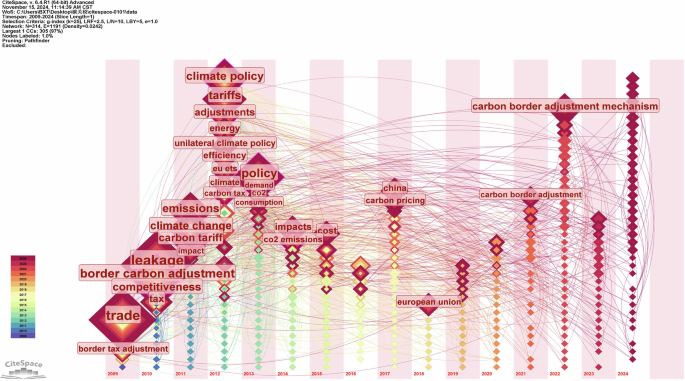
Time-zone map of keyword co-occurrence based on the WOSCC database.
In July 2021, the European Commission released the CBAM draft, outlining a transitional period (2023–2025) and full implementation by 2026Footnote 9. CBAM became law in May 2023, requiring importers to declare product carbon emissions and purchase certificatesFootnote 10. This triggered debates on “CBAM” (Lin and Zhao, 2023), “emissions trading”, and “climate club” (Tagliapietra and Wolff, 2021).


References co-citation analysis
Co-citation analysis is defined as the relationship formed when two documents are jointly cited by a third document (Chen, 2006). Using CiteSpace, we analyzed 300 articles with 10,624 cited references, generating 64 clusters (Fig. 9), of which 13 key clusters were identified(Blashfield and Aldenderfer, 1978). Parameters were set with references as nodes (K = 25) and clustered via the LLR algorithm. In Fig. 9, node size reflects citation frequency, node color denotes temporal distribution (red: high-burst; purple circles: centrality >0.1), and inter-cluster connections reveal thematic dependencies (Chen, 2006). Cluster #0 (“carbon border adjustment mechanism”) dominates the network with dense purple-red nodes, confirming its centrality as a research frontier. Strong linkages exist among #1 (“carbon leakage”), #2 (“European carbon border adjustment”), #3 (“designing border carbon adjustment”), and #5 (“climate policy”).

Cluster diagram of co-cited literature based on the WOSCC database.
The design evolution of BCA reflects three phases of academic exploration (#3, #8). First, early studies by Bradley et al. (2008) examined carbon leakage risks in US climate policy frameworks, aiming to explore climate policy under a level playing field. van Asselt and Brewer (2010) compared policy discussions in the U.S. and the European Union on how to address competitiveness and carbon leakage issues and believe the focus should be on the BCA measure. Monjon and Quirion (2010) proposed initial design considerations, recommending import adjustments through quota requirements (rather than taxes) to align with WTO compliance, export tax rebates linked to domestic emissions, and industry targeting based on carbon leakage risks and indirect emissions. Subsequently, Mehling et al. (2019) analyzed the legal implications of BCA design under international law, proposing partial revenue allocation to developing countries as a potential equity mechanism. Cosbey et al. (2019) improved benchmark methodologies by evaluating trade-offs between actual emissions data and industry standards, alongside practical challenges such as third-party verification costs. Finally, Keen et al. (2022) outlined unresolved design complexities, including debates over sectoral coverage, direct/indirect emissions accounting, carbon intensity measurement protocols, and exemptions for least-developed countries.
The effectiveness of BCA as a tool to address carbon leakage and competitiveness concerns has been extensively examined (#1, #5, #7, #11, #12): First, Branger and Quirion (2014a) suggested that well-designed BCA policies could cost-effectively mitigate carbon leakage, with subsequent meta-analysis of 310 leakage rates indicating a 6-percentage-point reduction under BCA implementation (Branger and Quirion, 2014b). Sectoral analyses further revealed BCA’s stronger leakage reduction in steel industries compared to mineral sectors (Kuik and Hofkes, 2010). Of course, there is no perfect policy tool, and BCA can effectively reduce carbon leakage, but the scope of global cost savings is small (C. Böhringer et al., 2012a, 2012b). However, compared with other policy tools, BCA still has certain advantages. Winchester (2018) demonstrated BCA’s superiority over strategic tariffs in minimizing welfare losses for non-restricting economies like the U.S. under Paris Agreement scenarios. Finally, evaluations of policy alternatives showed BCA’s effectiveness in reducing leakage and improving cost-efficiency compared to industry exemptions or output-based allocations, albeit exacerbating regional inequality (Christoph Böhringer et al., 2012a, 2012b). Comprehensive border adjustments, despite controversy, were identified as the most impactful approach when contrasted with import/export taxes or domestic rebates (Fischer and Fox, 2012).
The implementation of BCA in globalized supply chains faces three interconnected challenges (#9, #10). First, accurately measuring the carbon content of imports/exports remains a fundamental hurdle due to spatially fragmented production systems, where intermediate goods cross borders multiple times—amplifying tax revenue impacts and complicating carbon accounting (Zhang and Zhu, 2017; Zhang et al., 2017). Second, BCA exerts reactive effects on supply chain dynamics: Schenker et al. (2018) found divergent impacts on European industries, with upstream sectors benefiting from protection while downstream sectors faced negative consequences. Third, sector-specific analyses reveal broader implications. As demonstrated by López et al. (2015), BCA influences agricultural value chains and food mileage.
The global impacts of BCA, particularly the EU’s CBAM, reveal three critical dimensions (#0, #4). First, carbon-intensive industries and developing economies face disproportionate burdens—GTAP-e 11.0 and TOPSIS models indicate significant GDP and welfare losses in major steel-trading nations (Shuai et al., 2024), while energy-intensive sectors in both developing and developed economies experience asymmetric disadvantages relative to policy-imposing regions (Deng et al., 2024). Second, regional analyses identify Eastern European (Balkan states) and African economies (Mozambique, Zimbabwe, Cameroon) as most vulnerable, with Morocco and Tajikistan also exhibiting high socioeconomic sensitivity (Magacho et al., 2024). Finally, risk-index assessments confirm Africa’s heightened exposure across scenarios, where emission-intensive industries and national economies face systemic vulnerabilities (Eicke et al., 2021). These findings collectively underscore the spatially heterogeneous consequences of BCA implementation.
Post-implementation responses to BCA reveal three strategic dimensions (#2, #6). First, WTO disputes over BCA legality may trigger trade retaliation, with energy exporters favoring reciprocal tariffs to offset EU measures and enhance product competitiveness—though such actions risk damaging trade partnerships without fully neutralizing EU industrial gains (Clora et al., 2023; Fouré et al., 2016; Lim et al., 2021). Second, cooperative strategies prove more sustainable: dynamic game theory models suggest active stakeholder engagement (e.g., EU dialogue, low-tech advancement, market diversification, and domestic carbon pricing) can mitigate BCA impacts while improving cost efficiency (Huang et al., 2022; Ren et al., 2023). Finally, EU-centric analyses propose predictive frameworks to gauge global positions—evaluating trade dependencies, carbon intensity, WTO litigation tendencies, public climate sentiment, and innovation capacity—while exploring domestic political incentives and citizen-driven policy support (Jakob, 2023; Overland and Sabyrbekov, 2022; Sabyrbekov and Overland, 2024).
Analysis based on CNKI and the preprint site arXiv
Analysis of BCA development in China based on CNKI
Figure 10 (manually translated from Chinese) presents the results of a temporal cluster analysis of CNKI keywords, revealing a three-phase evolution in China’s BCA research through keyword dynamics, while offering a Chinese scholarly perspective for this review (Yan et al., 2023).

Time-zone map of keyword clustering based on the CNKI database.
Phase 1 (2009–2015): High-frequency keywords such as “BCA”, “climate change”, “international trade,” and “counterplan” epitomized Chinese academia’s passive responsiveness to external pressures. Research centered on defensive responses to Euro-American BCA measures, primarily relying on WTO rule-based compliance analysis, yet most studies remained confined to interpretive levels (Zhao and Guo, 2013). The dominant paradigm employed qualitative assessments using a hybrid “bibliometric + expert consultation” approach, with a scarcity of systematic empirical case studies (Yu, 2013). Notably, due to the absence of domestic firm-level carbon data, studies often constructed multi-regional models using OECD inter-country input-output tables, resulting in significant contextual mismatches (Lin and Li, 2012).
Phase 2 (2015–2020): Literature output during this period exhibited a pronounced trough, with annual CNKI publications dropping to single digits. However, the emergence of keywords like “carbon finance” and “carbon pricing” indicated a shift in focus toward domestic carbon market development and international rule alignment mechanisms (Zhang et al., 2016). Additionally, there was a marked increase in the application of CGE models, simulating BCA impacts on China’s GDP (Li and Wang, 2016).
Phase 3 (2020–2024): Following the explicit articulation of “carbon peak” and “carbon neutrality” strategic goals, over 80% of studies incorporated these as strategic contextual parameters for BCA research (Zhang, 2021). The prevalence of the keyword “coping suggestion” confirmed the diffusion of dynamic CGE models and MRIO analysis, with enhanced parameter estimation precision (Bo et al., 2024). Core concepts such as “carbon markets”, “carbon footprints,” and “digital finance” revealed ongoing efforts to construct an integrated analytical framework linking BCA and domestic carbon markets (Deng and Yin, 2022).
The evolution of research foci, as evidenced by keyword dynamics, reveals China’s BCA scholarship is transitioning from responsive adaptation to proactive institutional innovation within the global climate governance architecture. When contextualized against international counterparts—where EU studies emphasize technical refinement of compliance mechanisms (Overland and Sabyrbekov, 2022) and US research explores value chain carbon cost internalization(Leonelli, 2023)—China’s emerging research paradigm may offer referential pathways for economies navigating common governance dilemmas during low-carbon transition.
Analysis based on preprint site arXiv
Preprints offer emergent discourse analysis for frontier policy debates (Silagadze, 2023). In the BCA field, there are a total of seven articles, among which three were published before 2020. Zafar (2013) found that migrating to 4 G services could reduce carbon emissions by 63% for network operators, thereby demonstrating how technological transitions can align with BCA policy objectives while bringing further economic benefits. Farrahi Moghaddam et al. (2013) proposed IIGHGINT: A generalization to the modified GHG intensity universal indicator toward a production/consumption insensitive BCA. Schofield et al. (2016) presented a baseline-free method to identify responsive customers on dynamic time-of-use tariffs. The remaining 4 newer articles mainly focused on technological innovation and emission reduction. Gupta et al. (2025) discovered that smarter charging habits could reduce costs and carbon emissions for individual electric vehicle owners without significantly altering behavior or sacrificing user preferences. Becker et al. (2025) investigated the effect of electric vehicles, heat pumps, and solar panels on low-voltage feeders using evidence from smart meter profiles. Lee et al. (2022) explored reinforcement learning-based cooperative P2P power trading between DC nanogrid clusters with wind and PV energy resources. Wozny et al. (2023) proposed addressing carbon leakage challenges through methods inspired by CBAM and Climate Clubs, demonstrating the effectiveness of their approach by comparing simulated outcomes to representative concentration pathways (RCP) and shared socioeconomic pathways (SSP).
Research frontier
International frontier forecasting based on WOSCC
To further deepen the exploratory analysis of research frontiers, this study will conduct in-depth mining of the latest clustering outcomes (Cluster 0 and Cluster 6) generated through co-citation clustering of literature in the WOSCC database as independent datasets. With the co-occurrence frequency threshold set to 1, the latest chronological sequence diagrams of keywords are presented in Figs. 11 and 12. Based on the keyword co-occurrence diagram, future research directions are classified into five focal points.

Keyword Time-Zone map based on re-analysis of cluster 0 results from WOSCC literature co-citation.

Keyword Time-Zone map based on re-analysis of cluster 6 results from WOSCC literature co-citation.
The prominence of keywords including “climate clubs”, “EU CBAM”, “Paris Agreement”, and “developing countries” signals intensifying debates on multilateral rule-making and policy coordination. Implementing nations in the future may employ necessity tests to position BCA as the “least trade-restrictive” climate measure, while proportionality tests could cap BCA tax levels to mitigate carbon leakage risks. A potential WTO “climate exception clause”Footnote 11 might legitimize science-based BCA frameworks. climate clubs require critical evaluation of their compliance with the Paris Agreement’s “common but differentiated responsibilities”Footnote 12 principle to prevent North-South divisions (Tagliapietra and Wolff, 2021). Furthermore, existing studies predominantly focus on developed nations; future research should analyze heterogeneous developing countries, simulating BCA trade impacts on varying economic development levels and assessing differential export repercussions (Chu et al., 2024). High EU trade-dependent nations could model carbon cost pass-through capacities (Beaufils et al., 2023; Kitetu and Ko, 2024). Developing countries might also establish climate alliances or innovate South-South cooperation mechanisms to pursue international policy harmonization.
The prevalence of keywords including “steel enterprises”, “plastic trade,” and “global supply chains” underscores sector-specific policy refinement needs under evolving BCA mechanisms (Rübbelke et al., 2022). While the EU CBAM currently targets six sectors (iron/steel, aluminum, cement, fertilizers, electricity, hydrogen) as a foundational framework (Pató et al., 2022), future BCA frameworks could refine three research priorities: (1) Industry expansion to high-leakage-risk sectors like glass and ceramics, guided by national industrial profiles (Hancock and Wollersheim, 2021). (2) Pricing mechanism innovations combining long-term fixed rates for cost stability with short-term floating rates reflecting market dynamics. (3) Regulatory upgrades extending emission scopes to full lifecycle analysis, implementing multi-benchmark systems with dynamic defaults for data-deficient firms, and enforcing tiered supply chain disclosures with carbon transfer coefficients (Jia et al., 2025). Enhanced third-party verification protocols featuring cross-checks and fraud penalties further complete this framework (Li et al., 2023).
The prominence of keywords including “climate justice”, “carbon inequality,” and “burden-sharing rules” underscores accelerating discourse on ethical governance frameworks (Mintz-Woo, 2024). Future systematic solutions could evolve through three dimensions: First, distributive justice via dynamic Carbon Debt Index (CDI) models—integrating historical emissions, GDP per capita, and climate vulnerability—to enable algorithm-driven BCA tax adjustments (Li et al., 2023). Second, procedural justice requires multinational BCA ethics committees to audit policy marginalization effects and arbitrate carbon tariff disputes, while mandating Climate Justice Funds to oversee developed nations’ financial commitments. Third, restorative justice through quota-linked technology transfers, exemplified by EU-led “Technology for Carbon Quotas” programs granting CBAM fee reductions to developing countries adopting certified low-carbon solutions (Perdana and Vielle, 2022).
Keywords like “carbon pricing,” “carbon fees,” “cap-and-trade,” “export companies,” and “futures market” represent the emergence of new policy tools and their economic implications (Hamaguchi, 2024; Shen et al., 2023). Future advancements are anticipated to prioritize three trajectories: First, quantifying the “volatility suppression effect” through EU ETS-BCA interaction analyses will likely dominate research agendas, particularly in assessing how declining free quotas shape carbon price stability, supported by liquidity management tools such as quota reserve pools. Second, carbon tariff futures contracts with cross-cycle hedging mechanisms are expected to mitigate cost risks for export-dependent industries, contingent on integrating blockchain-enabled smart contracts into MRV systems for automated clearing and transparency. Third, embedding climate model projections into actuarial frameworks is foreseen to enable carbon tariff insurance derivatives, accelerating low-carbon transitions through refined risk pricing(Li et al., 2024). Collectively, these innovations are poised to reduce transaction friction while aligning financial mechanisms with climate imperatives.
Emerging analytical tools, including “CGE Model,” “GTAP-E Model,” and “MRIO Model,” signal future breakthroughs in empirical and technical domains(Lin et al., 2024). First, simplified BCA policy response models for developing countries—operable with limited export-sector emission data and historical carbon prices—could bridge empirical gaps in Southeast Asian contexts. Second, technical integration of MRIO into dynamic GTAP-E frameworks is expected to simulate BCA’s dual-phase impacts on global supply chains, while complex network models may enable real-time tracking of hydrogen/CCUS technology diffusion via low-carbon diffusion maps (Li et al., 2023). Third, CBAM exemption mechanisms could evolve through technology-industry correlation matrices, automatically excluding sectors surpassing zero-carbon technology penetration thresholds. Finally, multimodal AI systems integrating ERP data with regulatory databases are projected to automate carbon accounting and CBAM reporting, revolutionizing compliance workflows.
Frontier supplement based on Chinese perspective
This study utilized CiteSpace to extract the latest keyword data from CNKI’s BCA-related literature (Table 5), supplementing global frontier predictions with insights from Chinese research perspectives. Future investigations may focus on synergistic effects between “digital finance” and “dual carbon goals,” exploring blockchain-enabled optimization of cross-border carbon data traceability and automated BCA settlements via digital currencies(Shi et al., 2024). AI-driven dynamic “carbon forecasting models” could emerge as innovative tools to enhance “free allowance” allocation and policy resilience design. Compared with conventional carbon pricing mechanisms, “green technological innovations” (e.g., hydrogen steelmaking) and “carbon financial derivatives” (e.g., green bonds linked to carbon futures) may facilitate digital governance paradigm upgrades, offering technical references for global carbon markets(Ju and Liu, 2024).
Differentiated BCA designs can employ multi-indicator quantitative methods such as the “entropy weight method” to balance regional development and emission reduction targets, for instance, by integrating “carbon sink compensation” with tiered taxation mechanisms (Zhang et al., 2025). At the industrial level, synergies between “low-carbon standards” and technologies (e.g., full life cycle accounting of new energy vehicle batteries) may expedite international mutual recognition processes. The “friend-shoring outsourcing” cooperation model could provide developing countries with strategies to navigate green trade barriers while promoting the establishment of regional standard alliances (Pan and Lu, 2024).
The integration of cross-border data compliance management with lightweight carbon accounting tools could support developing countries in jointly implementing carbon sink trading and technology-for-carbon-credit swaps (e.g., clean energy in exchange for carbon credits). A flexible cooperation framework may replace the rigid climate club model, permitting differentiated emission reduction pathways while utilizing “scenario modeling” to anticipate policy shocks (Li and Liu, 2024). Such mechanisms hold potential for mitigating carbon cost transfer risks and facilitating the evolution of a multilateral low-carbon regulatory network (Li, 2024).
Conclusions and limitations
This study employs bibliometric tools (VOSviewer/CiteSpace) to analyze publications from the WOSCC, CNKI, and arXiv databases, offering a systematic overview of BCA research. Leveraging data from WOSCC, we constructed knowledge network maps spanning 46 countries, 464 institutions, 712 authors, and 122 journals. A keyword timeline analysis revealed three distinct policy-driven phases in BCA evolution: (1) EU/US BCA framework development (2009–2017); (2) China’s national carbon market implementation (2018–2021); (3) institutionalization of the CBAM (2021–2023). Literature-based co-citation clustering identifies five research hotspots—BCA design, policy effectiveness, socioeconomic impacts, supply chain challenges, and post-implementation strategies—revealing BCA’s evolution from unilateral climate tools to contested global governance instruments. Significantly, CNKI analysis demonstrates China’s paradigm shift: early WTO-compliance studies (2009–2015) transitioned to carbon market establishment (2016–2020), and subsequently to the integration of the “dual-carbon” strategy with digital finance, offering a replicable model for developing economies. Concurrently, arXiv contributions highlight technological solutions, such as smart EV charging, which reduces carbon emissions.
Future frontiers prioritize: (1) Multilateral rule game and political coordination to resolve the North-South gap; (2) Policy refinement incorporating additional industries; (3) climate justice frameworks; (4) Technological innovation of AI compliance systems, blockchain carbon derivatives and hybrid technology innovation; (5) Advances in quantitative analytical tools. Furthermore, emerging economies are seeking context-specific solutions, such as China’s unique innovations in digital finance and South-South alliances.
In summary, this study is the first to systematically review the research hotspots and development pathways in the BCA field, not only revealing the correlation between policy evolution and academic debates, but also providing clear directions for scholars’ future research. By comparing differences between international literature (mature policy systems) and Chinese literature (nascent policy development), this study aims to assist policymakers in establishing phased cognitive anchors and absorbing international experience. Ultimately, this work will promote BCA as a transformative link coordinating climate action, equity, and geopolitical dynamics, providing an empirical foundation for equitable decarbonization strategies.
This study has certain limitations. First, reliance on WOSCC, CNKI, and arXiv databases may exclude relevant studies from non-indexed sources or regional repositories. Second, CNKI’s focus on Chinese scholarship introduces geographic bias, while arXiv’s preprint inclusion risks incorporating non-peer-reviewed insights. Third, co-citation analysis emphasizes influential works, potentially marginalizing emerging perspectives. Future research could incorporate multi-language and regional databases to mitigate geographic bias, establish preprint screening mechanisms to ensure data reliability, and integrate Altmetrics or qualitative methods to capture emerging trends. Combining expert interviews with bibliometric analysis may balance academic impact assessment and frontier exploration.
Data availability
The data that support the findings of this study are available from the corresponding author, [Yuran Jin], upon reasonable request.
Notes
Eurostat (2023) EU trade in goods with China: Less deficit in 2023. https://ec.europa.eu/eurostat/en/web/products-eurostat-news/w/ddn-20240304-2. Accessed 10 Apr 2025.
Central People’s Government of China (2012) Greenhouse Gas Control Plan for the 12th Five-Year Plan Period. https://www.gov.cn/zhengce/content/2012-01/13/content_1294.htm. Accessed 10 Apr 2025.
European Union (2009) Directive 2009/29/EC on the amendment of the EU Emissions Trading System. https://eur-lex.europa.eu/legal-content/EN/TXT/?uri=CELEX:32009L0029. Accessed 10 Apr 2025.
The American Presidency Project (2009) Statement of Administration Policy: H.R. 2454 - American Clean Energy and Security Act of 2009. https://www.presidency.ucsb.edu/documents/statement-administration-policy-hr-2454-american-clean-energy-and-security-act-2009. Accessed 10 Apr 2025.
UNFCCC (2009) COP 15 Decisions. https://unfccc.int/process-and-meetings/conferences/past-conferences/copenhagen-climate-change-conference-december-2009/cop-15/cop-15-decisions. Accessed 10 Apr 2025.
National Development and Reform Commission of China (2017) Notice on the Issuance of the Construction Plan for the National Carbon Emissions Trading Market. https://www.ndrc.gov.cn/xxgk/zcfb/ghxwj/201712/t20171220_960930_ext.html. Accessed 10 Apr 2025.
European Commission (2019) Communication from the Commission: The European Green Deal. https://eur-lex.europa.eu/legal-content/EN/TXT/?uri=CELEX:52019DC0640. Accessed 10 Apr 2025.
Ministry of Ecology and Environment of China (2021) Administrative Measures for Carbon Emission Trading. https://www.mee.gov.cn/xxgk2018/xxgk/xxgk02/202101/t20210105_816131.html. Accessed 10 Apr 2025.
European Commission (2021) Proposal for a Regulation Establishing a Carbon Border Adjustment Mechanism. https://eur-lex.europa.eu/legal-content/EN/HIS/?uri=CELEX:52021PC0564. Accessed 10 Apr 2025.
European Union (2023) Regulation (EU) 2023/956 establishing the Carbon Border Adjustment Mechanism (CBAM). https://eur-lex.europa.eu/eli/reg/2023/956/oj/eng. Accessed 10 Apr 2025.
World Trade Organization (1947) General Agreement on Tariffs and Trade 1994 (GATT 1994). https://www.wto.org/english/docs_e/legal_e/gatt47_e.htm. Accessed 10 Apr 2025.
UNFCCC (2015) Paris Agreement. https://unfccc.int/sites/default/files/english_paris_agreement.pdf. Accessed 10 Apr 2025.
References
Archambault É, Vignola-Gagné É, Côté G, Larivière V, Gingrasb Y (2006) Benchmarking scientific output in the social sciences and humanities: The limits of existing databases. Scientometrics 68(3):329–342. https://doi.org/10.1007/s11192-006-0115-z
Arruda H, Silva ER, Lessa M, Proença Jr D, Bartholo R (2022) VOSviewer and bibliometrix. J Med Libr Assoc JMLA 110(3):392
Babiker MH (2005) Climate change policy, market structure, and carbon leakage. J Int Econ 65(2):421–445. https://doi.org/10.1016/j.jinteco.2004.01.003
Bao Q, Tang L, Zhang Z, Wang S (2013) Impacts of border carbon adjustments on China’s sectoral emissions: Simulations with a dynamic computable general equilibrium model. China Econ Rev 24:77–94
Beaufils T, Ward H, Jakob M, Wenz L (2023) Assessing different European Carbon Border Adjustment Mechanism implementations and their impact on trade partners. Commun Earth Environ 4(1). https://doi.org/10.1038/s43247-023-00788-4
Becker T, Smet R, Macharis B, Vanthournout K (2025) Effect of electric vehicles, heat pumps, and solar panels on low-voltage feeders: evidence from smart meter profiles. Sustain Energy Grids Netw 42:101705
Bellora C, Fontagné L (2023) EU in search of a carbon border adjustment mechanism. Energy Econ 123:106673. https://doi.org/10.1016/j.eneco.2023.106673
Blashfield RK, Aldenderfer MS (1978) The literature on cluster analysis. Multivar Behav Res 13(3):271–295. https://doi.org/10.1207/s15327906mbr1303_2
Bo Y, Wang W, Xie P (2024) The multidimensional impact of the EU carbon border regulation mechanism on the global steel industry. Prices Month (08), 79–87. https://doi.org/10.14076/j.issn.1006-2025.2024.08.09
Böhringer C, Carbone JC, Rutherford TF (2012b) Unilateral climate policy design: efficiency and equity implications of alternative instruments to reduce carbon leakage. Energy Econ 34:S208–S217. https://doi.org/10.1016/j.eneco.2012.09.011
Böhringer C, Balistreri EJ, Rutherford TF (2012a) The role of border carbon adjustment in unilateral climate policy: overview of an Energy Modeling Forum study (EMF 29). Energy Econ 34:S97–S110. https://doi.org/10.1016/j.eneco.2012.10.003
Böhringer C, Fischer C, Rosendahl KE (2014) Cost-effective unilateral climate policy design: size matters. J Environ Econ Manag 67(3):318–339. https://doi.org/10.1016/j.jeem.2013.12.008
Böhringer C, Carbone JC, Rutherford TF (2016) The strategic value of carbon tariffs. Am Econ J Econ Policy 8(1):28–51. https://doi.org/10.1257/pol.20130327
Böhringer C, Fischer C, Rosendahl KE, Rutherford TF (2022) Potential impacts and challenges of border carbon adjustments. Nat Clim Change 12(1):22–29. https://doi.org/10.1038/s41558-021-01250-z
Bornmann L, Daniel H-D (2007) What do we know about the h index? J Am Soc Inf Sci Technol 58(9):1381–1385. https://doi.org/10.1002/asi.20609
Bornmann L, Daniel HD (2009) The state of h index research: is the h index the ideal way to measure research performance? EMBO Rep. 10(1):2–6
Bradley R, Staley BC, Werksman J, Heilmayr R, Houser T (2008) Leveling the Carbon Playing Field: International Competition and U.S. Climate Policy Design. Peterson Institute for International Economics, Washington, DC
Branger F, Quirion P (2014b) Would border carbon adjustments prevent carbon leakage and heavy industry competitiveness losses? Insights from a meta-analysis of recent economic studies. Ecol Econ 99:29–39. https://doi.org/10.1016/j.ecolecon.2013.12.010
Branger F, Quirion P (2014a) Climate policy and the ‘carbon haven’ effect. WIREs Clim Change 5(1):53–71. https://doi.org/10.1002/wcc.245
Chen C (2006) CiteSpace II: detecting and visualizing emerging trends and transient patterns in scientific literature. J Am Soc Inf Sci Technol 57(3):359–377
Chen C (2014) The citespace manual. Coll Comput Inf 1(1):1–84
Chen C (2017) Science mapping: a systematic review of the literature. J Data Inf Sci 2(2):1–40. https://doi.org/10.1515/jdis-2017-0006
Chen WG, Guo Q (2017) Assessing the effect of carbon tariffs on international trade and emission reduction of China’s industrial products under the background of global climate governance. Sustainability 9(6). https://doi.org/10.3390/su9061028
Christoff P (2010) Cold climate in Copenhagen: China and the United States at COP15. Environ Politics 19(4):637–656. https://doi.org/10.1080/09644016.2010.489718
Christoff P (2016) The promissory note: COP 21 and the Paris Climate Agreement. Environ Politics 25(5):765–787. https://doi.org/10.1080/09644016.2016.1191818
Chu L, Do TN, Le THL, Ho QA, Dang K (2024) Carbon border adjustment mechanism, carbon pricing, and within-sector shifts: a partial equilibrium approach to Vietnam’s steel sector. Energy Policy 193. https://doi.org/10.1016/j.enpol.2024.114293
Clora F, Yu W, Corong E (2023) Alternative carbon border adjustment mechanisms in the European Union and international responses: aggregate and within-coalition results. Energy Policy 174:113454. https://doi.org/10.1016/j.enpol.2023.113454
Cosbey A, Droege S, Fischer C, Munnings C (2019) Developing guidance for implementing border carbon adjustments: lessons, cautions, and research needs from the literature. Rev Environ Econ Policy 13(1):3–22. https://doi.org/10.1093/reep/rey020
Deng H, Yin R (2022) Research on the function and institutional construction of china’s carbon emissions trading under the vision of carbon neutrality. North Leg Sci 16(02):5–15. https://doi.org/10.13893/j.cnki.bffx.2022.02.002
Deng Y, Yin M, Xu X, Yu L, Gao G, Ma L (2024) How to develop global energy-intensive sectors in the presence of carbon tariffs? J Int Financial Mark Inst Money 91:101930. https://doi.org/10.1016/j.intfin.2023.101930
Donthu N, Kumar S, Mukherjee D, Pandey N, Lim WM (2021) How to conduct a bibliometric analysis: an overview and guidelines. J Bus Res 133:285–296
DrÖGe S, Trabold H, Biermann F, BÖHm F, Brohm R (2004) National climate change policies and WTO law: a case study of Germany’s new policies. World Trade Rev 3(2):161–187. https://doi.org/10.1017/S1474745604001752
Eicke L, Weko S, Apergi M, Marian A (2021) Pulling up the carbon ladder? Decarbonization, dependence, and third-country risks from the European carbon border adjustment mechanism. Energy Res Soc Sci 80:102240. https://doi.org/10.1016/j.erss.2021.102240
Ellegaard O, Wallin JA (2015) The bibliometric analysis of scholarly production: How great is the impact? Scientometrics 105(3):1809–1831. https://doi.org/10.1007/s11192-015-1645-z
Evans S, Mehling MA, Ritz RA, Sammon P (2021) Border carbon adjustments and industrial competitiveness in a European Green Deal. Clim Policy 21(3):307–317. https://doi.org/10.1080/14693062.2020.1856637
Eyre-Walker A, Stoletzki N (2013) The assessment of science: the relative merits of post-publication review, the impact factor, and the number of citations. PLoS Biol 11(10):e1001675. https://doi.org/10.1371/journal.pbio.1001675
Fischer C, Fox AK (2012) Comparing policies to combat emissions leakage: border carbon adjustments versus rebates. J Environ Econ Manag 64(2):199–216. https://doi.org/10.1016/j.jeem.2012.01.005
Fouré J, Guimbard H, Monjon S (2016) Border carbon adjustment and trade retaliation: What would be the cost for the European Union? Energy Econ 54:349–362. https://doi.org/10.1016/j.eneco.2015.11.021
Fournier Gabela JG, Spiegel A, Stepanyan D, Freund F, Banse M, Gocht A, Söder M, Heidecke C, Osterburg B, Matthews A (2024) Carbon leakage in agriculture: when can a carbon border adjustment mechanism help? Clim Policy 24(10):1410–1425. https://doi.org/10.1080/14693062.2024.2387237
Fragkos P, Fragkiadakis K, Paroussos L (2021) Reducing the decarbonisation cost burden for EU energy-intensive industries. Energies 14(1):236
Gros D, Egenhofer C (2011) The case for taxing carbon at the border. Clim Policy 11(5):1262–1268. https://doi.org/10.1080/14693062.2011.592669
Gupta Y, Vreeland W, Peterman A, Girouard C, Wang B (2025) The untapped potential of smart charging: How EV owners can save money and reduce emissions without behavioral change. ArXiv. https://arxiv.org/abs/2503.03167
Hamaguchi Y (2024) Effects of a policy mix of uniform or unilateral environmental tax and trade liberalization on economic welfare. J Appl Econ 27(1). https://doi.org/10.1080/15140326.2024.2375913
Hancock L, Wollersheim L (2021) EU carbon diplomacy: assessing hydrogen security and policy impact in Australia and Germany. Energies 14(23). https://doi.org/10.3390/en14238103
Helm D, Hepburn C, Ruta G (2012) Trade, climate change, and the political game theory of border carbon adjustments. Oxf Rev Econ Policy 28(2):368–394. https://doi.org/10.1093/oxrep/grs013
Holmes P, Reilly T, Roll J (2011) Border carbon adjustments and the potential for protectionism. Clim Policy 11(2):883–900. https://doi.org/10.3763/cpol.2009.0071
Huang T, Liu Z, Zhao T (2022) Evolutionary game analysis of responding to the EU’s carbon border adjustment mechanism. Energies 15(2):427
Hue TT, Hung TH (2025) Impact of artificial intelligence on branding: a bibliometric review and future research directions. Humanit Soc Sci Commun 12(1):209. https://doi.org/10.1057/s41599-025-04488-6
Izard CF, Weber CL, Mattews HS (2010) Primary and embedded steel imports to the US: implications for the design of border tax adjustments. Environ Sci Technol 44(17):6563–6569. https://doi.org/10.1021/es101010u
Jakob M (2023) The political economy of carbon border adjustment in the EU. Oxf Rev Econ Policy 39(1):134–146
Jia F, Hu SF, Chen LJ (2025) Impact of carbon border adjustment mechanism on the stock market value of high-polluting firms in China: the role of supply chain risk management and internationalization capabilities. Transport Res Part E Log Transport Rev 197. https://doi.org/10.1016/j.tre.2025.104041
Jiang XY (2014) The rise of carbon emissions trading in China: a panacea for climate change? Clim Dev 6(2):111–121. https://doi.org/10.1080/17565529.2013.857590
Joshi MA (2014) Bibliometric indicators for evaluating the quality of scientific publications. J Contemp Dent Pract 15(2):258
Ju R, Liu J (2024) Mechanism and implementation pathway for carbonfinance empowering carbon neutrality. J South Cent Minzu Univ Humanit Soc Sci 44(07):134–144. https://doi.org/10.19898/j.cnki.42-1704/C.20240523.03
Keen M, Parry I, Roaf J (2022) Border carbon adjustments: rationale, design and impact. Fisc Stud 43(3):209–234. https://doi.org/10.1111/1475-5890.12307
King LC, van den Bergh JCJM (2021) Potential carbon leakage under the Paris Agreement. Clim Change 165(3):52. https://doi.org/10.1007/s10584-021-03082-4
Kitetu GM, Ko JH (2024) A comparative study on the impact of EU carbon border adjustment mechanism on Korea, China, and Japan. J Korea Trade 28(6). https://doi.org/10.35611/jkt.2024.28.6.199
Kuehner A-K, Jakob M, Flachsland C (2022) German stakeholder perceptions of an EU carbon border adjustment mechanism. Environ Res Lett 17(12):124007
Kuik O, Hofkes M (2010) Border adjustment for European emissions trading: Competitiveness and carbon leakage. Energy Policy 38(4):1741–1748. https://doi.org/10.1016/j.enpol.2009.11.048
Leal-Arcas R, Faktaufon M, Kyprianou A (2022) A legal exploration of the European Union’s carbon border adjustment mechanism. Eur Energy Environl Law Rev 31(4):223–240
Lee S, Nengroo SH, Jin H, Heo T, Doh Y, Lee C, Har D (2022) Reinforcement learning-based cooperative P2P power trading between DC nanogrid clusters with wind and PV energy resources. ArXiv. https://arxiv.org/abs/2209.07744
Leonelli GC (2023) The long and winding road towards the creation of climate clubs: transatlantic negotiations, potential regulatory models and challenges ahead. Rev Eur Comp Int Environ Law 32(3):453–464. https://doi.org/10.1111/reel.12499
Li J, Wang Y (2016) Effects of border carbon adjustment to competitiveness of China’s EITE industries and carbon leakage. China Popul Res Environ 26(12):87–93. (In Chinese)
Li W, Liu X (2024) Carbon emission reduction prospects of China’s foreign steel trade considering CBAM. J Ind Technol Econ 43(08):118–128
Li W, Liu X, Lu C (2023) Analysis of China’s steel response ways to EU CBAM policy based on embodied carbon intensity prediction. Energy 282. https://doi.org/10.1016/j.energy.2023.128812
Li XL, Zhou W, Lo TY, Lin JH (2024) International climate policy dilemmas: examining effective carbon tariff and cap-and-trade regulation from a sustainable insurance perspective. Energy Econ 134. https://doi.org/10.1016/j.eneco.2024.107572
Li Y (2024) The impact of the EU carbon border adjustment mechanism and China’s Response—from the perspective of the high-quality development of “the belt and road”. J Int Econ Law (02):114–128
Lim B, Hong K, Yoon J, Chang J-I, Cheong I (2021) Pitfalls of the EU’s carbon border adjustment mechanism. Energies 14(21):7303
Lin B, Li A (2012) Is carbon motivated border tax justifiable? Econ Res J 47(11):118–127. (In Chinese)
Lin BQ, Zhao HS (2023) Which sectors should be covered by the EU carbon border adjustment mechanism? Adv Clim Change Res 14(6):952–962. https://doi.org/10.1016/j.accre.2023.11.012
Lin CC, Peng YC, Kang JR (2024) Joint green dynamic order batching and picker routing problem using PSO with global worst experience. Appl Soft Comput 154. https://doi.org/10.1016/j.asoc.2024.111336
López L-A, Cadarso M-A, Gómez N, Tobarra M-Á (2015) Food miles, carbon footprint and global value chains for Spanish agriculture: assessing the impact of a carbon border tax. J Clean Prod 103:423–436. https://doi.org/10.1016/j.jclepro.2015.01.039
Ma J, Xu J (2024) Potential economic impacts of carbon tariffs on target countries: a systematic review. Clim Policy 1–17. https://doi.org/10.1080/14693062.2024.2407830
Magacho G, Espagne E, Godin A (2024) Impacts of the CBAM on EU trade partners: consequences for developing countries. Clim Policy 24(2):243–259. https://doi.org/10.1080/14693062.2023.2200758
Magri M-H, Solari A (1996) The SCI journal citation reports: a potential tool for studying journals? I. Description of the JCR journal population based on the number of citations received, number of source items, impact factor, immediacy index and cited half-life. Scientometrics 35(1):93–117
Mehling MA, van Asselt H, Das K, Droege S, Verkuijl C (2019) Designing border carbon adjustments for enhanced climate action. Am J Int Law 113(3):433–481. https://doi.org/10.1017/ajil.2019.22
Mendes LMZ, Santos G (2008) Using economic instruments to address emissions from air transport in the European Union. Environ Plan Econ Space 40(1):187–209. https://doi.org/10.1068/a39255
Michalek G, Schwarze R (2015) Carbon leakage: pollution, trade or politics? Environ Dev Sustain 17(6):1471–1492. https://doi.org/10.1007/s10668-014-9616-8
Mintz-Woo K (2024) Carbon tax ethics. Wiley Interdisc Rev Clim Change 15(1). https://doi.org/10.1002/wcc.858
Mitchell D, Allen MR, Hall JW, Muller B, Rajamani L, Le Quéré C (2018) The myriad challenges of the Paris Agreement. Philos. Trans. R. Soc. a-Math. Phys. Eng. Sci. 376(2119). https://doi.org/10.1098/rsta.2018.0066
Moghaddam RF, Moghaddam FF, Cheriet M (2013) IIGHGINT: A generalization to the modified GHG intensity universal indicator toward a production/consumption insensitive border carbon tax. ArXiv. https://arxiv.org/abs/1401.0301
Monjon S, Quirion P (2010) How to design a border adjustment for the European Union Emissions Trading System? Energy Policy 38(9):5199–5207. https://doi.org/10.1016/j.enpol.2010.05.005
Moore MO (2011) Implementing carbon tariffs: a fool’s errand? World Econ 34(10):1679–1702. https://doi.org/10.1111/j.1467-9701.2011.01406.x
Moral-Muñoz JA, Herrera-Viedma E, Santisteban-Espejo A, Cobo MJ (2020) Software tools for conducting bibliometric analysis in science: an up-to-date review. Prof Inf 29(1)
Mörsdorf G (2022) A simple fix for carbon leakage? Assessing the environmental effectiveness of the EU carbon border adjustment. Energy Policy 161:112596. https://doi.org/10.1016/j.enpol.2021.112596
Oberthür S, Roche Kelly C (2008) EU leadership in international climate policy: achievements and challenges. Int Spect 43(3):35–50
Ortiz M, Cadarso MA, Lopez LA, Jiang XM (2022) The trade-off between the economic and environmental footprints of multinationals’ foreign affiliates. Struct Change Econ Dyn 62:85–97. https://doi.org/10.1016/j.strueco.2022.05.005
Overland I, Sabyrbekov R (2022) Know your opponent: Which countries might fight the European carbon border adjustment mechanism? Energy Policy 169:113175
Overland I, Huda MS (2022) Climate clubs and carbon border adjustments: a review. Environ Res Lett 17(9). https://doi.org/10.1088/1748-9326/ac8da8
Pan L, Lu Z (2024) Research on the development and cooperative pathways of green economy between China and ASEAN under the dual carbon goals. J Guangxi Univ 46(03):174–184. https://doi.org/10.13624/j.cnki.jgupss.2024.03.023
Pató Z, Mezosi A, Szabó L (2022) Is border carbon adjustment the right tool for the power sector? Clim Policy 22(4):502–513. https://doi.org/10.1080/14693062.2022.2043819
Perdana S, Vielle M (2022) Making the EU carbon border adjustment mechanism acceptable and climate friendly for least developed countries. Energy Policy 170. https://doi.org/10.1016/j.enpol.2022.113245
Pickering J, McGee JS, Stephens T, Karlsson-Vinkhuyzen SI (2018) The impact of the US retreat from the Paris Agreement: kyoto revisited? Clim Policy 18(7):818–827. https://doi.org/10.1080/14693062.2017.1412934
Ren YA, Liu GX, Shi L (2023) The EU carbon border adjustment mechanism will exacerbate the economic-carbon inequality in the plastic trade. J Environ Manag 332. https://doi.org/10.1016/j.jenvman.2023.117302
Rogelj J, den Elzen M, Höhne N, Fransen T, Fekete H, Winkler H, Schaeffer R, Sha F, Riahi K, Meinshausen M (2016) Paris Agreement climate proposals need a boost to keep warming well below 2 °C. Nature 534(7609):631–639. https://doi.org/10.1038/nature18307
Rübbelke D, Vögele S, Grajewski M, Zobel L (2022) Hydrogen-based steel production and global climate protection: an empirical analysis of the potential role of a European cross border adjustment mechanism. J Clean Product 380. https://doi.org/10.1016/j.jclepro.2022.135040
Sabyrbekov R, Overland I (2024) Small and large friends of the EU’s carbon border adjustment mechanism: Which non-EU countries are likely to support it? Energy Strategy Rev 51:101303. https://doi.org/10.1016/j.esr.2024.101303
Schenker O, Koesler S, Löschel A (2018) On the effects of unilateral environmental policy on offshoring in multi-stage production processes. Can J Econ Rev Can Econ 51(4):1221–1256. https://doi.org/10.1111/caje.12354
Schofield J, Tindemans S, Strbac G (2016) A baseline-free method to identify responsive customers on dynamic time-of-use tariffs. https://doi.org/10.48550/arXiv.1605.08078
Shen HT, Yang Q, Luo L, Huang N (2023) Market reactions to a cross-border carbon policy: evidence from listed Chinese companies. Br Account Rev 55(1). https://doi.org/10.1016/j.bar.2022.101116
Shi Z, Long F, Lei X (2024) The new characteristics, new challenges and countermeasures of China’s high-quality development of foreign trade. Intertrade (06):54–62. https://doi.org/10.14114/j.cnki.itrade.2024.06.005
Shuai J, Wang W, Liu H, Huang C, Yi T, Zhao Y, Shuai C (2024) The impact of the EU’s carbon border adjustment Mechanism on the global iron and steel trade and emission reduction. Environ Sci Pollut Res 31(14):21524–21544. https://doi.org/10.1007/s11356-024-32528-2
Siddi M (2020) The European Green Deal: asseasing its current state and future implementation. Upi Rep 114
Silagadze ZK (2023) On arXiv moderation system. J Inform 17(3). https://doi.org/10.1016/j.joi.2023.101433
Singh VK, Singh P, Karmakar M, Leta J, Mayr P (2021) The journal coverage of Web of Science, Scopus and Dimensions: a comparative analysis. Scientometrics 126(6):5113–5142. https://doi.org/10.1007/s11192-021-03948-5
Siy AL, Wang AZ, Zheng TT, Hu, X (2023) Research on the Impact of the EU’s carbon border adjustment mechanism: based on the GTAP model. Sustainability 15(6). https://doi.org/10.3390/su15064761
Springmann M (2012) A look inwards: carbon tariffs versus internal improvements in emissions-trading systems. Energy Econ 34:S228–S239. https://doi.org/10.1016/j.eneco.2012.08.039
Sun XL, Mi ZF, Cheng L, Coffman D, Liu Y (2024) Article The carbon border adjustment mechanism is inefficient in addressing carbon and results in unfair welfare losses. Fundamental Res 4(3):660–670. https://doi.org/10.1016/j.fmre.2023.02.026
Tagliapietra S, Wolff GB (2021) Conditions are ideal for a new climate club. Energy Policy 158. https://doi.org/10.1016/j.enpol.2021.112527
Tang Y, Liu L, Pan T, Wu Z (2024) A bibliometric analysis of cultural heritage visualisation based on Web of Science from 1998 to 2023: a literature overview. Humanit Soc Sci Commun 11(1):1081. https://doi.org/10.1057/s41599-024-03567-4
Todeschini R, Baccini A (2016) Handbook of Bibliometric Indicators: Quantitative Tools for Studying and Evaluating Research. Wiley-VCH, Weinheim
van Asselt H, Brewer T (2010) Addressing competitiveness and leakage concerns in climate policy: an analysis of border adjustment measures in the US and the EU Energy Policy 38(1):42–51. https://doi.org/10.1016/j.enpol.2009.08.061
Van Eck NJ, Waltman L (2011) VOSviewer manual. Manual for VOSviewer version 1(0)
van Eck NJ, Waltman L (2017) Citation-based clustering of publications using CitNetExplorer and VOSviewer Scientometrics 111(2):1053–1070. https://doi.org/10.1007/s11192-017-2300-7
Veel P-E (2009) Carbon tariffs and the WTO: an evaluation of feasible policies. J Int Econ Law 12(3):749–800
Wang Q, Ren F, Li R (2024) Geopolitics and energy security: a comprehensive exploration of evolution, collaborations, and future directions. Humanit Soc Sci Commun 11(1):1071. https://doi.org/10.1057/s41599-024-03507-2
Wang W, Lu C (2020) Visualization analysis of big data research based on Citespace. Soft Comput 24(11):8173–8186
Weber CL, Peters GP (2009) Climate change policy and international trade: policy considerations in the US. Energy Policy 37(2):432–440. https://doi.org/10.1016/j.enpol.2008.09.073
Winchester N (2018) Can tariffs be used to enforce Paris climate commitments? World Econ 41(10):2650–2668. https://doi.org/10.1111/twec.12679
Winchester N, Paltsev S, Reilly JM (2011) Will border carbon adjustments work? The B.E. J Econ Anal Policy 11(1). https://doi.org/10.2202/1935-1682.2696
Wozny P, Renting B, Loftin R, Wieners C, Acar E (2023) AI4GCC - team: below sea level: score and real world relevance. https://doi.org/10.48550/arXiv.2307.13892
Xu SC, Zhang WW, Gao C, Long RY, Chen H (2017) Impacts of carbon tariffs on China’s economic structure and carbon intensity: Simulation analysis using a dynamic CGE model. Fresenius Environ Bull 26:4742–4756
Yan S, Pang M, Wang J, Chen R, Liu H, Xu X, Li B, Li Q, Kong F (2023) A comparative study of bibliometric analysis on old adults’ cognitive impairment based on Web of Science and CNKI via CiteSpace. Health Econ Rev 13(1):56. https://doi.org/10.1186/s13561-023-00470-7
Yu H (2013) The review and prospect of carbon tariff studies. Int Econ Trade Res 29(03):28–36. https://doi.org/10.13687/j.cnki.gjjmts.2013.03.007
Zafar S (2013) The Economic and Sustainability Future of Cellular Networks. ArXiv. https://doi.org/10.48550/arXiv.1308.0795
Zhang X, Zhang Q, Ning X (2016) The impact of EU ETS on China’s Carbon-intensive Industry Import-export Trade. West Forum 26(05):81–89. (In Chinese)
Zhang Z, Zhu K (2017) Border carbon adjustments for exports of the United States and the European Union: taking border-crossing frequency into account. Appl Energy 201:188–199. https://doi.org/10.1016/j.apenergy.2017.05.065
Zhang Z, Zhu K, Hewings GJD (2017) The effects of border-crossing frequencies associated with carbon footprints on border carbon adjustments. Energy Econ 65:105–114. https://doi.org/10.1016/j.eneco.2017.04.017
Zhang ZX (2010) The US proposed carbon tariffs and China’s responses. Energy Policy 38(5):2168–2170. https://doi.org/10.1016/j.enpol.2009.12.026
Zhang Y, Li J, Ji X, Yang M, Dong Z, Wen F (2025) Optimal dispatch and electricity-carbon-green certificate trading of parks for carbon border adjustment mechanism. Autom Electric Power Syst 1–17.https://link.cnki.net/urlid/32.1180.TP.20250403.1659.002
Zhang Z (2021) China and the world under the targets of carbon peak and carbon neutralization —green low-carbon transformation, green finance, carbon market and carbon border adjustment mechanism. Frontiers (14):69–79. https://doi.org/10.16619/j.cnki.rmltxsqy.2021.14.008
Zhao Y, Guo F (2013) Coherence of carbon tariff with WTO rules: a study based on WTO settlement of environment-related trade disputes. Int Business (03):83–89. https://doi.org/10.13509/j.cnki.ib.2013.03.004
Zhong JR, Pei JS (2024) Carbon border adjustment mechanism: a systematic literature review of the latest developments. Clim Policy 24(2):228–242. https://doi.org/10.1080/14693062.2023.2190074
Zhu L, Cui LB, Schleich J (2020) Designing a globally acceptable carbon tax scheme to address competitiveness and leakage concerns. Clim Change Econ 11(2). https://doi.org/10.1142/s2010007820500086
Acknowledgements
We sincerely thank all participants for their support of this article.
Author information
Authors and Affiliations
Contributions
All authors contributed to the research conception and design. Data collection and analysis were conducted by B. The first draft of the manuscript was written by B, and J critically revised the manuscript. All authors read and approved the final manuscript. These authors contributed equally to this work.
Corresponding author
Ethics declarations
Competing interests
The authors declare no competing interests.
Ethical approval
This study did not involve human participants or their data.
Informed consent
This study did not involve human participants or their data.
Additional information
Publisher’s note Springer Nature remains neutral with regard to jurisdictional claims in published maps and institutional affiliations.
Supplementary information
Rights and permissions
Open Access This article is licensed under a Creative Commons Attribution 4.0 International License, which permits use, sharing, adaptation, distribution and reproduction in any medium or format, as long as you give appropriate credit to the original author(s) and the source, provide a link to the Creative Commons licence, and indicate if changes were made. The images or other third party material in this article are included in the article’s Creative Commons licence, unless indicated otherwise in a credit line to the material. If material is not included in the article’s Creative Commons licence and your intended use is not permitted by statutory regulation or exceeds the permitted use, you will need to obtain permission directly from the copyright holder. To view a copy of this licence, visit http://creativecommons.org/licenses/by/4.0/.
About this article

Cite this article
Bao, X., Jin, Y. Insight into border carbon adjustment: a visual bibliometric analysis from 2009 to 2024. Humanit Soc Sci Commun 12, 1114 (2025). https://doi.org/10.1057/s41599-025-05401-x
Received:
Accepted:
Published:
Version of record:
DOI: https://doi.org/10.1057/s41599-025-05401-x
This article is cited by
-
Evolutionary game analysis of various subjects regarding China’s carbon reduction obligation in the framework of “dual-carbon” targets
Environmental Systems Research (2025)
