
Abstract
This study demonstrates that adverse events (AEs) extracted using natural language processing (NLP) from clinical texts reflect the known frequencies of AEs associated with anticancer drugs. Using data from 44,502 cancer patients at a single hospital, we identified cases prescribed anticancer drugs (platinum, PLT; taxane, TAX; pyrimidine, PYA) and compared them to non-treatment (NTx) group using propensity score matching. Over 365 days, AEs (peripheral neuropathy, PN; oral mucositis, OM; taste abnormality, TA; appetite loss, AL) were extracted from clinical text using an NLP tool. The hazard ratios (HRs) for the anticancer drugs were: PN, 1.15–1.95; OM, 3.11–3.85; TA, 3.48-4.71; and AL, 1.98–3.84; the HRs were significantly higher than that of the NTx group. Sensitivity analysis revealed that the HR for TA may have been underestimated; however, the remaining three types of AEs extracted from clinical text by NLP were consistently associated with the three anticancer drugs.
Introduction
Post-marketing surveillance (PMS) is a method used for monitoring the safety of drugs after they are marketed. Long-term PMS is required to identify adverse events (AEs) that were not identified prior to marketing and to continuously monitor drug safety after marketing. However, PMS mainly relies on reports from medical professionals and patients; therefore, post-marketing AEs are considered to be underreported1,2,3,4. In 2008, the Food and Drug Administration launched the Sentinel Initiative in response to the Food and Drug Administration Amendments Act, which established a national electronic system for proactively monitoring drug safety5. The purpose of this project was to build a distributed database network using the electronic medical records (EMRs) and administrative data of each hospital facility as information sources, to rapidly identify AEs through database searches. Similarly, in Japan, the revised Good Post-marketing Study Practice, which was amended in 2018, approved PMS which uses an EMR-based database as an information source. Medical information database network (MID-NET)6, which was developed for this purpose, is a distributed database network that is similar to the Sentinel Initiative and, as of April 2024, its information sources are EMRs and administrative data from 33 hospitals in Japan.
Both Sentinel Initiative and MID-NET define a common data model (CDM) to apply a common analysis program to the databases of different facilities7,8. Although the CDMs are different in both cases, the main information types include patient demographic information (e.g., date of birth, sex, race), prescription information (inpatient, outpatient), diagnostic codes (ICD-9, ICD-10, SNOMED-CT), medical examination information, admission and discharge information, and specimen test results. AE outcomes are mainly defined by a combination of diagnostic codes and specimen test results (such as blood and urine). However, diagnostic codes are primarily intended for insurance claims rather than clinical diagnosis; therefore, AE coverage is low9,10. Additionally, patient signs and symptoms suggesting AEs and the findings of medical practitioners are generally recorded as free text; therefore, the types of AEs that can be expressed by combining these structured data are limited. Nonetheless, EMR text, which includes a wealth of information on AEs, is an important information source for proactive PMS. Consequently, natural language processing (NLP) techniques for mining data from EMRs are becoming increasingly important11,12,13,14,15,16.
Accurate extraction of AEs from EMR text requires identifying symptoms and findings related to AEs, determining whether AEs occurred in the patient, and normalizing the extracted variable expressions. In the NLP field, these processes have been designated as named entity recognition (NER), factuality analysis (FA), and entity normalization (EN) tasks, respectively. The performance of these NLP tasks has considerably improved with the use of Bidirectional Encoder Representations from Transformers (BERT)17, which was released in 2017 and incorporates transformers18. Various BERT models19,20,21 that were pre-trained on medical text have emerged following this success and improved the performance of AE extraction from medical text22,23,24,25,26,27, which is expected to lead to more practical applications. However, utilizing the extracted AEs in PMS requires not only aggregating AEs or finding associations with drugs before and after their mention in the text, but also excluding the effects of the patient’s illness and other prescribed drugs recorded outside the text. Previous studies on the extraction of AEs using NLP have focused on the accuracy of extracting expressions that suggest AEs. However, it remains unclear whether AEs that are extracted by NLP are useful information for PMS.
Therefore, we aimed to utilize longitudinal EMR data and conduct a statistical analysis of AEs extracted from clinical text contained in EMRs using NLP in combination with other structured data to develop a framework for detecting AEs as signals. In this study, we used this framework to retrospectively evaluate the association between three commonly used anticancer drug classes (Platinum compounds, Taxanes, and Pyrimidine analogues) and four AE groups (peripheral neuropathy, PN; oral mucositis, OM; taste abnormality, TA; appetite loss, AL) that are well known to be associated with these anticancer drugs. These AE groups lack established supportive, are clinically important and difficult to determine from blood test results or disease names when assessing their occurrence. Furthermore, clinical texts serve as an important source of information for these AEs. We conducted a total of 12 analyses on patients with cancer to show that AEs that were detected using clinical text reflect the known occurrence frequency of AEs and discuss the usefulness and limitations of clinical text in PMS. Furthermore, to demonstrate specific applicability, we aimed to examine the differential risks of AEs associated with two types of anticancer drugs under two distinct scenarios.
Results
Summary of the collected data
Table 1 shows a breakdown of the collected data. In total, 44,502 unique patients (male: 59.6%, female: 40.4%) were evaluated. The total number of Diagnosis Procedure Combination (DPC) data, and prescription and injection orders were 175,624, 3,911,157, and 11,259,143, respectively, with per patient values of 3.9, 87.9, and 253.0, respectively. The total number of progress records, nursing records, and discharge summaries was 4,856,533, 3,607,590, and 122,231, respectively, with per patient values of 109.1, 81.0, and 2.7, respectively. The median follow-up period for all patients was 1874 days.
Characteristics of patients
Table 2 shows the descriptive statistics for the DPC data (N = 175,624). The majority of patients was aged ≥65 years (104,423 cases, 59.5%) and were men (102,717 cases, 58.5%), with an initial occurrence of cancer (63,118 cases, 63.1%) and a smoking index of <400 (101,942 cases, 80.0%). Regarding activities of daily living (ADL), the majority of patients were independent for meals (140,062 cases, 98.3%), walking (134,999 cases, 94.9%), and defecation (138,836 cases, 97.6%). The most common cancer sites were digestive organs (62,266 cases, 40.8%); ill-defined, secondary, and unspecified sites (16,165 cases, 10.6%); female genital organs (15,854 cases, 10.4%); other sites (<10% of cases). The most common comorbidities were digestive system disease (28,744 cases, 21.5%), followed by circulatory system disease (27,954 cases, 20.9%) and endocrine, nutritional, and metabolic diseases (24,680 cases, 18.4%), and other comorbidities (<10% of cases).
Hazard ratio for adverse events
For propensity score matching (PSM), the average absolute standardized difference (ASD) for the 33 variables in all analyses was 1.7% (maximum 2.1%), indicating good matching results. Additionally, the average area under the curve for multivariable logistic regression was 0.81 (minimum 0.77, maximum 0.86). Table 3 shows a summary of the hazard ratios (HRs) and confidence intervals (CI) for each analysis. Fig. 1 shows the cumulative incidence curves and log-rank test results after PSM. Comparisons between the platinum-based therapy (PLT) and non-treatment (NTx) groups showed significantly high HRs in the following descending order: TA (HR, 4.71 [95% CI: 4.14, 5.35]), OM (HR, 3.85 [95% CI: 3.47, 4.26]), AL (HR, 3.34 [95% CI: 3.11, 3.59]), and PN (HR, 1.63 [95% CI: 1.53, 1.74]). Comparisons between the taxane-based therapy (TAX) and NTx groups showed significantly high HRs in the following descending order: AL (HR, 3.84 [95% CI: 3.50, 4.22]), TA (HR, 3.67 [95% CI: 3.18, 4.24]), OM (HR, 3.11 [95% CI: 2.75, 3.50]), and PN (HR, 1.95 [95% CI: 1.80, 2.10]). Comparisons between the pyrimidine-based therapy (PYA) and NTx groups showed significantly high HRs in the following descending order: OM (HR, 3.70 [95% CI: 3.33, 4.11]), TA (HR, 3.48 [95% CI: 3.05, 3.97]), AL (HR, 1.98 [95% CI: 1.84, 2.13]), and PN (HR, 1.15 [95% CI: 1.07, 1.24]). Supplementary Tables 1–24 show the baseline characteristics and detailed results of the Cox proportional hazard (Cox PH) model analysis for each analysis.
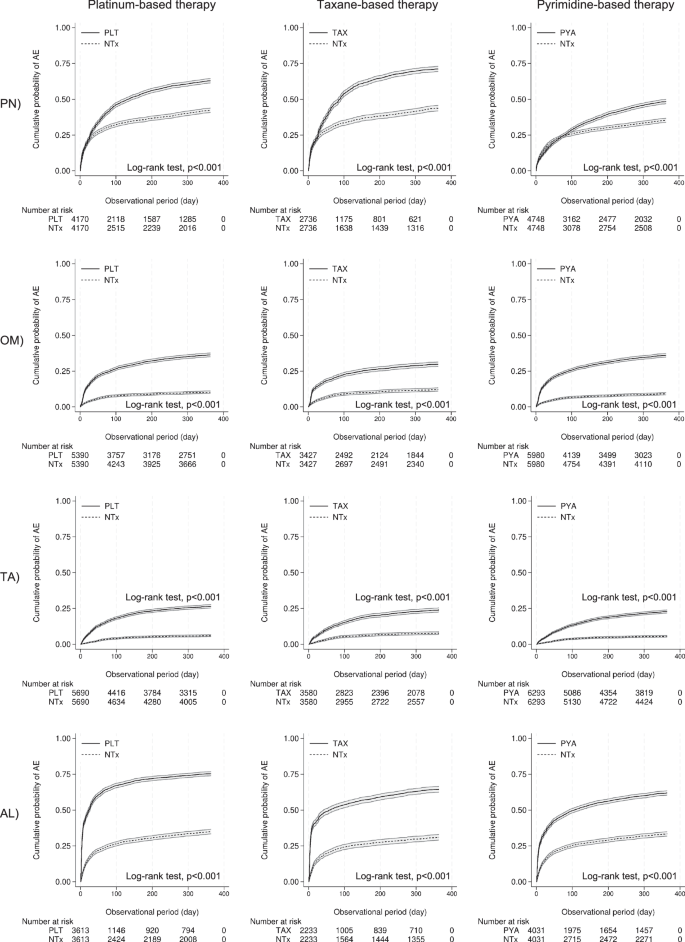
The graphs show the freedom from peripheral neuropathy (PN), oral mucositis (OM), taste abnormality (TA), and appetite loss (AL) for platinum-based therapy (PLT), taxane-based therapy (TAX), and pyrimidine-based therapy (PYA) compared to their respective non-treatment (NTx) groups. Each panel displays the cumulative incidence for a specific adverse event, with the x-axis representing the observational period in days and the y-axis showing the cumulative incidence. The number of patients at risk is provided below each graph at different time points.
The following anticancer drug classes were not included in the Cox PH model analysis because the correlation coefficient with the analyzed anticancer drug > 0.3: TAX and PYA were not included in in the analysis of all AEs in the PLT group, PLT and PYA were not included in the analysis of all AEs in the TAX group, and PLT was not included in the analysis of all AEs in the PYA group.
Comparison of AEs between anticancer drugs
Supplementary Tables 25–26 show the baseline characteristics for each scenario. We excluded the three ADL variables from PSM in both scenarios as almost all cases in both groups had a score of 1 (indicating no need for assistance). In scenario 1, eight variables (Digestive organs, Ill-defined secondary and unspecified sites, Pyrimidine analogues, Taxanes, and Top I, HER2, EGFR, and VEGF/VEGFR inhibitors) had ASDs >10%. In scenario 2, nine variables (Digestive organs, Respiratory and intrathoracic organs, Breast, Female genital organs, Ill-defined secondary and unspecified sites, Nitrogen mustard and Pyrimidine analogues, Anthracyclines and related substances, and Platinum compounds) had ASDs >10%. Consequently, we adjusted these variables using multivariate Cox PH model analysis in the subsequent analysis.
Table 4 summarizes the HRs for two scenarios. Scenario 1: The HR for PN with oxaliplatin compared to cisplatin was 3.28 [95% CI: 2.79, 3.85] (p < 0.001). Scenario 2: The HR for OM with docetaxel compared to paclitaxel was 2.34 [95% CI: 1.91, 2.88] (p < 0.001). Fig. 2 shows the cumulative incidence curves and log-log transformed cumulative incidence curves based on days and number of prescriptions. Significant differences were observed in all comparisons using the log-rank test. Cumulative incidence curves (Fig. 2a, b) and cumulative incidence curves based on the number of prescriptions (Fig. 2c, d) showed similar trends in all comparisons. The hazard of PN for oxaliplatin was higher than that for cisplatin from the initial administration day (e0) to day 12 (e2.5) in the log-log transformed cumulative incidence curves based on days, after which the HR between the two groups remained constant (Fig. 2e). In the comparison between docetaxel and paclitaxel, the HR for OM was initially constant after the first administration; however, the HR for docetaxel increased from day 4 (e1.4) to day 10 (e2.3), after which it became constant again (Fig. 2f). Log-log transformed incidence curves based on the number of prescriptions (Fig. 2g, h) maintained proportional hazards in both comparisons, suggesting that AEs were observed in proportion to the number of anticancer drug prescriptions. Supplementary Tables 27–28 provide a comprehensive overview of the Cox PH model analysis for each scenario.
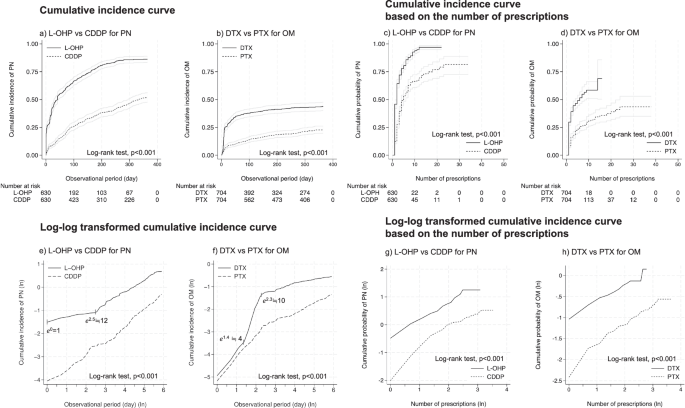
Left top: Cumulative incidence curve based on the days. a Comparison between oxaliplatin and cisplatin for peripheral neuropathy. b Comparison between docetaxel and paclitaxel for oral mucositis. Right top: Cumulative incidence curve based on the number of prescriptions. c Comparison between oxaliplatin and cisplatin for peripheral neuropathy. d Comparison between docetaxel and paclitaxel for oral mucositis. Left bottom: Log-log transformed cumulative incidence curve based on the days. e Comparison between oxaliplatin and cisplatin for peripheral neuropathy. f Comparison between docetaxel and paclitaxel for oral mucositis. Right bottom: g Comparison between oxaliplatin and cisplatin for peripheral neuropathy. h Comparison between docetaxel and paclitaxel for oral mucositis. In the log-log transformed cumulative incidence curve, the horizontal axis represents the natural logarithm of the days or the number of prescriptions, whereas the vertical axis denotes the natural logarithm of the cumulative incidence of the adverse event. For the horizontal axis, e1 approximately corresponds to 2.7 e2 to 7.4, and e3 to 20.1.
Sensitivity analysis
As for the first sensitivity analysis, Table 5 shows the results of the NLP performance evaluation. The Recall values were 0.74, 0.73, 0.46, and 0.62; Precision values were 0.92, 0.94, 0.95, and 0.97; Specificity was 1.00 for all; and F-values were 0.82, 0.82, 0.62, and 0.75 for PN, OM, TA, and AL, respectively. Table 6 presents the results of the NLP error analysis. Regarding false positives (FPs), five types of errors were observed, attributed to NER and FA tasks. “Determining absence as presence” refers to cases where negated AEs were affirmed, with paragraph counts of 12 for PN, 11 for OM, three for TA, and 10 for AL. “Past symptoms” denotes affirmation of AEs as medical history, occurring in three paragraphs for PN, one for OM, 0 for TA, and six for AL. “Future possibilities” indicates affirmation of potential future AEs, found in four paragraphs for PN, two for OM, three for TA, and five for AL. “Upcoming observations” refers to affirmation of future observation plans, occurring in 10 paragraphs for PN, 0 for OM, one for TA, and two for AL. “Determining improvement as presence” denotes affirmation of improved adverse events, found in four paragraphs for PN, three for OM, one for TA, and one for AL. “Normalization errors,” where NER and FA were successful but EN errors led to normalization to different adverse events, were observed in eight paragraphs for PN, four for OM, and 0 for both TA and AL. “Clearly different causes,” where effects were clearly due to surgery or radiotherapy, were found in seven paragraphs for PN, one for OM, and 0 for both TA and AL. “Clearly different symptoms” were extracted in 11 paragraphs for PN, two for OM, and 0 for both TA and AL. Regarding false negatives (FNs), the number of paragraphs where AEs were not extracted due to NER task errors was 124 for PN, 46 for OM, 122 for TA, and 427 for AL. Additionally, the number of paragraphs containing extracted entities that included the relevant adverse event but were not normalized to any adverse event due to reasons such as large entity granularity was 102 for PN, 96 for OM, 63 for TA, and 35 for AL.
Table 7 shows the impact of NLP errors on outcomes. Among 200 cases for each AE, the number of cases unaffected by outcome changes (Type: 1) was 163 (81.5%) for PN, 191 (95.5%) for OM, 176 (88.0%) for AT, and 152 (76.0%) for AL. Cases with shortened event occurrence dates due to FNs (Type: 2A) were 16 (8.0%) for PN, three (1.5%) for OM, 10 (5.0%) for AT, and 27 (13.5%) for AL. Similarly, cases that changed from non-occurrence to occurrence groups due to FNs (Type: 2B) were six (3.0%) for PN, one (0.5%) for OM, 10 (5.0%) for AT, and 19 (9.5%) for AL. Cases with extended event occurrence dates due to FPs (Type: 3A) were eight (4.0%) for PN, three (1.5%) for OM, one (0.5%) for AT, and one (0.5%) for AL. Cases that changed from occurrence to non-occurrence groups due to FPs (Type: 3B) were seven (3.5%) for PN, two (1.0%) for OM, three (1.5%) for AT, and one (0.5%) for AL. The HRs for PN, OM, TA, and AL based on outcomes identified from manually extracted AEs were 1.33 [0.82, 2.15] (p = 0.25), 4.14 [1.75, 8.81] (p < 0.01), 13.54 [3.73, 49.19] (p < 0.001), and 2.91 [1.91, 4.44] (p < 0.001), respectively. The HR for TA presented in the main analysis was found to be underestimated due to NLP FNs. Although PN showed a similar trend to the main analysis, the significance disappeared due to the reduced number of cases. Other AEs showed results equivalent to the main analysis.
As for the second sensitivity analysis, over a total of 12 analyses, the average number of medical examination days in the PLT, TAX, and PYA groups was 64.6 days and 31.6 days in the NTx group, and this difference was significant (p < 0.001). Table 8 shows the HR when AEs were assumed to be observed in AE non-incident cases in the NTx group corresponding to 10–50% of the AE-incident cases in the same NTx group. Even if there was an increase in the number of cases equivalent to 50% of the AE-incident cases, significant differences in HRs were observed except for PN.
As for the third sensitivity analysis, Supplementary Tables 29 and 30 present summaries of HRs for observation periods of 30 and 180 days, respectively. The HRs for PN caused by PLT, TAX, and PYA in the 30-day observation period were 1.18 [95% CI: 1.07, 1.30] (p < 0.05), 1.26 [95% CI: 1.13, 1.41] (p < 0.001), and 0.80 [95% CI: 0.72, 0.89] (p < 0.001), respectively. These values tended to be lower compared to the main analysis results, with PYA showing a significant decrease in HR. Visual inspection of clinical texts revealed that each NTx group included surgical cases, and neurological symptoms within 30 days post-surgery (such as tetany symptoms after thyroidectomy or lower limb neurological symptoms after orthopedic surgery) were extracted as PN, likely resulting in lower HR estimates for each anticancer drug group. The HRs for TA and AL caused by PLT were 6.38 [95% CIL 4.99, 8.16] (p < 0.001) and 4.08 [95% CI: 3.71, 4.50] (p < 0.001), respectively, both showing higher tendencies compared to the main analysis results. Similarly, the HRs for TA and AL caused by TAX were 4.49 [95% CI: 3.40, 5.92] (p < 0.001) and 4.80 [95% CI: 4.23, 5.45] (p < 0.001), respectively, also showing higher tendencies compared to the main analysis results. These results were considered reasonable, as TA and AL are likely to be observed at high frequencies within 30 days after the initial administration of anticancer drugs. Other results were largely equivalent to the main analysis. The HRs for the 180-day observation period were largely equivalent to the main analysis results, with the exception of the HR of PN caused by PYA, which showed no significant difference.
Discussion
The purpose of this study was to show that AEs that were extracted from text reflect known occurrence frequencies of AEs using EMRs. Although several studies have used NLP to extract AEs from medical text22,23,24,25,26,27, to the authors’ knowledge, no studies have evaluated extracted AEs as time-to-event outcomes. We found that AEs were significantly detected in all 12 analyses in this study, suggesting that AEs extracted by NLP may be useful for PMS. Since a combination of multiple anticancer drugs is administered for chemotherapy, estimating the risk of AEs due to a specific anticancer drug requires adjusting for the effects of concomitant anticancer drugs as well as anticancer drugs that cause delayed AEs. However, due to multicollinearity, anticancer drugs that show a certain correlation were not included in the explanatory variables in our analysis. Therefore, the effects of TAX and PYA for PLT, PLT and PYA for TAX, and PLT for PYA were not adjusted. Consequently, the HRs in the present study should be interpreted as signals of AEs rather than as values that quantitatively indicate risk. Ideally, patients should have no history of previous anticancer drug use and be treated with a single drug; however, the number of such cases in routine clinical data is limited, and this influences the detection power of AEs. Given these limitations, we examined whether the obtained AE HRs were consistent with the findings of existing studies.
All anticancer drug classes were associated with a low to moderate risk of PN. PLT (HR: 1.63) is known to cause PN which is strongly associated with oxaliplatin therapy28. In a randomized controlled trial (RCT) investigating patients with advanced gastric cancer, reported PN rates were 59.0% in the S-1 + oxaliplatin (SOX) group, and 34.8% in the S-1 + cisplatin (SP) group29. However, if only oxaliplatin had been evaluated, the values may have been higher. Similarly, TAX (HR: 1.95) is known to cause PN30. A phase 3 RCT of patients with non-small cell lung cancer reported an incidence of 13%–62% for taxane-induced PN, whereas another RCT of patients with advanced gastric cancer reported a paclitaxel-induced PN incidence of 57.4%31,32. Therefore, the results of the present study are consistent with these findings. Conversely, PYA (HR: 1.15) had a low HR and PN associated with this class of drugs was considered to be a rare event33,34. However, as the effect of PLT was not adjusted for, we concluded that this result was not inconsistent with the aforementioned studies.
All anticancer drug classes were associated with a high risk of OM. Anticancer drugs that cause OM include alkylating agents, anthracyclines, antimetabolites (including fluorouracil (5-FU)), taxanes, antineoplastic antibiotics, and vinca alkaloids35. For PLT (HR: 3.85), in an RCT of patients with advanced gastric cancer, the incidence of OM in SOX and SP groups was 17.9% and 29.9%, respectively29. Additionally, a systematic review revealed a 22% incidence of OM resulting from cisplatin-based chemotherapy in patients with head and neck cancer, reaching 89% when radiation was also administered36. Although the present study included head and neck cancer, we did not adjust for the effects of radiation therapy due to limitations of the data used. Therefore, these results may indicate a higher risk than chemotherapy alone. Regarding TAX (HR: 3.11), in an RCT of patients with metastatic breast cancer, the incidence of OM in docetaxel and paclitaxel groups was 51.4% and 16.2%, respectively; furthermore, in an RCT of patients with metastatic soft tissue sarcoma, the incidence of OM in patients undergoing treatment with docetaxel + gemcitabine was 49.0%. Thus, docetaxel is recognized as a more likely cause of OM than paclitaxel37,38. However, the risk does not distinguish between docetaxel and paclitaxel in the present study, and the effects of PYA were not adjusted for; therefore, the risk may be higher than that with TAX alone. Additionally, we found that PYA (HR: 3.70) was associated with a relatively high risk of OM. Previous research found that approximately 40%–66% of patients treated with 5-FU developed OM39. Furthermore, a 4.39 [95% CI: 1.05, 18.37] odds ratio of OM for S-1 vs. non-fluoropyrimidine anticancer drugs has been reported40; the results of the present study are consistent with these results.
All anticancer drug classes were associated with a relatively high risk of TA. A notably high TA prevalence of 69.9% has been reported in patients undergoing chemotherapy41. For PLT (HR: 3.70), patients with cancer on cisplatin-based chemotherapy were reported as having more subjective changes in taste42. However, some studies have reported no significant difference in olfactory and gustatory function between patients undergoing platinum-based and non-platinum-based chemotherapy43. This discrepancy may be explained by the fact that the NTx group, which did not receive any anticancer drugs, was used as the comparison subject, and that PLT analysis did not adjust for TAX and PYA effects, thereby increasing the risk compared to that of PLT alone. However, a systematic review found a TA prevalence ranging from 17%–86% in patients undergoing chemotherapy, including docetaxel, paclitaxel, nab-paclitaxel, capecitabine, or oral 5-FU analogues44, which supports the results of the present study for TAX (HR: 3.67) and PYA (HR: 3.48).
All anticancer drug classes were associated with a low to high risk of AL. For PLT (HR: 3.33) and PYA (HR: 1.98), in an RCT in patients with biliary tract cancer, relatively high AL incidence rates of 40.9% and 39.5% were reported in the gemcitabine+cisplatin (GC) group and gemcitabine+S-1 (GS) group, respectively45. Similarly, the incidence values of 50.9% and 56.1% were reported for AL in the SOX and SP groups, respectively, in an RCT in patients with advanced gastric cancer29. Additionally, for TAX (HR: 3.84), the results of the present study showed a moderate risk of AL, although an RCT in patients with advanced gastric cancer, reported a 46.3% incidence of AL in the paclitaxel group32, which was not inconsistent with the results of the present study.
We investigated the differences in AE profiles of anticancer drugs under two scenarios. In the first scenario, using HRs, we demonstrated that oxaliplatin causes PN at a higher frequency than cisplatin. Furthermore, using log-transformed cumulative incidence curves, we showed that oxaliplatin has a higher hazard for PN immediately after administration (Fig. 2e). This result is consistent with the known characteristics of oxaliplatin-induced acute PN, which typically occurs during or within hours after administration and presents transient, reversible symptoms46. In the second scenario, we demonstrated that docetaxel causes OM at a higher frequency than paclitaxel, as shown by HRs. Our results also revealed a more detailed profile, indicating an increase in the hazard of docetaxel between days 4 and 10 post-administration (Fig. 2f). Although the exact cause is unclear, this pattern may be related to the typical onset of OM, occurring within several days to about 10 days post-administration, and the stronger myelosuppressive effects of docetaxel coinciding with this period, potentially leading to an increased frequency of infection-related OM. The log-transformed cumulative incidence curves based on the number of prescriptions (Fig. 2-g, h) suggested that proportional hazards were maintained for both scenarios, confirming that AEs occur in proportion to the number of prescriptions. The differences in proportional hazards between time-based and prescription count-based analyses may be attributed to the lack of regimen information in this study, which prevented adjustment for intervals between anticancer drug administrations. Therefore, in situations where regimen information is unavailable, comparing hazards based on the number of prescriptions may contribute to a more detailed understanding of toxicity profiles. In conclusion, the outcomes extracted from clinical texts using NLP demonstrated results consistent with temporally changing toxicity profiles in clinical practice. Consequently, this approach could also be applied to comprehensive evaluations of toxicity profiles for a wide range of anticancer drugs.
NLP is an important technology for extracting analyzable structured data from medical text. The BERT built into MedNERN that was used in the present study was pre-trained on Japanese-language Wikipedia, but fine-tuning it with medical text resulted in a high-performance NER in medical text. However, going beyond NLP, the use of a machine learning models is associated with FPs and FNs. For the first sensitivity analysis, we manually evaluated texts from a total of 800 cases in the PLT experiment at the paragraph level. The results showed a high average Precision of 0.95 for the four types of AEs; however, the average Recall of 0.64 was not sufficiently high, with TA in particular showing a relatively low Recall of 0.46. The decrease in Recall was attributed to FNs, caused by either NER errors failing to extract AE expressions or EN errors incorrectly normalizing extracted AEs. Notably, TA and AL showed several cases caused by NER errors, with numerous instances where colloquial expressions in patients’ chief complaints suggesting AEs could not be extracted. This may be partly because the dataset used for fine-tuning MedNERN did not contain sufficient paragraphs with such colloquial patient expressions. Additionally, investigation of the impact of NLP errors on outcome occurrence and time to occurrence revealed that cases affected by FPs (Tables 7–3A, 3B) were limited, whereas cases affected by FNs (Tables 7–2A, 2B) for PN, TA, and AL ranged from 10% (PN) to 23% (AL). Re-estimation of HRs for PN, OM, TA, and AL showed that the HR for TA was 13.54 [3.73, 49.19] (p < 0.001), suggesting that the HR for TA presented in the main analysis was underestimated and likely has a higher actual HR. However, other AEs showed results similar to the main analysis, indicating that the main analysis results for PN, OM, and AL possess a certain robustness. This suggests that NLP errors do not directly influence outcome misidentification, aligning with the view of Zhou et al.47 that the impact of NLP errors on downstream analyses in epidemiological studies using NLP-derived data is limited.
Recent generative language models such as Generative Pre-trained Transformer (GPT) significantly surpass the BERT model used in this study in terms of neural network parameter size and training data scale, potentially demonstrating higher performance in adverse event extraction. However, GPT models have certain limitations in these tasks. GPT models are designed to predict the next token, making them inherently less suitable for token classification tasks like NER. Additionally, GPT models employ unidirectional left-to-right learning, which may limit contextual understanding compared to BERT’s bidirectional encoder structure. In fact, a study has shown that GPT models with prompt engineering underperform fine-tuned BERT models in medical NER tasks48. Furthermore, the EN task requires knowledge of the terminology set for normalization. If this terminology set is not learned by the GPT model, it may result in incorrect normalization or hallucinations. Consequently, GPT models have been reported to be unsuitable for medical terminology EN tasks49. Moreover, the AE dictionary used in this study was custom-made, likely not learned by GPT models, increasing such risks. Despite these limitations, if the dataset used for NER fine-tuning and the AE dictionary used for the EN task in this study could be fine-tuned to GPT models, high performance in NER and EN tasks could be expected due to their superior base model performance. However, security requirements for medical data often preclude the use of cloud-based GPT models, and even when available, fine-tuning GPT models requires enormous computational resources. Therefore, for the specific task of extracting AEs from medical texts, the BERT model adopted in this study is considered a solution that balances computational efficiency and task suitability. In contrast, the use of GPT models with prompts including few-shot examples, which can be expected to perform comparably to fine-tuned BERT, may reduce the need for annotated corpora. In this regard, GPT models hold great potential for clinical NER tasks and are a solution expected to develop further in the future.
With regard to the second sensitivity analysis, this study was a retrospective observational study using EMR, resulting in a significant difference in the average number of days of medical examinations between the PLT, TAX, and PYA treatment groups and the NTx group. This indicates that patients in the PLT, TAX, and PYA groups visited medical institutions more frequently than those in the NTx group, suggesting that more care was required for intensive follow-up. Meanwhile, the risk of AE incidence may have been underestimated in the NTx group due to the relatively reduced number of opportunities for AEs to be observed and recorded in the EMR. Therefore, in this sensitivity analysis, we estimated the HR with the assumption that AEs were observed in a certain number of cases among the AE non-incident cases in the NTx group. Consequently, even when assuming an increase in cases equivalent to 50% of the number of AE-incident cases, significant differences in HR were observed except for PN. Therefore, the results of the present study have a certain degree of robustness in signal detection applications.
With regard to the third sensitivity analysis, when the observation period was set to 30 days, the results tended to be lower compared to the main analysis, with a significant decrease in HR observed for PYA in particular. However, when the observation period was set to 180 days, the HR for PN caused by PYA no longer showed a significant difference. Examination of clinical texts suggested that neurological symptoms within 30 days post-surgery in the NTx group were extracted as PN. One reason for this is that we could not adjust for the effects of surgery or radiotherapy due to limitations in the available data. Consequently, it cannot be definitively stated that the identified AEs were solely attributable to anticancer drug use. Therefore, when interpreting the estimated HRs, it should be noted that the effects of surgery and radiotherapy between the two groups were not adjusted for, which is one of the limitations of this study. Another reason is that the NER and FA tasks of the NLP applied in this study cannot distinguish the causes of identified AEs. Therefore, AEs caused by surgery, radiotherapy, or other diseases were also treated as outcome occurrences. This is because the direct cause of a patient’s symptoms in medical texts may be described in the immediate context, in a distant context, or not at all. Therefore, the development of NLP technology capable of processing long context inputs and extracting events that cause AEs within that context remains a challenge. However, more accurate HRs for anticancer drugs can be estimated by extracting AEs using such NLP technology and further adjusting for the effects of surgery and radiotherapy.
The resources utilized for AE signal detection include spontaneous reporting systems (SRS) from medical facilities and companies, such as the FDA Adverse Event Reporting System. The reporting odds ratio (ROR) was used for signal detection using SRS, which is the odds ratio calculated based on the presence or absence of drug use as well as the presence or absence of specific AE reports and its 95% confidence interval. SRS is used in various types of AE signal detections since it includes reports on a larger scale and a wider range of AEs. However, SRS reports do not imply a causal relationship between drugs and AEs, and interpretation is limited due to biases such as underreporting and a lack of information that can serve as a denominator for the incidence rate50. Additionally, the ROR cannot consider the effects of covariates; the possibility of detection errors due to bias in patient background remains. Meanwhile, methods that utilize distributed EMR-derived databases such as the Sentinel initiative and MID-NET have relatively large and detailed patient background information but require AEs to be defined by a combination of diagnostic codes and specimen test results. Nonetheless, AEs that correspond to symptoms or findings that are not the primary diagnosis in clinical practice may not be registered as ICD-10 codes; therefore, such AEs cannot be analyzed. Moreover, the EMR from a single institution used in the present study has limitations in terms of scale and being single-center data compared to these two methods. However, it includes patient background information and medical text; therefore, the risk of AEs that are not registered as ICD-10 codes can be estimated after adjusting for the patient background. Additionally, treating AEs as time-to-event outcomes allows for cases that stopped medical examinations during the observation period to be included in the HR calculation as censored cases; therefore, the long-term effects of treatment can also be evaluated. Examples of applications of the proposed method include comparing the HR of AEs between groups in which a certain drug is used in combination with another drug (e.g., oxaliplatin + simvastatin group vs. oxaliplatin alone group) to apply the results to drug repositioning for discovering new pharmacological effects of existing drugs51,52, or visualizing the risk of AEs related to anticancer drug treatment using cumulative incidence curves and developing the results into an application that provides information to medical professionals and patients.
Additionally, we utilized long-term EMRs and compared cases treated in different time periods. Considering the significant medical advancements that occurred during this period, one limitation is the inability to adjust for these influences. For instance, improvements in supportive care, such as pregabalin for PN or neurokinin-1 receptor antagonists and olanzapine for appetite loss accompanied by nausea and vomiting, may have reduced the prevalence of AEs. Additionally, advancements in non-pharmacological medical techniques, such as the widespread adoption of oral care for preventing OM and oral infections, may have decreased the prevalence of AEs. Furthermore, updates to EMR systems may have altered the method and detail of AE recording, potentially affecting the accuracy of AE extraction through NLP. We did not adjust for these factors, which could potentially introduce bias in the comparison between the two groups. Therefore, it is essential to exercise caution when interpreting the presented HRs. One approach to elucidate these effects in the future would be to divide the data into multiple periods, calculate HRs for each period, and compare them to evaluate changes in HRs over time. Such biases should be considered as challenges that need to be taken into account when analyzing long-term EMR data.
In conclusion, this retrospective longitudinal observational study using EMR data confirmed that the four types of AEs extracted from clinical text by NLP in our study were significantly associated with three types of anticancer drug classes and showed HRs consistent with the known occurrence frequency. Sensitivity analysis, conducted as an NLP performance evaluation, showed that all four types of AEs had relatively lower Recall compared to Precision; however, the impact on outcomes was limited except for TA. The HR presented in the main analysis for TA was underestimated due to low Recall. We also demonstrated the potential applicability of the proposed method for a detailed evaluation of toxicity profiles of different anticancer drugs. These suggest that AEs extracted from clinical text using NLP can be used for the purpose of signal detection, and that EMR text can also be used in PMS. Nonetheless, further research is warranted to determine whether equivalent results can be obtained using EMRs at other facilities. Additionally, the development of NLP technology capable of extracting events that cause AEs presents a challenge that must be addressed in the future.
Methods
Data collection and all experiments below were approved by the institutional review board at the University of Tokyo and University of Tokyo Hospital (approval number 2022251NI). Informed consent was obtained using an opt-out method, which was approved by the institutional ethics committee due to the retrospective nature of the study. All the experiments were carried out in accordance with the relevant ethical guidelines and regulations.
Study design
This retrospective longitudinal observational study used data from the EMRs of a single institution, the University of Tokyo Hospital.
Database
We used DPC data from patients admitted to the University of Tokyo Hospital over an 18-year period between January 1, 2004, and December 31, 2021. In 2003, Japan introduced a DPC-based payment system in acute care hospitals nationwide53. DPC data includes information entered by medical professionals, such as patient demographics, main diagnosis, comorbidities at the time of admission, complications during hospitalization, and surgery and procedures performed. Diagnosis and disease names are coded according to ICD-10. DPC data has been widely used in clinical epidemiological studies with a reported 50%–80% sensitivity of diagnoses registered in the DPC and specificity exceeding 96%54,55,56,57.
Other data sources used besides the DPC include prescription and injection orders, progress and nursing records, and discharge summaries. Information other than the DPC and discharge summaries was obtained from other sources covering the patient history, such as inpatient and outpatient care. Drug types were analyzed by matching the national standard drug codes contained in prescription orders and injection orders with Anatomical Therapeutic Chemical (ATC) Classification codes. DPC, prescription orders, and injection orders are structured information; however, progress records, nursing records, and discharge summaries are written in free text; therefore, AEs were extracted using the NLP tool described below.
NLP tool
The NLP tool MedNERN58 published by the co-authors was used to extract AEs from progress and nursing records, and discharge summaries. This tool conducts NER using a machine learning model that was fine-tuned on a corpus of approximately 2,000 Japanese medical text with respect to a BERT model59, which was pre-trained on 17 million sentences collected from the Japanese-language Wikipedia. Thereafter, EN was conducted by normalizing the extracted named entities to terms in a built-in dictionary. In the NER step, 12 named entity classes were assigned, including disease names (including symptoms and findings) and time expressions. In particular, disease name classes were assigned four types of attributes (positive, negative, suspicious, general) related to their factuality attributes. Of these factuality attributes, “positive” corresponds to the existence or observation of the named entity, whereas “negative” corresponds to the denial of its existence or observation. “Suspicious” corresponds to suspected diseases such as differential diagnoses, and “general” is used for general knowledge of the disease. Although the publicly available MedNERN contains a dictionary for ICD-10 enumeration, a new normalized dictionary was created and used for AEs in the present study. This dictionary consists of the surface form of an AE and its corresponding normalized form. For example, “tingling (surface form)” corresponds to “hypersensitivity (normalized form)”, and “numbness in both lower limbs (surface form)” corresponds to “peripheral neuropathy (normalized form)”. This normalized dictionary was created by registering frequently occurring named entities of the disease name class extracted from the progress and nursing records, and discharge summaries by NER as surface forms and manually assigned normalized forms to ensure that less frequently occurring named entities are not registered as surface forms in the dictionary. Therefore, as a measure for such named entities, the Levenshtein distance with all surface forms in the dictionary was calculated, and the normalized form that corresponds to the closest surface form was assigned. The part of the normalized dictionary related to the four types of AEs targeted in this study is shown in Tables 9–12. Fig. 3 shows an overview of NER and EN using MedNERN.
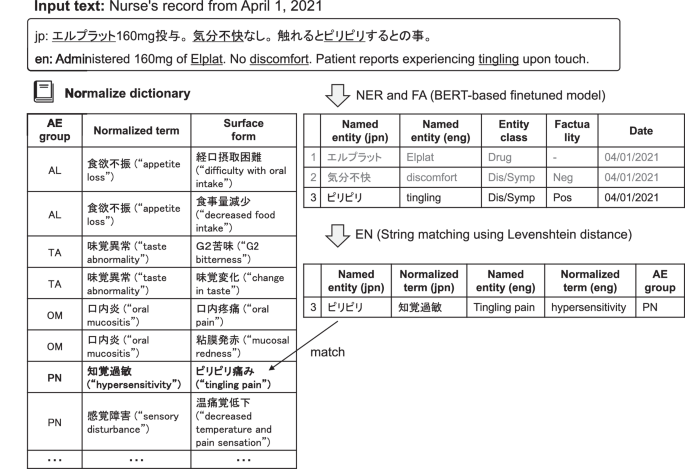
The process begins with NER and FA using a BERT-based fine-tuned model. This step extracts named entities from the input text and classifies the entity type (e.g., drug, symptom) and the factuality type. In this example, “エルプラット” (Elplat) is identified as a drug, “気分不快” (discomfort) as a negative symptom, and “ピリピリ” (tingling) as a positive symptom. Next, the EN step utilizes string matching with the Levenshtein distance to align the named entities with the normalized terms from the dictionary. For instance, “ピリピリ” (tingling) is matched to “知覚過敏” (hypersensitivity) and normalized to “tingling pain,” which falls under the AE group “PN” (peripheral neuropathy). In the figure, “jpn” refers to Japanese, and “eng” refers to English. The character string corresponding to “eng” is for explanatory purposes and does not appear in the actual analysis.
Patients
Participants included in the study were patients aged ≥16– < 100 years with all types of malignant neoplasms (ICD-10:C00-C96) registered as the main diagnosis or comorbidity in the database. All stages of the disease were included in the study, without restrictions based on disease progression or specific classifications. Furthermore, patients were included irrespective of their treatment history, encompassing those who had undergone surgical interventions, radiotherapy, or any other modalities of cancer treatment. A total of four patient groups were identified: patients in three groups were prescribed three classes of anticancer drugs (Platinum compounds, Taxanes, Pyrimidine analogues), whereas patients in one group were not prescribed any anticancer drug during treatment. Table 13 shows the definition of each drug class according to the ATC classification. The exclusion criteria were: 1) patients with only a suspected diagnosis of cancer, 2) patients who died within 24 h of admission, 3) patients for whom no medical text was available, and 4) patients with an outcome occurring within the previous 180 days before the start of observation.
Exposure/comparison
The groups of patients who received therapy containing Platinum compounds, Taxanes, or Pyrimidine analogues were designated as the platinum-based therapy group, taxane-based therapy group, and pyrimidine-based therapy group, respectively, and were referred to as the PLT group, TAX group, and PYA group, respectively. The group with patients who were not prescribed any anticancer drug was designated the NTx group. Comparisons were made between the PLT group and NTx group, TAX group and NTx group, and PYA group and NTx group.
Outcome
The observation start date for the PLT, TAX, and PYA groups was the date of the first prescription of each anticancer drug, and the occurrence of PN, OM, TA, and AL within 365 days was defined as the outcome. Conversely, the observation start date for the NTx group was determined from multiple possible hospitalization dates after the time of the first diagnosis of cancer, and the occurrence of PN, OM, TA, and AL within 365 days was defined as the outcome. The observation start date for the NTx group was the date of hospitalization for DPC matched by PSM60. AEs of PN, OM, TA, and AL were considered to have occurred if the named entities of the disease name class extracted by NER had a positive factual attribute and matched any of the surface forms shown in Tables 9–12. The occurrence date was the document record date. In the analysis of performance, the MedNERN positive disease name class extraction achieved a macro-F value of 59.21% for case reports and 84.88% for radiology reports58.
Covariates
A total of 33 items obtained from DPC were used as covariates for PSM: age, sex, smoking index, initial cancer occurrence, three types of ADL (eating, walking, defecation), 14 types of cancer sites (defined by ICD-10), and 12 types of comorbidities (defined by ICD-10). Binary variables were set with ≥65 years and <65 years for age, ≥400 and <400 for smoking index, and independent and others for ADL. A total of 51 covariates that were aggregated in ATC 5-digit units for anticancer drugs other than those to be analyzed and that were prescribed in the past 180 days from the observation start date (i.e., L01AA Nitrogen mustard analogues) were set for the Cox PH model.
Propensity score matching
The occurrences of PN, OM, TA, and AL were evaluated by comparing the PSM between the PLT and NTx groups, TAX and NTx groups, and the PYA and NTx groups. The propensity score (PS) at which PLT, TAX, and PYA are prescribed was estimated using multivariable logistic regression with the 33 items obtained from the DPC as explanatory variables. One-to-one nearest neighbor matching without replacement was used for the estimated PS, with a caliper width of 0.2 standard deviation60. Patients in the NTx group who were matched once were excluded from the pool. The covariates between the two groups were compared using ASD before and after PSM. When the ASD was > 10%, the imbalance of variables between the two groups was considered negligible61. Of the covariates, recurrence, smoking index, and the three ADL types included missing values of about 19%–43%. Therefore, the multiple imputation by chained equation method was used prior to PSM to conduct multiple imputation 20 times for the missing values62. Fig. 4 shows an example of the arrangement of various data on the time series and an overview of matching.
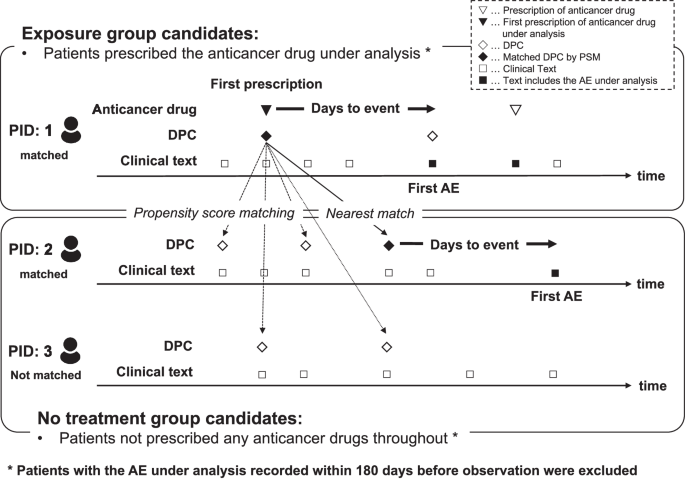
The diagram illustrates the selection of exposure group candidates (patients prescribed the anticancer drug under study) and no-treatment group candidates (patients did not prescribe any anticancer drugs throughout the observation period). Each patient’s timeline includes the initial anticancer drug prescription, data points from the DPC database, and clinical text records. PSM was employed to identify the closest match between exposure and no-treatment groups using the DPC data. Time-to-event analysis measured the days from the first prescription date to the initial AE occurrence. Patients with AEs documented within 180 days prior to the observation start were excluded from the analysis.
Time-to-event analysis
After PSM, the Cox PH model was used to model the time to occurrence of the AE. The possibility that AEs may have been caused by other anticancer drugs prescribed before the start of the observation could not be excluded for the PLT, TAX, and PYA groups. Therefore, in addition to the analyzed anticancer drugs, 51 other anticancer drugs prescribed in the 180 days before the start of observation were included as covariates to adjust for these effects. However, anticancer drugs with a prescription frequency >1% were excluded to stabilize the model. Additionally, multicollinearity was avoided by calculating the Pearson correlation coefficients for the combination of variables between the anticancer drugs analyzed and other anticancer drugs and other anticancer drugs with correlations of ≥0.3 in absolute value were excluded from the analysis. HRs with 95% CI were estimated in order to examine the association between the use of the anticancer drugs analyzed and the outcomes after 12 months. Cumulative incidence curves and the log-rank test were used for event analysis. The significance level was set at p < 0.05. All tests were two-sided. All analyses were conducted using Stata/MP 18.0 version software (StataCorp, College Station, TX, USA). Fig. 5 shows a flowchart from patient selection to time-to-event analysis.
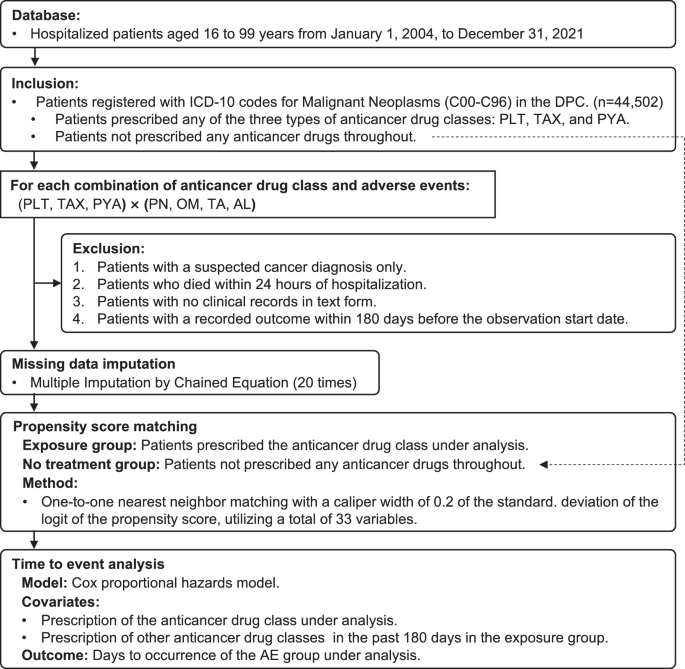
The study included hospitalized patients aged 16 to 99 years from January 1, 2004, to December 31, 2021. Patients registered with ICD-10 codes for Malignant Neoplasms in the DPC were included. The inclusion criteria encompassed patients prescribed any of the three anticancer drug classes and those did not prescribe any anticancer drugs throughout. Exclusion criteria were applied to patients with suspected cancer diagnosis only, those who died within 24 h of hospitalization, patients without clinical records in text form, and those with a recorded outcome within 180 days before the observation start date. Missing data were handled using multiple imputation by chained equation, performed 20 times. Propensity score matching was then conducted, pairing the exposure group with the no treatment group using a one-to-one nearest neighbor matching method. Finally, a time-to-event analysis was performed using a Cox PH model. The model considered the prescription of the anticancer drug class under analysis and the prescription of other anticancer drug classes in the past 180 days as covariates, with the outcome being days to occurrence of the adverse event group under analysis.
Applications to AE comparison between anticancer drugs
We investigated the HRs of AEs for two different anticancer drugs within the same class under two scenarios to demonstrate more specific applications: 1) We evaluated the risk difference for PN between oxaliplatin and cisplatin, as oxaliplatin is known to have a higher incidence of PN63. Specifically, we constructed a logistic regression model to calculate PS for patients who received either cisplatin or oxaliplatin, using cisplatin administration as the classification variable. After identifying two groups of patients through PSM, we estimated the HR for PN occurrence within 360 days of the initial administration of either cisplatin or oxaliplatin. 2) Similarly, we assessed the risk difference for OM between docetaxel and paclitaxel, as docetaxel is associated with a higher frequency of OM64. In both scenarios, we identified and compared the two groups of patients with similar backgrounds using PSM. Unlike the primary analysis, we calculated PS scores using a logistic regression model that included not only the 33 covariates obtained from the DPC database but also the history of up to 51 classes of anticancer drugs, as both groups had a history of anticancer drug use. Additionally, we used ASD as an indicator of covariate adjustment by PSM. For covariates with an ASD exceeding 10%, we adjusted the HR estimation using a multivariate Cox PH model after PSM. All other analytical settings remained consistent with the primary analysis. Furthermore, we examined cumulative incidence curves based on the number of prescriptions for anticancer drugs and visually inspected log-transformed cumulative incidence curves to confirm the proportional hazards assumption. We used the number of prescriptions rather than the dosage of anticancer drugs because the prescription data used in this study did not contain information on the actual doses administered to patients.
Sensitivity analysis
First, we evaluated the performance of NLP in extracting AEs and examined the impact of NLP errors on outcomes. NLP performance was assessed by randomly selecting 100 matched pairs (800 cases in total) from each comparison of the four AEs (PN, OM, TA, and AL) in the PLT and NTx groups after PSM. We manually annotated the clinical texts spanning the entire course of each case at the paragraph level, using line breaks as paragraph boundaries, to determine the presence of the relevant AE. For patients with completely duplicate paragraphs, only the first recorded paragraph was considered. Paragraphs without any expression of AEs were labeled as Negative. Furthermore, we classified paragraphs as Positive if they contained expressions suggesting the occurrence of the AE, excluding cases where the influence of anticancer drugs was clearly negated (e.g., when the impact of other treatments or diseases was evident). A pharmacist specializing in cancer pharmacotherapy (MT) performed the annotation, which was then reviewed by a physician with experience in cancer pharmacotherapy (YK). NLP predictions were also made at the paragraph level, and the results were evaluated using binary classification metrics: Recall, Precision, and F-Value. Regarding the impact on outcomes, we identified the occurrence dates of AEs based on manual extraction as the gold standard. We then examined the influence of NLP errors on both the presence of outcomes and the time to occurrence.
Second, since the NTx group was not treated with anticancer drugs, these patients underwent fewer medical examinations during the observation period than those in the PLT, TAX, and PYA groups; thus, the risk of AE occurrence may be estimated as low. Therefore, the number of cases, M, corresponding to N% of the cases in the NTx group in which the AE occurred was calculated, and a simulation was conducted to calculate the HR again using the Cox PH model, assuming that the AE occurred in M cases randomly selected from those in the NTx group in which the AE did not occur65. The number of days until the event occurred in cases in which the AE was assumed to have occurred was estimated using a parametric Cox PH model in which the time to the event follows the Weibull distribution. The N value was increased by 10% up to 50%, and the average HR and 95% CI of the results of 10 simulations for each value of N are shown. Finally, we evaluated and examined the HRs for each comparative experiment with observation periods of 30 and 180 days. All other settings remained consistent with the primary analysis, with the exception of the observation period.
Data availability
The datasets analyzed during the current study are not publicly available due to the restriction imposed by the research ethics committee of the Graduate School of Medicine and Faculty of Medicine, The University of Tokyo, because they contain sensitive patient information. Disclosure of data is neither included in the ethics application nor allowed in this study, as per the policy of The University of Tokyo Hospital. For the other specific information, please contact the corresponding author.
Code availability
The underlying NLP tool, MedNERN, and the Dictionary of Adverse Events for MedNERN used in this study can be accessed via the following links: https://huggingface.co/sociocom/MedNERN-CR-JA. https://github.com/sociocom/MedDic-ADE.
References
Gough, S. Post-marketing surveillance: a UK/European perspective. Curr. Med. Res. Opin. 21, 565–570 (2005).
Hazell, L. & Shakir, S. A. Under-reporting of adverse drug reactions: a systematic review. Drug Saf. 29, 385–396 (2006).
Alomar, M., Tawfiq, A. M., Hassan, N. & Palaian, S. Post marketing surveillance of suspected adverse drug reactions through spontaneous reporting: current status, challenges and the future. Ther. Adv. Drug Saf. 11, 2042098620938595 (2020).
Costa, C. et al. Factors associated with underreporting of adverse drug reactions by patients: a systematic review. Int. J. Clin. Pharm. 45, 1349–1358 (2023).
Platt, R. et al. The new Sentinel Network-improving the evidence of medical-product safety. N. Engl. J. Med. 361, 645–647 (2009).
Yamaguchi, M. et al. Establishment of the MID-NET® medical information database network as a reliable and valuable database for drug safety assessments in Japan. Pharmacoepidemiol. Drug Saf. 28, 1395–1404 (2019).
Sentinel Common Data Model. https://www.sentinelinitiative.org/methods-data-tools/sentinel-common-data-model (2024).
Current status and practices of quality management for MID-NET. https://www.pmda.go.jp/files/000244339.pdf (2019).
Nadkarni, P. M. Drug safety surveillance using de-identified EMR and claims data: issues and challenges. J. Am. Med. Inform. Assoc. 17, 671–674 (2010).
Classen, D. C. et al. Global trigger tool’ shows that adverse events in hospitals may be ten times greater than previously measured. Health Aff. 30, 581–589 (2011).
Luo, Y. et al. Natural Language Processing for EHR-Based Pharmacovigilance: a structured review. Drug Saf. 40, 1075–1089 (2017).
Li, Y. et al. Artificial intelligence-powered pharmacovigilance: a review of machine and deep learning in clinical text-based adverse drug event detection for benchmark datasets. J. Biomed. Inform. 152, 104621 (2024).
Khurshid, S. et al. Cohort design and natural language processing to reduce bias in electronic health records research. NPJ Digit. Med. 5, 47 (2022).
Sheu, Y. et al. AI-assisted prediction of differential response to antidepressant classes using electronic health records. NPJ Digit. Med. 6, 73 (2023).
Lee, H. J. et al. StrokeClassifier: ischemic stroke etiology classification by ensemble consensus modeling using electronic health records. NPJ Digit. Med. 7, 130 (2024).
Guevara, M. et al. Large language models to identify social determinants of health in electronic health records. NPJ Digit. Med. 7, 6 (2024).
Devlin, J., Chang, M.-W., Lee, K. & Toutanova, K. BERT: Pre-training of deep bidirectional transformers for language understanding. In Proc. 2019 Conference of the North American Chapter of the Association for Computational Linguistics: Human Language Technologies, Volume 1 (Long and Short Papers), 4171–4186. (Association for Computational Linguistics, 2019).
Vaswani, A. et al. Attention is all you need. Adv. Neural Inf. Process. Syst. 30, 5998–6008 (2017).
Lee, J. et al. BioBERT: a pre-trained biomedical language representation model for biomedical text mining. Bioinformatics 36, 1234–1240 (2020).
Kawazoe, Y., Shibata, D., Shinohara, E., Aramaki, E. & Ohe, K. A clinical specific BERT developed using a huge Japanese clinical text corpus. PLoS One 16, e0259763 (2021).
Kim, Y. et al. A pre-trained BERT for Korean medical natural language processing. Sci. Rep. 12, 13847 (2022).
Zhou, S., Kang, H., Yao, B. & Gong, Y. An automated pipeline for analyzing medication event reports in clinical settings. BMC Med. Inform. Decis. Mak. 18, 113 (2018).
El-allaly, E., Sarrouti, M., En-Nahnahi, N. & Ouatik El Alaoui, S. MTTLADE: a multi-task transfer learning-based method for adverse drug events extraction. Inf. Process Manag. 58, 102473 (2021).
Mahendran, D. & McInnes, B. T. Extracting adverse drug events from clinical notes. AMIA Jt Summits Transl. Sci. Proc. 2021, 420–429 (2021).
Wu, H. et al. Chinese-named entity recognition from adverse drug event records: radical embedding-combined dynamic embedding-based BERT in a Bidirectional Long Short-term Conditional Random Field (Bi-LSTM-CRF) model. JMIR Med. Inform. 9, e26407 (2021).
Narayanan, S. et al. A contextual multi-task neural approach to medication and adverse events identification from clinical text. J. Biomed. Inform. 125, 103960 (2022).
Kim, S. et al. Automatic extraction of comprehensive drug safety information from adverse drug event narratives in the Korea adverse event reporting system using natural language processing techniques. Drug. Saf. 46, 781–795 (2023).
Oun, R., Moussa, Y. E. & Wheate, N. J. The side effects of platinum-based chemotherapy drugs: a review for chemists. Dalton Trans. 47, 6645–6653 (2018).
Lee, K. W. et al. SOPP study investigators. Multicenter phase III trial of S-1 and cisplatin versus S-1 and oxaliplatin combination chemotherapy for first-line treatment of advanced gastric cancer (SOPP trial). Gastric Cancer 24, 156–167 (2021).
Burgess, J. et al. Chemotherapy-induced peripheral neuropathy: epidemiology, pathomechanisms and treatment. Oncol. Ther. 9, 385–450 (2021).
Bridges, C. M. & Smith, E. M. What about Alice? Peripheral neuropathy from taxane-containing treatment for advanced nonsmall cell lung cancer. Support Care Cancer 22, 2581–2592 (2014).
Hironaka, S. et al. Randomized, open-label, phase III study comparing irinotecan with paclitaxel in patients with advanced gastric cancer without severe peritoneal metastasis after failure of prior combination chemotherapy using fluoropyrimidine plus platinum: WJOG 4007 trial. J. Clin. Oncol. 31, 4438–4444 (2013).
Stein, M. E. et al. A rare event of 5-fluorouracil-associated peripheral neuropathy: a report of two patients. Am. J. Clin. Oncol. 21, 248–249 (1988).
Saif, M. W. et al. Peripheral neuropathy associated with weekly oral 5-fluorouracil, leucovorin and eniluracil. Anticancer Drugs 12, 525–531 (2001).
Naidu, M. U. et al. Chemotherapy-induced and/or radiation therapy-induced oral mucositis-complicating the treatment of cancer. Neoplasia 6, 423–431 (2004).
Trotti, A. et al. Mucositis incidence, severity and associated outcomes in patients with head and neck cancer receiving radiotherapy with or without chemotherapy: a systematic literature review. Radiother. Oncol. 66, 253–262 (2003).
Jones, S. E. et al. Randomized phase III study of docetaxel compared with paclitaxel in metastatic breast cancer. J. Clin. Oncol. 23, 5542–5551 (2005).
Seddon, B. et al. Gemcitabine and docetaxel versus doxorubicin as first-line treatment in previously untreated advanced unresectable or metastatic soft-tissue sarcomas (GeDDiS): a randomized controlled phase 3 trial. Lancet Oncol. 18, 1397–1410 (2017).
Popescu, R. A., Norman, A., Ross, P. J., Parikh, B. & Cunningham, D. Adjuvant or palliative chemotherapy for colorectal cancer in patients 70 years or older. J. Clin. Oncol. 17, 2412–2418 (1999).
Abdel-Rahman, O., ElHalawani, H. & Essam-Eldin, S. S-1-based regimens and the risk of oral and gastrointestinal mucosal injury: a meta-analysis with comparison to other fluoropyrimidines. Expert Opin. Drug Saf. 15, 5–20 (2016).
Zabernigg, A. et al. Taste alterations in cancer patients receiving chemotherapy: a neglected side effect? Oncologist 15, 913–920 (2010).
Wickham, R. S. et al. Taste changes experienced by patients receiving chemotherapy. Oncol. Nurs. Forum 26, 697–706 (1999).
Steinbach, S. et al. Qualitative and quantitative assessment of taste and smell changes in patients undergoing chemotherapy for breast cancer or gynecologic malignancies. J. Clin. Oncol. 27, 1899–1905 (2009).
Buttiron Webber, T., Briata, I. M., DeCensi, A., Cevasco, I. & Paleari, L. Taste and Smell Disorders in Cancer Treatment: Results from an Integrative Rapid Systematic Review. Int. J. Mol. Sci. 24, 2538 (2023).
Morizane, C. et al. Members of the Hepatobiliary and Pancreatic Oncology Group of the Japan Clinical Oncology Group (JCOG-HBPOG). Combination gemcitabine plus S-1 versus gemcitabine plus cisplatin for advanced/recurrent biliary tract cancer: the FUGA-BT (JCOG1113) randomized phase III clinical trial. Ann. Oncol. 30, 1950–1958 (2019).
Argyriou, A. A., Polychronopoulos, P., Iconomou, G., Chroni, E. & Kalofonos, H. P. A review on oxaliplatin-induced peripheral nerve damage. Cancer Treat. Rev. 34, 368–377 (2008).
Lan, Z. & Turchin, A. Impact of possible errors in natural language processing-derived data on downstream epidemiologic analysis. JAMIA Open 6, ooad111 (2023).
Hu, Y. et al. Improving large language models for clinical named entity recognition via prompt engineering. J. Am. Med. Inform. Assoc. 31, 1812–1820 (2024).
Soroush, A. et al. Large Language Models Are Poor Medical Coders—Benchmarking of Medical Code Querying. NEJM AI. 1, AIdbp2300040 (2024).
Fusaroli, M. et al. The REporting of A Disproportionality Analysis for DrUg Safety Signal Detection Using Individual Case Safety Reports in PharmacoVigilance (READUS-PV): explanation and elaboration. Drug Saf. 47, 585–599 (2024).
Zamami, Y. et al. Identification of prophylactic drugs for oxaliplatin-induced peripheral neuropathy using big data. Biomed. Pharmacother. 148, 112744 (2022).
Imai, S. et al. Using Japanese big data to investigate novel factors and their high-risk combinations that affect vancomycin-induced nephrotoxicity. Br. J. Clin. Pharmacol. 88, 3241–3255 (2022).
Yasunaga, H., Ide, H., Imamura, T. & Ohe, K. Impact of the Japanese Diagnosis Procedure Combination-based Payment System on cardiovascular medicine-related costs. Int. Heart J. 46, 855–866 (2005).
Yamana, H. et al. Validity of diagnoses, procedures, and laboratory data in Japanese administrative data. J. Epidemiol. 27, 476–482 (2017).
Ishikawa, H., Yasunaga, H., Matsui, H., Fushimi, K. & Kawakami, N. Differences in cancer stage, treatment and in-hospital mortality between patients with and without schizophrenia: retrospective matched-pair cohort study. Br. J. Psychiatry 208, 239–244 (2016).
Sasabuchi, Y. et al. The volume-outcome relationship in critically Ill patients in relation to the ICU-to-hospital bed ratio. Crit. Care Med. 43, 1239–1245 (2015).
Yamana, H., Matsui, H., Sasabuchi, Y., Fushimi, K. & Yasunaga, H. Categorized diagnoses and procedure records in an administrative database improved mortality prediction. J. Clin. Epidemiol. 68, 1028–1035 (2015).
Yada, S., Nakamura, Y., Wakamiya, S. & Aramaki, E. Cross-lingual natural language processing on limited annotated case/radiology reports in English and Japanese: Insights from the Real-MedNLP workshop. Methods Inf. Med. (2024). https://doi.org/10.1055/a-2405-2489
tohoku-nlp/bert-base-japanese-whole-word-masking. https://huggingface.co/tohoku-nlp/bert-base-japanese-whole-word-masking (2020).
Rosenbaum, P. R. & Rubin, D. B. Constructing a control group using multivariate matched sampling methods that incorporate the propensity score. Am. Stat. 39, 33–38 (1985).
Austin, P. C. Balance diagnostics for comparing the distribution of baseline covariates between treatment groups in propensity-score matched samples. Stat. Med. 28, 3083–3107 (2009).
Azur, M. J. et al. Multiple imputation by chained equations: what is it and how does it work? Int. J. Methods Psychiatr. Res. 20, 40–49 (2011).
Yamada, Y. et al. Phase III study comparing oxaliplatin plus S-1 with cisplatin plus S-1 in chemotherapy-naïve patients with advanced gastric cancer. Ann. Oncol. 26, 141–148 (2015).
Lai, J. I., Chao, T. C., Liu, C. Y., Huang, C. C. & Tseng, L. M. A systemic review of taxanes and their side effects in metastatic breast cancer. Front. Oncol. 12, 940239 (2022).
Bender, R., Augustin, T. & Blettner, M. Generating survival times to simulate Cox proportional hazards models. Stat. Med. 24, 1713–1723 (2015).
Acknowledgements
This study was funded by JST CREST [grant number JPMJCR22N1], JSPS KAKENHI [grant number 23H03492], and partially funded by the Progress of the Next Cross-ministerial Strategic Innovation Promotion Program (SIP) on “Integrated Health Care System” [grant number JPJ012425]. The funder played no role in study design, data collection, analysis and interpretation of data, or the writing of this manuscript.
Author information
Authors and Affiliations
Contributions
Y.K.: Conceptualization, Methodology, Resources, Writing—original draft, Writing—review and editing, Funding acquisition. K.S.: Software, Methodology, Data Curation, Writing—original draft. T.S.: Methodology, Formal analysis. M.T.: Investigation, Writing—review and editing. E.S.: Software. S.Y.: Software. S.W.: Software. S.I.: Investigation, Writing—review and editing. SH: Conceptualization, Funding acquisition, Supervision. EA Software, Funding acquisition, Supervision. All authors read and approved the final manuscript.
Corresponding author
Ethics declarations
Competing interests
Y.K., K.S., and E.S. belong to the Artificial Intelligence and Digital Twin in Healthcare, Graduate School of Medicine, University of Tokyo, which is an endowment department, and was supported by an unrestricted grant from EM Systems, EPNextS, MRP CO., LTD., SHIP HEALTHCARE HOLDINGS, INC., SoftBank Corp., and NEC Corporation; these organizations had no control over the interpretation, writing, or publication of this work. The other authors declare no financial or non-financial competing interests.
Additional information
Publisher’s note Springer Nature remains neutral with regard to jurisdictional claims in published maps and institutional affiliations.
Supplementary information
Rights and permissions
Open Access This article is licensed under a Creative Commons Attribution-NonCommercial-NoDerivatives 4.0 International License, which permits any non-commercial use, sharing, distribution and reproduction in any medium or format, as long as you give appropriate credit to the original author(s) and the source, provide a link to the Creative Commons licence, and indicate if you modified the licensed material. You do not have permission under this licence to share adapted material derived from this article or parts of it. The images or other third party material in this article are included in the article’s Creative Commons licence, unless indicated otherwise in a credit line to the material. If material is not included in the article’s Creative Commons licence and your intended use is not permitted by statutory regulation or exceeds the permitted use, you will need to obtain permission directly from the copyright holder. To view a copy of this licence, visit http://creativecommons.org/licenses/by-nc-nd/4.0/.
About this article

Cite this article
Kawazoe, Y., Shimamoto, K., Seki, T. et al. Post-marketing surveillance of anticancer drugs using natural language processing of electronic medical records. npj Digit. Med. 7, 315 (2024). https://doi.org/10.1038/s41746-024-01323-1
Received:
Accepted:
Published:
Version of record:
DOI: https://doi.org/10.1038/s41746-024-01323-1
