
Abstract
Cisplatin and oxaliplatin cause the secretion of high mobility group box 1 (HMGB1) protein from cancer cells, which is necessary for initiation of immunogenic cell death (ICD). Calreticulin (CRT) translocation from the endoplasmic reticulum to the plasma membrane is also required; oxaliplatin induces this translocation but cisplatin does not. We have discovered that oxaliplatin causes the secretion of both HMGB1 and HMGB2 from the cell nucleus into the extracellular milieu. We previously showed that cisplatin-mediated secretion of HMGB1 is controlled by the nuclear exporter XPO1 (chromosomal maintenance 1; CRM1). We now find that XPO1 regulates oxaliplatin-mediated secretion of both HMGB1 and HMGB2. XPO1 inhibition causes nuclear accumulation of both proteins, inhibition of oxaliplatin-mediated ferroptosis of colon cancer cells, and inhibition of CRT translocation to the plasma membrane of lung and colon cancer cells. Incubation of cancer cells with cell targeted (CT)-HMGB2 confirmed that HMGB2 is required for the CRT translocation. Furthermore, CT-HMGB2 is three orders of magnitude more potent at inducing CRT translocation than oxaliplatin.

Introduction
The first-generation platinum drug, cisplatin, and the second-generation platinum drug, oxaliplatin1 both induce the secretion of similar amounts of high mobility group box 1 (HMGB1) protein from cancer cells (Supplementary Fig. 1)2,3. In contrast, another second-generation platinum drug, carboplatin (Supplementary Fig. 1)1 does not3. Secretion of HMGB1 is necessary for the induction of immunogenic cell death (ICD)4. The concept of ICD was first introduced by Casares et al. in 2005 as a term to explain how tumor cells dying after treatment with anthracyclines can elicit an effective immune response, which suppresses tumor growth5. Oxaliplatin but not cisplatin induces ICD even though cisplatin induces similar amounts of HMGB1 secretion2,3, implying that there is an additional unidentified mechanism responsible for ICD2. Both HMGB1 (also known as amphoterin) and HMGB2 are abundant non-histone nuclear proteins. HMGB1 is 93% homologous and 80% identical to HMGB2 (Fig. 1)6. However, HMGB1 has been studied much more extensively than HMGB2 with 17-fold more publications; consequently, its biological functions are better delineated including its role as a danger-associated molecular pattern (DAMP)7. Both HMGB1 and HMGB2 contain three conserved regions that are structurally related7. The A box at the amino terminus is a DNA-binding region, which binds to AT-rich sequences of DNA; whereas the B box binds to selected DNA sequences and bends them to alter their structures (Fig. 1)7,8,9. A third region comprises a long acidic tail, which in HMGB1 includes 20 glutamate and 10 aspartate residues (Fig. 1). The acidic tail of HMGB2 is a little shorter with 18 glutamate and only 5 aspartate residues as well as a single non-polar proline residue (Fig. 1).

Alignment of amino acid sequences of HMGB1 (215 amino acids) and HMGB2 (209 amino acids). HMGB1 has a longer acidic tail and a different NLS2 when compared with HMGB2. The TLR4 binding regions (89-108) are identical and NLS1 regions differ only in A-34 and S-39 being transposed; whereas the RAGE binding regions (150–183) are only 79% identical.
It has been reported that HMGB1 is secreted into the circulation in numerous diseases including neurodegeneration10, Alzheimer's disease11, lung disease12, and a wide range of cancers including gastric cancer13, colorectal cancer14, hepatocellular carcinoma13, pancreatic cancer13,15, nasopharyngeal carcinoma13, head and neck squamous-cell carcinoma13,16, esophageal cancer13, malignant pleural mesothelioma13, bladder cancer13, prostate cancer13,17, ovarian cancer18, lung cancer19, and cervical carcinoma13. Therefore, HMGB1 protein is thought to play a significant role in cancer progression. HMGB1 mRNA overexpression was found in approximately 85% of gastric cancers20, and upregulation of HMGB1 mRNA was observed in the invasion and metastasis associated with gastric cancer21. It has been suggested that this could result from the HMGB1-mediated upregulation of melanoma-derived growth regulatory protein (MIA) or through activation of RAGE22 by HMGB1 protein secretion13. Activation of RAGE by secreted HMGB114 is also thought to be important for colorectal carcinogenesis because knockdown of RAGE expression inhibits colorectal cancer cell invasion23. In contrast, it has been suggested that targeting HMGB1 could suppress hepatocellular carcinoma progression via homeodomain interacting protein kinase 2 (HIPK2)-mediated autophagic degradation of zinc finger E-box binding homeobox 1 (ZEB1). HMGB1 has been targeted in pancreatic cancer because of the potential role of secreted HMGB113 in activating RAGE in the pancreatic tumor microenvironment15.
The highest incidence rate of head and neck squamous-cell carcinomas (HNSCCs) involves the oral cavity with oral squamous-cell carcinoma (OSCC) representing the majority of HNSCC cases. HMGB1 can initiate pro-survival autophagy through binding to Beclin-1, a key regulator of autophagy and so inhibit apoptosis in OSCC16. HMGB1 expression was significantly increased in prostate cancer serum compared with controls13,17 and in prostate cancer tissue specimens24. It was found to reactivate the androgen signaling pathway, directly interact with the androgen receptor, and promote the development of prostate cancer in an androgen‑independent manner24. Abnormal mRNA and protein levels of HMGB1 have been detected in ovarian cancer17. Consequently, HMGB1 is considered to be a biomarker for ovarian cancer18 and increased levels of HMGB1 correlate with poor prognosis in ovarian cancer cells17. Several studies demonstrated that the expression levels of HMGB1 in non-small cell lung cancer (NSCLC) were statistically higher in both tissues and serum when compared with healthy controls and correlated with tumor, node metastases (TNM) stages. This suggested that HMGB1 may be a useful clinical marker for evaluating NSCLC progression and of potential prognostic value19. In addition, HMGB1 can translocate from the nucleus to the cytoplasm in NSCLC and act as a positive regulator of autophagy to inhibit apoptosis and increase drug resistance25.
Few studies have examined the secretion of HMGB226, although it was recently discovered that nuclear HMGB2 makes an important contribution to the differentiation and survival of functional memory cells and stem-like progenitor-exhausted T cells27. Previous studies have shown that HMGB2 is also involved in the differentiation of stem cells during spermatogenesis28, neural stem cell development29, and myogenesis30. HMGB2 can be mistaken for secreted HMGB1 when using enzyme-linked immunosorbent assays (ELISAs) or western blot analysis because many antibodies cannot distinguish the two proteins31. Consequently, we explored the possibility that HMGB2 (in addition to HMGB1) could be secreted by cancer cells in response to oxaliplatin, which might help explain the difference in its ability to induce ICD when compared with cisplatin. Previously, we definitively showed that cisplatin does not induce the secretion of HMGB2 from cancer cells3. This was accomplished using a highly specific and sensitive method based on immunoprecipitation (IP) stable isotope dilution nano-liquid chromatography-parallel reaction monitoring/high-resolution mass spectrometry (nano-LC-PRM/HRMS). The LC-PRM/HRMS method was also used to show that oxidized HMGB1 proteoforms (oxidized cysteine residues) are the major molecular species of HMGB1 that are secreted from hepatocytes after exposure to high concentrations of acetaminophen32. In addition, we used our LC-PRM/HRMS method to show that leptomycin B and selinexor, which are inhibitors of the nuclear export receptor, exportin 1 (XPO1) also known as chromosomal maintenance 1 (CRM1), can inhibit the cisplatin-mediated secretion of HMGB1 from A549 NSLC cells3. Selinexor (KPT330; (Z)-3-[3-[3,5-bis(trifluoromethyl)phenyl]-1,2,4-triazol-1-yl]-N′-pyrazin-2-ylprop-2-enehydrazide) is a highly selective and potent chalcone inhibitor of XPO1, which covalently modifies the reactive cysteine-528 residue in the Nuclear Export Signal binding groove through a Michael addition reaction. A 50% inhibitory concentration (IC50) of 50 nM for XPO1 was obtained for selinexor using a cell line assay based on the sub-cellular localization of an XPO1-dependent GFP reporter cargo protein33. Selinexor inhibits the transport of mRNAs and cargo proteins, including tumor suppressor proteins, glucocorticoid receptors, immune response regulators, and oncogenic mRNAs, from the nucleus to the cytoplasm34. This biological activity has simulated studies on the use of XPO1 inhibition to prevent cancer cell proliferation where the effects of selinexor were recapitulated using an siRNA against XPO135,36,37. Consequently, numerous clinical studies have been conducted to test the efficacy of XPO1 inhibition by selinexor for treating both hematologic and non-hematologic malignancies, including sarcoma, gastric, bladder, prostate, breast, ovarian, skin, lung, and brain cancers34,38,39,40.
A modification of the original nano-LC-PRM/HRMS method for HMGB16 was applied to the analysis of HMGB proteoforms that are secreted from human NSCLC and colon cancer cells in response to oxaliplatin. In addition, western blot analysis using highly specific anti-HMGB1 and anti-HMGB2 antibodies was used for their analysis. We also conducted mechanistic studies to determine whether oxaliplatin-mediated HMGB proteoform secretion from human NSCLC and colon cancer cells is mediated by XPO1 and how this relates to ICD.
Results
A549 NSCLC cells secrete both HMGB1 and HMGB2 in response to oxaliplatin
We have determined that oxaliplatin (Supplementary Fig. 1) can secrete both HMGB1 and HMGB2. Importantly, the rabbit polyclonal antibody (pAb) used to detect HMGB1, which was raised against the C-terminal acidic tail of HMGB1, was able to distinguish HMGB1 from HMGB2 by western blot analysis (Fig. 2a; lanes 1 and 2). In addition, the rabbit pAb used to detect HMGB2, which was raised against an N-terminal HMGB2 peptide of unspecified sequence, was able to distinguish HMGB2 from HMGB1 by western blot analysis (Fig. 2b; lanes 1 and 2). Anti-HMGB immunoblots of cell culture media revealed that both HMGB1 (Fig. 2a) and HMGB2 (Fig. 2b) were secreted by A549 NSCLC cells incubated with oxaliplatin in a dose-dependent manner. Secreted HMGB1 appeared at a mobility that was close to a His-tagged authentic standard of HMGB1 (calculated MW = 25,717 Da; Fig. 2a; lane 1). HMGB2 ran slightly faster, appearing at a mobility that was close to a His-tagged authentic standard of HMGB2 (calculated MW = 24,857; Fig. 2b; lane 2). Control experiments with PBS and 0.5% dimethyl sulfoxide (DMSO) showed that there was very little secretion of either of the two HMGB proteins (Fig. 2a, b, lanes 3 and 4). Quantification of the relative intensities confirmed that increasing amounts of oxaliplatin caused the secretion of increasing amounts of HMGB1 (Fig. 2a) and HMGB2 (Fig. 2b) into the A549 cell media. After 20 μM, 50 μM, or 100 μM oxaliplatin, HMGB1 levels increased by 51.2 ± 20.0% (NS), 57.0 ± 22.3% (p = 0.0078), or 100.0 ± 13.0% (p < 0.0001), respectively (Fig. 2a). After 20 μM, 50 μM, or 100 μM oxaliplatin, HMGB2 levels increased by 36.4 ± 2.0% (p < 0.0001), 67.6 ± 9.3% (p < 0.0001), or 100.0 ± 14.4% (p < 0.0001), respectively (Fig. 2b). Absolute quantification was conducted by nano-LC-PRM/HRMS analysis of the HMGB1 and HMGB2 secreted into the A549 NSCLC cell media after incubation with 100 μM oxaliplatin for 24 h (Fig. 2e). The amount of HMGB1 present in the A549 cell media increased from 0.8 ± 0.2 μg/106 cells or 6.2 ± 1.4 nM in the PBS controls (n = 3) to 6.0 ± 1.7 μg/106 cells or 44.4 ± 12.7 nM (n = 3) after 24 h incubation with 100 μM oxaliplatin (p = 0.0064). The amount of HMGB2 present in the A549 cell media increased from below the limit of quantification in the PBS controls (n = 3) to 3.4 ± 0.9 μg/106 cells or 26.8 ± 6.7 nM (n = 3) after a 24 h incubation with 100 μM oxaliplatin (p = 0.002).
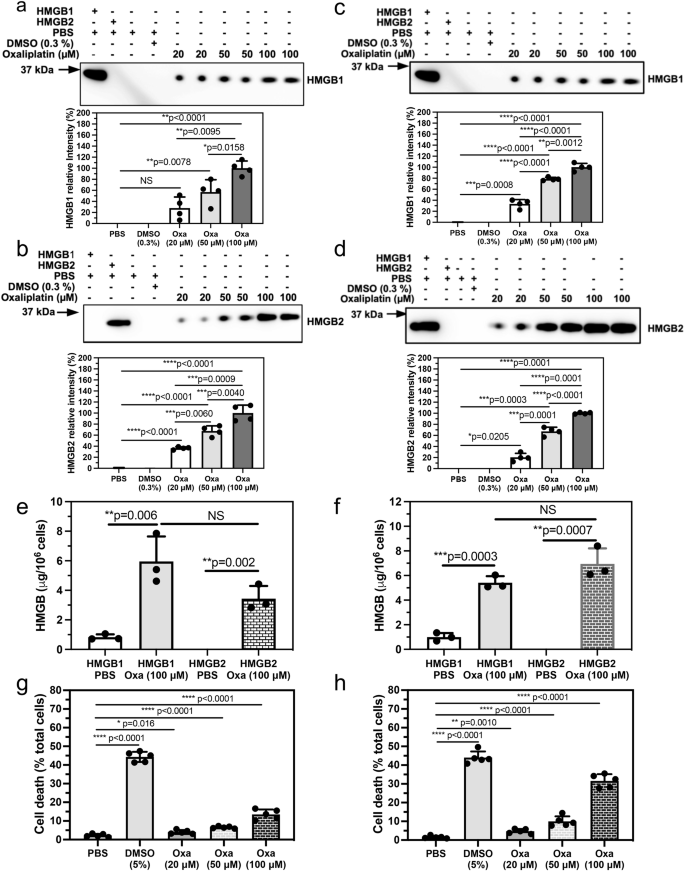
HMGB secretion after incubations with PBS (control), 0.3% DMSO (control), or with 20 μM, 50 μM, or 100 μM oxaliplatin for 24 h. a HMGB1 secreted from A549 cells. b HMGB2 secreted from A549 cells. c HMGB1 secreted from HCT116 cells. d HMGB2 secreted from HCT116 cells. Representative western blots are shown in the upper panels and ImageJ88 quantification of relative intensities of the western blots from two separate experiments conducted in duplicate are shown in the lower panels. Nano LC-PRM/MS absolute quantification of HMGB1 and HMGB2 secreted by PBS or 100 μM oxaliplatin for 24 h. e A549 cells. f. HCT116 cells. Dead cell count as a % of total cell count after incubations with PBS (control), 5% DMSO (positive control), or with 20 μM, 50 μM, or 100 μM oxaliplatin. g A549 cells. h HCT116 cells. Western blot data are from two or three biological replicates. Mass spectrometry data are from three biological replicates and cell viability assays are from five biological replicates. NS not significant, all error bars are expressed as ±SD.
HCT116 colon cancer cells secrete both HMGB1 and HMGB2 in response to oxaliplatin
Having established that NSCLC cells secreted both HMGB1 and HMGB2 in response to oxaliplatin, we next established whether colon cancer cells could also secrete both HMGBs. Anti-HMGB immunoblots of HCT116 cell culture media revealed that both HMGB1 (Fig. 2c) and HMGB2 (Fig. 2d) were secreted after oxaliplatin treatment in a dose-dependent manner. The HMGB1 (Fig. 2c, lane 1) and HMGB2 (Fig. 2d, lane 2) appeared at mobilities close to those observed for the proteins isolated from A549 cell media (Fig. 2a, b, lanes 1 and 2). Control experiments with PBS and 0.3% DMSO again revealed very little secretion of either of the two HMGB proteins (Fig. 2c, d, lanes 3 and 4). Quantification of the relative intensities confirmed that increasing amounts of oxaliplatin up to 100 μM caused the secretion of increasing amounts of HMGB1 (Fig. 2c) and HMGB2 (Fig. 2d) into the HCT116 media. After 20 μM, 50 μM, or 100 μM oxaliplatin, HMGB1 levels in HCT116 media increased by 33.4 ± 1.8% (p < 0.0001), 78.5 ± 3.0% (p < 0.0001), or 100.0 ± 6.9% (p < 0.0001), respectively (Fig. 2c). After 20 μM, 50 μM, or 100 μM oxaliplatin, HMGB2 levels in HCT116 media increased by 20.4 ± 7.4% (p < 0.0001), 67.2 ± 7.5% (p < 0.0001), or 100.0 ± 1.4% (p < 0.0001), respectively (Fig. 2d). Absolute quantification was conducted by nano-LC-PRM/HRMS analysis of the HMGB1 and HMGB2 secreted into the HCT116 cell media after incubation with 100 μM oxaliplatin for 24 h (Fig. 2f). The amount of HMGB1 present in the HCT116 cell media increased from 1.0 ± 0.3 μg/106 cells or 7.5 ± 2.5 nM in the PBS controls (n = 3) to 5.4 ± 0.5 μg/106 cells or 40.8 ± 4.0 nM (n = 3) after 24-h incubation with 100 μM oxaliplatin (p = 0.0003). The amount of HMGB2 present in the HCT116 cell media increased from below the limit of quantification in the PBS controls (n = 3) to 6.9 ± 1.3 μg/106 cells or 54.2 ± 9.8 nM (n = 3) after a 24-h incubation with 100 μM oxaliplatin (p = 0.0007).
Increase of cell death with increasing doses of oxaliplatin
Having determined that concentrations of oxaliplatin up to 100 μM could induce both cell lines to secrete HMGB1 as well as HMGB2, we next established whether these concentrations of oxaliplatin could also reduce cell viability and induce cell death. A549 NSCLC cell death increased to 4.1 ± 1.1% (n = 5) with 20 μM oxaliplatin when compared with PBS controls (2.2 ± 0.8%, n = 5, p = 0.001; Fig. 2g). Cell death increased further to 6.5 ± 0.6% (p = 0.0001, n = 5; Fig. 2g) with 50 μM oxaliplatin and to 13.5 ± 2.6% (p < 0.0001, n = 5; Fig. 2g) with 100 μM oxaliplatin. Similarly, HCT116 colon cancer cell death increased to 4.7 ± 1.2% (n = 5) with 20 μM oxaliplatin when compared with PBS controls (2.1 ± 1.1%, n = 5, p = 0.001; Fig. 2h). Cell death increased further to 9.6 ± 2.7% (p = 0.0001, n = 5; Fig. 2h) with 50 μM oxaliplatin and to 31.6 ± 3.6% (p < 0.0001, n = 5; Fig. 2h) with 100 μM oxaliplatin.
Nuclear HMGB1 and HMGB2 in cancer cells are reduced by treatment with oxaliplatin
The mechanism of HMGB protein secretion was examined in more detail by analyzing HMGB1 and HMGB2 in the nucleus and cytosol after incubating A549 NSCLC and HCT116 colon cancer cells with oxaliplatin. HMGB1 was present in the nucleus (Fig. 3a) and cytosol (Fig. 3b) of the A549 NSCLC cell PBS controls; whereas HMGB2 was present in the nucleus (Fig. 3c) but was close to the detection limit in the cytosol (Fig. 3d). There was a significant reduction in HMGB1 in the nucleus to 66.6 ± 2.7% (p = 0.0148, n = 3; Fig. 3a) and cytosol to 43.5 ± 10.2% (p = 0.0052, n = 3; Fig. 3b) after incubation with 20 μM oxaliplatin for 24 h. It was reduced still further in the nucleus to 40.5 ± 1.9% (p = 0.0027, n = 3; Fig. 3a) and cytosol to 11.6 ± 6.6% (p = 0.0004, n = 3; Fig. 3b) after incubation with 100 μM oxaliplatin for 24 h. There was a similar significant decrease in HMGB2 in the nucleus to 66.1 ± 8.0% (p = 0.0178, n = 3; Fig. 3c), but it was only increased slightly in the cytosol from barely being detected to 1.2 ± 0.3% (p = 0.0447, n = 3; Fig. 3d) after incubation with 20 μM oxaliplatin for 24 h. HMGB2 was reduced still further in the nucleus to 36.2 ± 14.2 (p = 0.0453, n = 3; Fig. 3c) after incubation with 100 μM oxaliplatin for 24 h but again only increased slightly in the cytosol to 1.8 ± 0.2% (p = 0.0039, n = 3; Fig. 3d). Similarly, HMGB1 was present in the nucleus (Fig. 4a) and cytosol (Fig. 4b) of the HCT116 lung cancer cell PBS controls; whereas HMGB2 was present in the nucleus (Fig. 4c) but could barely be detected in the cytosol (Fig. 4d). There was a reduction in HMGB1 in the nucleus of HCT116 cells after incubation with 20 μM oxaliplatin for 24 h to 45.2 ± 14.1% (p = 0.0158, n = 3; Fig. 4a) and it was reduced still further to 16.7 ± 4.8% (p = 0.0005, n = 3; Fig. 4a) after incubation with 100 μM oxaliplatin for 24 h. In contrast, HMGB1 in the cytosol increased substantially to 53.5 ± 12.2% (p = 0.0479, n = 3; Fig. 4b) after incubation with 20 μM oxaliplatin for 24 h and remained elevated at 78.1 ± 15.3% (p = 0.0184; n = 3; Fig. 4b) after incubation with 100 μM oxaliplatin for 24 h. There was also a significant reduction of HMGB2 in the nucleus to 63.8 ± 7.1% (p = 0.0069, n = 3; Fig. 4c) after incubation with 20 μM oxaliplatin for 24 h and it was reduced still further to 10.2 ± 3.3% (p < 0.0001, n = 3; Fig. 4c) after incubation with 100 μM oxaliplatin for 24 h. As was found with the A549 cells (Fig. 3d), HMGB2 was present at almost undetectable levels in the cytosol of HCT116 cells before and after incubation with 20 μM oxaliplatin at 0.6 ± 0.2% (NS, n = 3; Fig. 4d) or 100 μM oxaliplatin at 0.1% ± 0.0% (NS, n = 3; Fig. 4d) for 24 h. These results revealed that oxaliplatin caused nuclear HMGB1 and HMGB2 secretion from both A549 NSCLC cells and HCT116 colon cancer cells.
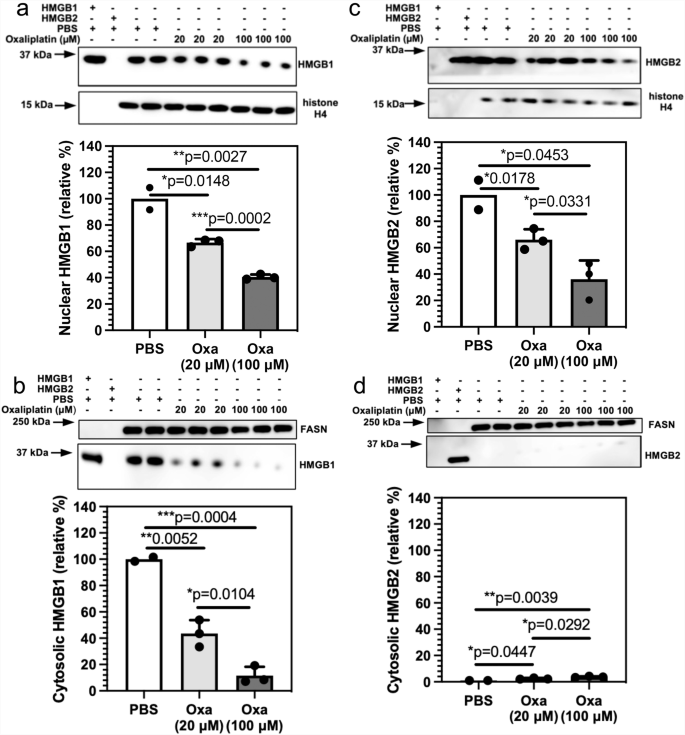
HMGB analysis after incubations with 20 μM or 100 μM oxaliplatin for 24 h. a HMGB1 in the nucleus. b HMGB1 in the cytosol. c HMGB2 in the nucleus. d HMGB2 in the cytosol. Western blots are shown in the upper panels and ImageJ88 quantification of blots in the lower panels. Histone H4 and FASN were used as loading controls for nuclear and cytosolic protein respectively. Cytosolic HMGB1 and HMGB2 were compared with HMGB1 or HMGB2 in the nucleus of the relevant PBS-treated cells. Western blot data are from three biological replicates, all error bars are expressed as ±SD.
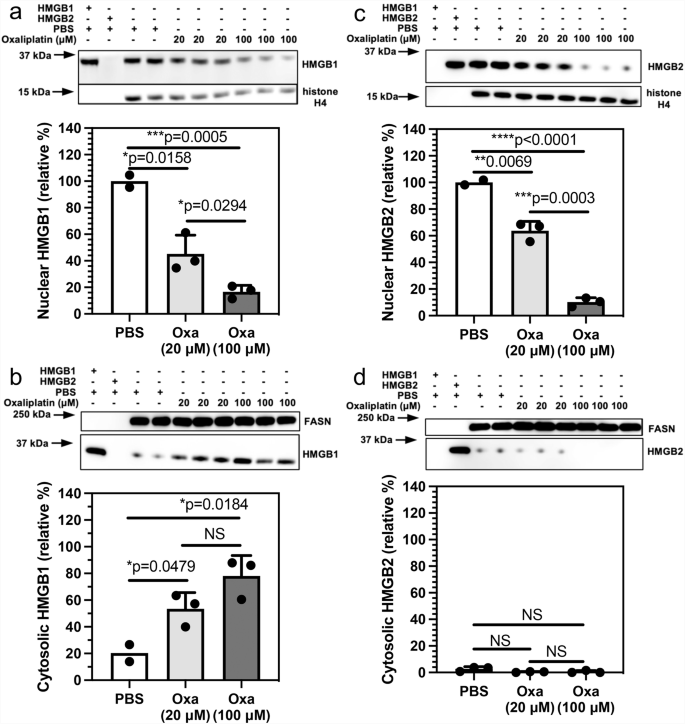
HMGB analysis after incubations with 20 μM or 100 μM oxaliplatin for 24 h. a HMGB1 in the nucleus. b HMGB1 in the cytosol. c HMGB2 expressed in the nucleus. d HMGB2 expressed in the cytosol. Western blots are shown in the upper panels and ImageJ88 quantification of blots in the lower panels. Histone H4 and FASN were used as loading controls for nuclear and cytosolic protein respectively. Cytosolic HMGB1 and HMGB2 were compared with HMGB1 or HMGB2 in the nucleus of the relevant PBS-treated cells. Western blot data are from three biological replicates. NS not significant, all error bars are expressed as ±SD.
Oxaliplatin-induced HMGB1 and HMGB2 secretion is mediated by the nuclear export receptor XPO1
We previously showed that inhibition of XPO1 with 75 nM selinexor caused a reduction in cisplatin-induced HMGB1 secretion in A549 NSCLC cells3. This suggested that selinexor might also reduce oxaliplatin-induced secretion of both HMGB1 and HMGB2. We found that there was a significant reduction in HMGB1 secretion to 35.2 ± 9.2% (n = 3, p = 0.0193; Fig. 5a) and HMGB2 secretion to 1.9 ± 2.1% (n = 3, p = 0.0065; Fig. 5b) from A549 NSCLC cells incubated with 100 μM oxaliplatin when 75 nM selinexor was added. Similarly, there was a significant reduction of HMGB1 secretion to 32.0 ± 5.3% (n = 3, p = 0.0001; Fig. 5c) and HMGB2 to 18.7 ± 7.0% (n = 3, p = 0.0030; Fig. 5d) from HCT116 colon cancer cells incubated with 100 μM oxaliplatin when 75 nM selinexor was added.
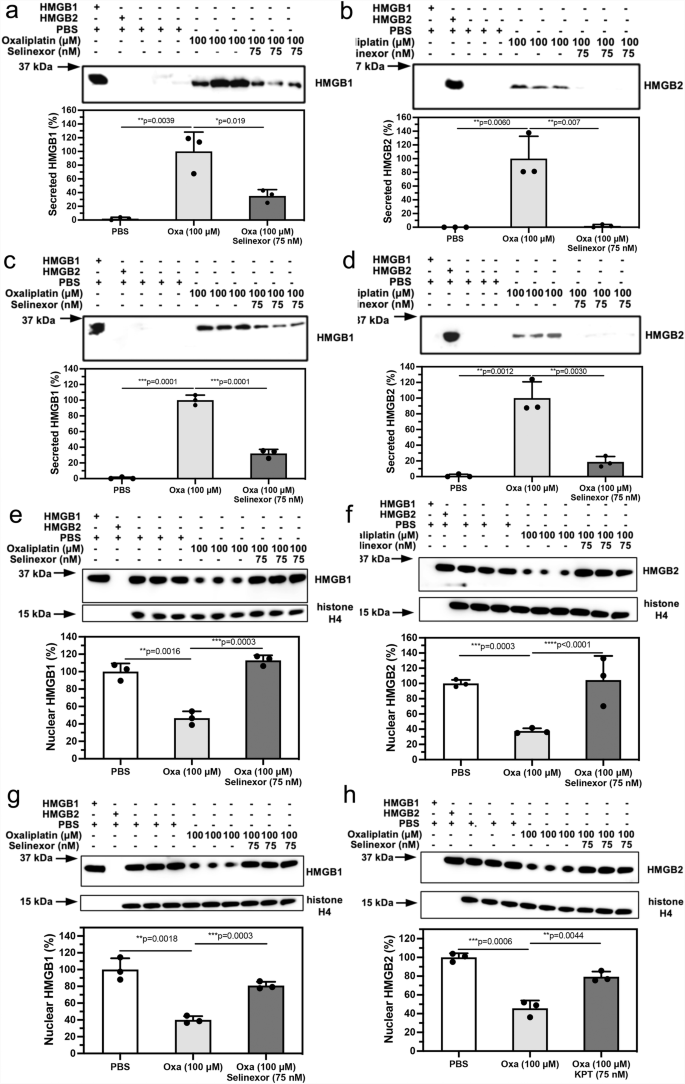
HMGB analysis after incubations with PBS buffer (control), 100 μM oxaliplatin, or 100 μM oxaliplatin + 75 nM selinexor. a HMGB1 in A549 cell media. b HMGB2 in A549 cell media. c HMGB1 in HCT116 cell media. d HMGB2 in HCT116 cell media. e HMGB1 in A549 cell nucleus. f HMGB2 in A549 cell nucleus. g HMGB1 in HCT116 cell nucleus. h HMGB2 in HCT116 cell nucleus. Western blots are shown in the upper panels and ImageJ88 quantification of blots in the lower panels. Western blot data are from three biological replicates. Histone H4 was a loading control for the nuclear fraction. All error bars are expressed as ±SD.
Inhibition of nuclear export reverses the oxaliplatin-induced loss of nuclear HMGB1 and HMGB2
There was a significant difference in nuclear HMGB1 (46.6 ± 7.8%, n = 3; Fig. 5e) after the addition of 100 μM oxaliplatin + 75 nM selinexor to A549 NSCLC cells when compared with 100 μM oxaliplatin alone (112.9 ± 5.8%, p = 0.0003, n = 3; Fig. 5e) or PBS controls (100.0 ± 9.3%, p = 0.0016, n = 3; Fig. 5e). There was a similar significant difference in nuclear HMGB2 (37.6 ± 3.6%,n = 3; Fig. 5f) after the addition of 100 μM oxaliplatin + 75 nM selinexor when compared with 100 μM oxaliplatin alone (104.4 ± 31.7%, p < 0.0001, n = 3; Fig. 5f) or PBS controls (100.0 ± 4.8%, n = 3, p = 0.0003, Fig. 5f). Similarly, there was a significant difference in nuclear HMGB1 (40.1 ± 4.4%,n = 3; Fig. 5g) after the addition of 100 μM oxaliplatin + 75 nM selinexor to HCT116 colon cancer cells when compared with 100 μM oxaliplatin alone (80.9 ± 4.4%, p = 0.0003, n = 3; Fig. 5g) or PBS controls (100.0 ± 13.4%, p = 0.0018, n = 3; Fig. 5g). There was also a significant difference in nuclear HMGB2 (45.7 ± 8.4%, n = 3; Fig. 5h) after the addition of 100 μM oxaliplatin + 75 nM selinexor when compared with 100 μM oxaliplatin alone (79.3 ± 5.6%, p = 0.0044, n = 3; Fig. 5h) or PBS controls (100.0 ± 4.4%, p = 0.0006, n = 3; Fig. 5h).
Inhibition of nuclear export of HMGB1 and HMGB2 reverses oxaliplatin-induced translocation of calreticulin (CRT) from the cytosol to the plasma membrane
The ability to inhibit both HMGB1 and HMGB2 protein secretion from the nucleus into the cytosol made it possible to examine the consequences of this inhibition on the translocation of CRT from the endoplasmic reticulum (ER) to the plasma membrane, a process that is critical for initiating of ICD2,41,42. Incubation of A549 NSCLC cells with oxaliplatin alone caused a significant reduction of cytosolic CRT to 21.4 ± 6.1% (n = 3) when compared with PBS controls (p = 0.0014; Fig. 6a). The reduction in cytosolic CRT levels was reversed by the addition of 75 nM selinexor to the oxaliplatin, which resulted in CRT levels of 72.9 ± 7.7% (n = 3) that were significantly higher than oxaliplatin alone (p = 0.0008; Fig. 6a). In contrast, the levels of plasma membrane CRT in cells treated with 100 μM oxaliplatin of 100.0 ± 5.8% (n = 3) were significantly higher than the PBS controls (p = 0.0014; Fig. 6b). This increase in plasma membrane CRT levels was reversed by the addition of 75 nM selinexor to the oxaliplatin, where the plasma membrane CRT levels of 43.2 ± 3.0% (n = 3) were significantly lower than cells treated with oxaliplatin alone (p = 0.0042; Fig. 6b). Similarly, incubation of HCT116 colon cancer cells with oxaliplatin alone caused a significant reduction of cytosolic CRT to 23.7 ± 7.4% (n = 3) when compared with PBS controls (p = 0.0035; Fig. 6c). The reduction in cytosolic CRT levels was reversed by the addition of 75 nM selinexor to the oxaliplatin, which resulted in CRT levels of 84.8 ± 12.4% (n = 3) that were significantly higher than oxaliplatin alone (p = 0.0019; Fig. 6c). In contrast, the levels of plasma membrane CRT in cells treated with 100 μM oxaliplatin of 100.0 ± 13.0% (n = 3) were significantly higher than the PBS controls (p = 0.0003; Fig. 6d). This increase in plasma membrane CRT levels was reversed by the addition of 75 nM selinexor to the oxaliplatin, where the plasma membrane CRT levels of 10.1 ± 1.6% (n = 3) were significantly lower than cells treated with oxaliplatin alone (p = 0.0003; Fig. 6d).
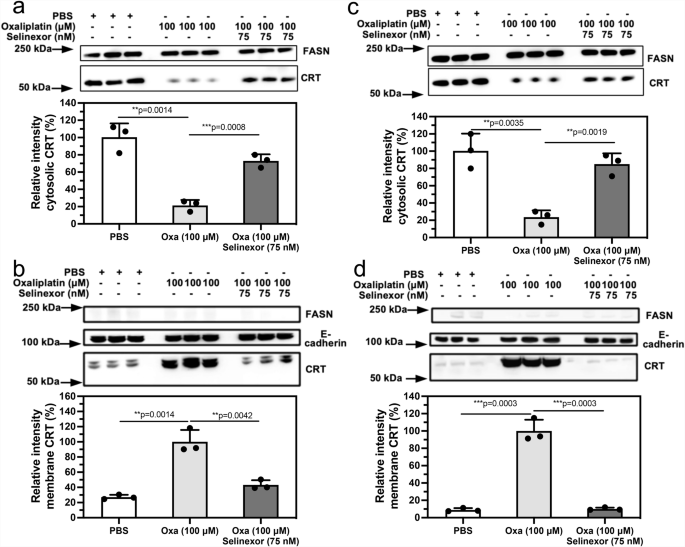
Analysis of CRT in the cytosol and on the plasma membrane after incubations with PBS buffer (control), 100 μM oxaliplatin, or 100 μM oxaliplatin + 75 nM selinexor for 24 h. a Cytosol of A549 cells. b Plasma membrane of A549 cells. c Cytosol of HCT116 cells. d Plasma membrane of HCT116 cells. Western blots are shown in the upper panels and ImageJ88 quantification of blots in the lower panels. FASN and E-cadherin were used as loading controls for cytosolic proteins and membrane proteins, respectively. Western blot data are from three biological replicates, all error bars are expressed as ±SD.
Inhibition of oxaliplatin-induced CRT translocation from the cytosol to the plasma membrane by selinexor can be visualized by immunofluorescence and flow cytometry
Immunofluorescence and flow cytometry were used to confirm that CRT was located specifically on the plasma membrane surface. CRT permeabilized in A549 or HCT116 cells fixed with paraformaldehyde was visualized with a primary mouse pAb to CRT and a fluorescent-labeled secondary goat anti-mouse pAb with excitation at 490 nm and emission at 525 nm. The green fluorescence signal for CRT in A549 cells was localized to the cytosolic compartment with a minimal signal on the plasma membrane surface (Fig. 7a). Merging the blue Hoechst and green CRT signals showed that no CRT had translocated to the nucleus (Fig. 7a). After a 24 h incubation with oxaliplatin, the green fluorescence was observed primarily on the plasma membrane surface (Fig. 7a). Again, merging the blue Hoechst and green CRT signals showed that no CRT had translocated to the nucleus (Fig. 7a). In contrast, the addition of 75 nM selinexor to the oxaliplatin incubation provided fluorescent images that were very similar to those obtained with the PBS control (Fig. 7a). Essentially identical images were obtained with the HCT116 colon cancer cell line (Fig. 7b). Flow cytometry was also used to determine if the CRT was on the plasma membrane surface of the two cell lines. A549 or HCT116 cells were first pre-incubated with a mouse pAb that recognized CRT on the cell surface. After incubation of A549 cells with oxaliplatin for 24 h, 56.2% of the cells had CRT on their plasma membrane cell surface (Fig. 7c); whereas only 0.4% of cells incubated with PBS had CRT on their cell surface (Fig. 7c). Addition of 75 nM selinexor to the oxaliplatin almost completely prevented the CRT translocation so that only 0.8% of the cells had CRT on their plasma membrane surface (Fig. 7c). Again, essentially identical results were obtained for HCT116 colon cancer cells (Fig. 7d).
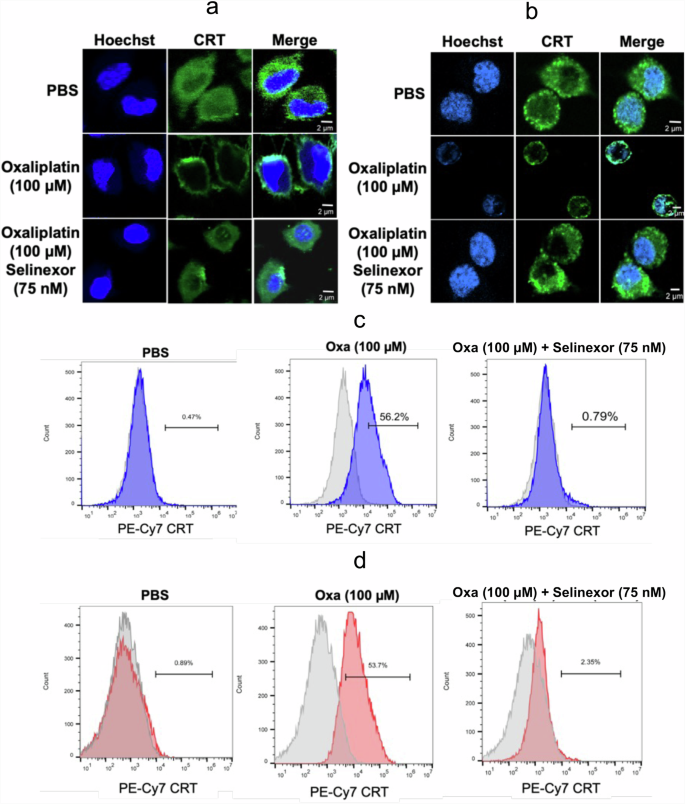
Hoechst immunofluorescent blue signals from nuclear DNA and immunofluorescent green signals from CRT in cells together with merged signals after incubations with PBS buffer (control), 100 μM oxaliplatin, or 100 μM oxaliplatin + 75 nM selinexor for 24 h. a A549 cells (scale bars = 0–2 μm). b HCT116 cells (scale bars = 0–2 μm). FACS analysis of cells with no fluorescent labeling (gray) or cells with a CRT fluorescent tag on the plasma membrane surface (blue or red) after incubating the cells with PBS buffer (control), 100 μM oxaliplatin, or 100 μM oxaliplatin + 75 nM selinexor for 24 h. c A549 cells with a CRT fluorescent tag on the plasma membrane surface (shown in blue). d HCT116 cells with a CRT fluorescent tag on the plasma membrane surface (shown in red). Representative results are shown from single experiments that were conducted on two different days.
Low doses of cell targeted (CT)-HMGB2 can induce the translocation of CRT from the cytosol to the plasma membrane surface
To test whether secretion of HMGB2 into the cytosol could cause CRT translocation, cell-targeted HMGB2 (CT-HMGB2; Fig. 8a) was incubated with the NSCLC and colon cancer cell lines in increasing doses from 0.13 nM to 90 nM for 24 h. The twin-arginine targeting (TAT) sequence (YGRKKRRQRRR)43 at the N-terminus of CT-HMGB2 (Fig. 8a) facilitates the transport of the protein across the plasma membrane. Intracellular cleavage of the TAT sequence by cathepsin B44 at the VA linker then occurs to release cytosolic HMGB2. After 24 h, CT-HMGB2 could not be detected in the cell media of A549 or HCT116 cells. There was a concomitant dose-dependent increase in cytosolic HMGB2 with increasing doses of CT-HMGB2 in both A549 NSCLC cells (EC50 = 2.6 nM; Fig. 8b) and HCT116 colon cancer cells (EC50 = 3.1 nM; Fig. 9a). The CT-HMGB2 also caused a dose-dependent increase in translocation of CRT from the cytosol to the plasma membrane of both A549 NSCLC cells (EC50 = 3.3 nM; Fig. 8c) and HCT116 colon cancer cells (EC50 = 5.4 nM; Fig. 9b). In addition, there was a concomitant decrease in cytosolic CRT in the HCT116 cells (IC50 = 6.2 nM; Fig. 9c). In control experiments, recombinant (R)-HMGB1 and R-HMGB2 primarily remained in the media of both the A549 and HCT116 cells and none was found intracellularly. However, using IP to isolate the cell membrane CRT, R-HMGB2 was found to induce CRT translocation from the cytosol to the membranes of both A549 cells (47.1% of CT-HMGB2; Fig. 8d) and HCT116 cells (41.1% of CT-HMGB2; Fig. 9d). R-HMGB1 did not cause any CRT translocation to the membrane of either A549 cells (Fig. 8d) or HCT116 cells (Fig. 9d). As was observed with oxaliplatin, the green fluorescence signal for CRT, after incubations of HCT116 cells with CT-HMGB2 was present almost exclusively on the plasma membrane surface and there was a significant amount present after incubations with R-HMGB2 (Fig. 9e). Merging the blue Hoechst and green CRT signals showed that no CRT had translocated to the nucleus after incubations with oxaliplatin, CT-HMGB2 or R-HMGB2 (Fig. 9e). As was observed by western blot (Fig. 9d), no CRT translocation to the membrane surface was observed with R-HMGB1 (Fig. 9e). Oxaliplatin (100 μM) and R-HMGB2 (90 nM) were less efficient than CT-HMGB2 (90 nM) at inducing CRT translocation to the plasma membrane surface (Fig. 9e).

a Amino acid sequence of CT-HMGB2 showing the TAT sequence and the VA linker that is cleaved by cytosolic cathepsin B. b Western blots of HMGB2 in the cytosol of A549 cells after incubations with CT-HMGB2 from 0.13 nM to 90 nM for 24 h with ImageJ quantification88 of the relative amounts (EC50 = 3.3 nM). c Western blots of CRT on the plasma membrane of A549 cells after incubations with PBS (control) or increasing amounts of CT-HMGB2 from 0.13 nM to 90 nM for 24 h with ImageJ quantification of the relative amounts (EC50 = 12.4 nM). d Western blots of CRT isolated by IP of A549 cell membranes showing mean relative amounts compared to CT-HMGB2 after duplicate incubations with PBS (control), R-HMGB1 (90 nM), oxaliplatin (100 µM), CT-HMGB2 (90 nM), R-HMGB2 (90 nM) for 24 h. E-cadherin and FASN were used as a loading control for membrane proteins and to reveal cytosolic contamination, respectively.

a Western blots of HMGB2 in HCT116 cell cytosol after incubations with CT-HMGB2 from 0.13 nM to 90 nM for 24 h with ImageJ quantification88 of the relative amounts (EC50 = 3.1 nM). b Western blots of CRT on the plasma membrane of HCT116 cells after incubations with PBS (control) or increasing amounts of CT-HMGB2 from 0.13 nM to 90 nM for 24 h with ImageJ quantification of the relative amounts (EC50 = 5.4 nM). c Western blots of cytosolic CRT from HCT116 cells after incubations with PBS (control) or increasing amounts of CT-HMGB2 from 0.13 nM to 90 nM for 24 h with ImageJ quantification88 of the relative amounts (EC50 = 6.2 nM). d Western blots of CRT isolated by IP from HCT116 cell membranes showing mean relative amounts compared to CT-HMGB2 after duplicate incubations with PBS (control), R-HMGB1 (90 nM), oxaliplatin (100 µM), CT-HMGB2 (90 nM), R-HMGB2 (90 nM) for 24 h. e Hoechst immunofluorescent blue signals from nuclear DNA and immunofluorescent green signals from CRT in HCT116 cells together with merged signals after incubations with PBS (scale bar = 0–4 μm), R-HMGB1 (90 nM, scale bar = 0–6 μm), oxaliplatin (100 μM, scale bar = 0–4 μm), CT-HMGB2 (90 nM, scale bar = 0–8 μm), or R-HMGB2 (90 nM, scale bar = 0–6 μm), for 24 h. Immunofluorescence results are representative of experiments conducted on two different days.
Inhibition of XPO1-mediated oxaliplatin-induced HMGB nuclear export decreases HCT116 cell death
It has been reported previously that cytosolic HMGB1 and HMGB2 can regulate apoptosis through the activation of nuclear factor kappa-light-chain-enhancer of activated B cells (NF-κB)45,46 and downregulation of nuclear factor erythroid 2-related factor 2 (Nrf2)47,48. This suggested that inhibition of HMGB1 and HMGB2 secretion from the nucleus might attenuate the oxaliplatin-mediated increase in death of HCT116 cells by preventing the downregulation of Nrf2, a master controller of both ROS and lipid hydroperoxide detoxification pathways47,48 required to prevent ferroptosis49. Inhibition of the nuclear export receptor XPO1 with 75 nM selinexor, significantly reduced oxaliplatin-mediated HMGB1 secretion (Fig. 5c) and HMGB2 secretion (Fig. 5d) and increased nuclear HMGB1 (Fig. 5g) and nuclear HMGB2 (Fig. 5h), which significantly decreased oxaliplatin-mediated HCT116 cell death by 49.4% to 17.4 ± 1.4% (n = 5) when compared with HCT116 cell death induced by 100 μM oxaliplatin alone of 34.4 ± 3.6% (p < 0.0001, n = 5; Fig. 10a). Selinexor (75 nM) had no effect on cell viability or cell death (Fig. 10a). Ferrostatin-1 (Fer-1, 10 μM), an inhibitor of ROS-induced ferroptotic cell death at this concentration50, significantly decreased oxaliplatin-mediated cell death by 27.9% to 24.8 ± 2.8% (n = 5) when compared with cell death induced by 100 μM oxaliplatin alone of 34.4 ± 3.6% (p < 0.0015, n = 5; Fig. 10a). Selinexor was more effective than Fer-1 at decreasing oxaliplatin-mediated cell death (p = 0.0008; Fig. 10a). There was no additive effect when selinexor and Fer-1 were used in combination (Fig. 10a).

a Dead cells as a % of total cells after incubations with PBS (control), 0.1% DMSO (control), selinexor (75 nM), oxaliplatin (100 μM), oxaliplatin (100 μM) + ferrostatin-1 (10 μM), or oxaliplatin (100 μM) + selinexor (75 nM) for 24 h. E-cadherin and FASN were used as a loading control for membrane proteins and to reveal possible cytosolic contamination, respectively. Cell viability assays were conducted on five biological replicates. b Analysis of GPX4 protein expression by western blot after incubations with PBS (control), oxaliplatin (100 mM), oxaliplatin (100 mM) + selinexor (75 nM). Western blots were quantified by ImageJ88 software using three biological replicates. c Quantification of ROS generation using relative fluorescence of the carboxy-H2DCFDA probe after incubations with PBS (control), oxaliplatin (100 mM), oxaliplatin (100 mM) + selinexor (75 nM), or TBHP (100 mM). Changes in fluorescence were normalized to TBHP as the positive control using three biological replicates. d Quantification of lipid peroxidation using relative fluorescence of the BODIPY-C11 probe using flow cytometry after incubations with PBS (control), oxaliplatin (100 μM), oxaliplatin (100 μM) + selinexor (75 nM), or RSL3 (100 μM). Changes in fluorescence were normalized to RSL3 as the positive control by BD FACSuite Software (BD Biosciences) using three biological replicates. e Quantification of FeII iron accumulation using the relative fluorescence of FerroOrange after incubations with PBS (control), oxaliplatin (100 μM), oxaliplatin (100 μM) + selinexor (75 nM). Changes in fluorescence were normalized to oxaliplatin control by BD FACSuite Software using three biological replicates. f Analysis of Nrf2 expression by western blot after incubations with PBS (control), oxaliplatin (100 μM), oxaliplatin (100 μM) + selinexor (75 nM). Western blots were quantified by ImageJ software88 using three biological replicates and normalized to the Nrf2 level after incubation with PBS. All error bars are expressed as ±SD.
Selinexor inhibits oxaliplatin-mediated downregulation of glutathione peroxidase-4 (GPX4)
Oxaliplatin causes the downregulation of GPX451 an important step involved in ferroptosis because GPX4 prevents the detoxification of lipid hydroperoxides49. Selinexor reduced oxaliplatin-mediated HCT116 cell death like the ferroptosis inhibitor Fer-1 (Fig. 10a). Therefore, we determined whether selinexor could also prevent the oxaliplatin-mediated downregulation of GPX4. Oxaliplatin (100 μM) alone induced the downregulation of GPX4 expression in HCT116 to 32.9 ± 6.1% of control levels (p = 0.0027; Fig. 10b). However, when selinexor (75 nM) was added to the oxaliplatin, downregulation of GPX4 was reduced to only 67.3 ± 6.6% of control levels (p = 0.0007; Fig. 10b) in keeping with the concept that selinexor can inhibit oxaliplatin-induced ferroptosis.
Selinexor inhibits oxaliplatin-mediated production of Reactive Oxygen Species (ROS)
Oxaliplatin also induces the production of ROS51, an important component of ferroptosis that can be inhibited by Fer-152. Therefore, we determined whether selinexor could also prevent the oxaliplatin-mediated increase in ROS production using the 6-carboxy-2′,7′-dichlorodihydrofluorescein diacetate (carboxy-H2DCFDA) fluorescent probe53. Tert. butyl hydroperoxide (TBHP, 100 μM) was used as a positive control (Fig. 10c). ROS levels were normalized to the ROS level induced by 100 μM TBHP (Fig. 10c). Oxaliplatin (100 μM) alone induced an increase in ROS production to 64.9 ± 8.6% of the TBHP level (Fig. 10c). This was significantly higher than the ROS levels in PBS controls of 0.5 ± 0.1% of the TBHP level (p = 0.0002; Fig.10c). The increased ROS levels were attenuated to only 6.8 ± 0.8% of the TBHP level when selinexor was added to the oxaliplatin (p = 0.0003; Fig. 10c). The selinexor-mediated reduction in ROS production is consistent with a decrease in oxaliplatin-induced HCT116 cell ferroptosis.
Selinexor inhibits oxaliplatin-mediated lipid peroxidation
Ferroptosis is a regulated cell death program marked by the accumulation of lipid hydroperoxides that can be monitored using (T-4)-difluoro[5-[[5-[(1E,3E)-4-phenyl-1,3-butadien-1-yl]-2H-pyrrol-2-ylidene-κN]methyl]-1H-pyrrole-2-undecanoato(2-)-κN1]-borate(1-), monohydrogen (BODIPY-C11) fluorescent probe coupled with analysis by flow cytometry54. Therefore, we used BODIPY-C11 analysis to determine whether selinexor could prevent oxaliplatin-mediated increase in lipid peroxidation. (1S,3R)-2-(2-chloroacetyl)-2,3,4,9-tetrahydro-1-[4-(methoxycarbonyl)phenyl]-1H-pyrido[3,4-b]indole-3-carboxylic acid, methyl ester (Ras Selective Lethal 3, RSL3), a potent inhibitor of GPX4 expression and inducer of ferroptosis55 was used as a positive control. Lipid hydroperoxide levels in the HCT116 cells were normalized to the lipid hydroperoxide level observed after treatment with 10 μM RSL3 (Fig. 10d). The lipid hydroperoxide levels in cells treated with 100 μM oxaliplatin alone were 63.4 ± 0.8% of the RSL3 level. This was significantly higher than the levels in PBS controls that were 24.8 ± 1.7% of the RSL3 level (p < 0.0001; Fig. 10d). The increased lipid hydroperoxide levels were reduced to 45.6 ± 2.1% of the RSL3 level when selinexor was added to the oxaliplatin (p = 0.0002; Fig. 10d). The selinexor-mediated reduction in lipid peroxidation is consistent with a decrease in oxaliplatin-induced HCT116 cell ferroptosis.
Selinexor inhibits oxaliplatin-mediated FeII accumulation in HCT116 cells
FerroOrange is a reagent that reacts irreversibly with intracellular FeII, providing a fluorescent signal without interference from other metal ions. Quantification was conducted using a fluorescent microscope with excitation at 543 nm and emission at 580 nm. The FeII levels in HCT116 cells treated with 100 μM oxaliplatin alone were set at 100% (100 ± 3.9%). This was significantly higher than the FeII level of 4.1 ± 0.4% in PBS controls (p < 0.0001; Fig. 10e). The oxaliplatin-mediated increase in FeII level was reduced to 16.4 ± 0.8% when selinexor was added to the oxaliplatin (p < 0.0001; Fig. 10e). This selinexor-mediated reduction in FeII levels is consistent with a decrease in oxaliplatin-induced HCT116 cell ferroptosis.
Selinexor inhibits oxaliplatin-mediated downregulation of Nrf2 in HCT116 cells
Nrf2 in HCT116 cells was quantified by incubation of cell lysates with a primary rabbit anti-Nrf2 mAb followed by a fluorescent-labeled secondary goat anti-rabbit IgG. The Nrf2 level in cells treated with PBS was set at 100% (100 ± 5.1%, Fig. 10f). After treatment with 100 μM oxaliplatin the Nrf2 level dropped significantly to 16.4 ± 0.8% when compared with PBS controls (p < 0.0001; Fig. 10f). The oxaliplatin-mediated decrease in Nrf2 was reversed to 150.5 ± 2.8% (compared with PBS control) when selinexor was added to the oxaliplatin (p < 0.0001; Fig. 10f). The selinexor-mediated increase in Nrf2 levels is consistent with a decrease in oxaliplatin-induced HCT116 cell ferroptosis.
Summary
Oxaliplatin caused a dose-dependent increase in the secretion of HMGB1 and HMGB2 from A549 and HCT116 cells into the extracellular milieu (Fig. 2). This contrasts with cisplatin, which has been shown in several studies to only secrete HMGB1 from cancer cells2,3. After oxaliplatin treatment, there was a concomitant decrease in nuclear HMGB1 and nuclear HMGB2 in both A549 (Fig. 3) and HCT116 cells (Fig. 4) that could be reversed by inhibiting the XPO1 nuclear export receptor with selinexor (Fig. 5). Inhibition of HMGB1 and HMGB2 secretion with selinexor also prevented the oxaliplatin-mediated translocation of CRT from the ER to the plasma membrane (Figs. 6 and 7). As CRT translocation does not occur with cisplatin-mediated HMGB1 secretion2, we hypothesized that HMGB2 might be responsible. In support of this possibility, a cell-targeted form of HMGB2 (CT-HMGB2) caused a highly potent dose-dependent increase in the translocation of CRT to the plasma membrane of both A549 cells (EC50 = 3.3 nM; Fig. 8c) and HCT116 cells (EC50 = 5.4 nM; Fig. 9b). In addition to inducing CRT translocation, oxaliplatin induces ferroptosis in HCT116 cells51,56,57,58,59 but not A549 cells60. Typical biomarkers of ferroptosis include decreased GPX4 expression, increased ROS production, increased lipid peroxidation, increased FeII accumulation, and decreased Nrf2 expression, which were all observed when HCT116 cells were treated with oxaliplatin (Fig. 10). These biomarkers of ferroptosis were reversed when the XPO1 nuclear export receptor was inhibited with selinexor, and cell death was attenuated (Fig. 10). This suggests that factors are secreted from the nucleus that are responsible for the oxaliplatin-mediated ferroptosis observed in HCT116 cells. HMGB1 and HMGB2 are likely candidates because they can down-regulate Nrf2, the master regulator of antioxidant responses51.
Discussion
ICD was characterized by Tesniere et al. as a cell death pathway relevant to certain chemotherapeutic agents that require the release of soluble immunogenic signals including HMGB161. Subsequently, numerous studies have implicated HMGB1 as an immunomodulatory DAMP because it can activate toll-like receptors (TLRs) including TLR262, TLR463, TLR964 and/or the receptor for advanced glycation end products (RAGE)65 by well-characterized amino acid domains on the protein (Fig. 1)66,67. We have now made the surprising observation that oxaliplatin causes the secretion of similar amounts of HMGB1 and HMGB2 from both A549 NSCLC and HCT116 colon cancer cells (Fig. 2); whereas cisplatin only causes HMGB1 secretion3. In contrast to the enormous literature on HMGB1 secretion68, only a limited number of studies have examined the secretion of HMGB226. Consequently, HMGB2 is not currently considered to be a DAMP7, even though (like HMGB1) it can activate RAGE26,69. There are few reported studies showing that HMGB2 can activate TLRs, although this activity is likely because HMGB2 and HMGB1 have identical amino acid sequences in the TLR4 binding region (amino acids 89-108; Fig. 1).
Oxaliplatin-treated tumor cells are very effective at eliciting ICD, whereas tumor cells treated with other DNA-damaging platinum agents such as cisplatin and carboplatin are not70 (Supplementary Fig. 1). HMGB1 is not a primary mediator of CRT translocation and ICD because cisplatin-induced secretion of HMGB1 from cancer cells does not cause cell death by this route2. On the other hand, oxaliplatin induces the rapid, pre-apoptotic translocation of CRT to the plasma membrane cell surface, an important requirement for ICD2,70. Interestingly, cisplatin can also cause translocation of CRT to the plasma membrane, and ICD induction, but only in the context of ER stress as induced with thapsigargin or tunicamycin71. CRT translocation also results from the treatment of tumor cells with other DNA-damaging agents including anthracyclines, bleomycin, and teniposide41. When CRT translocates to the plasma membrane surface of tumor cells, it is detected by the CD91 receptor on antigen-presenting cells, and its recognition prompts phagocytosis72. Translocation of CRT from the ER at early time points results in phagocytosis by immature dendritic-like cells; whereas, at later time points, macrophage-like cells are involved73. The role of CRT in oxaliplatin-induced ICD has been firmly established by depleting CRT with small inhibitory RNA (siRNA), which eliminates the immunogenicity of oxaliplatin74. Immunogenicity can then be readily restored by adding recombinant CRT protein back to the plasma membrane surface74. Thus, translocation of CRT from the ER is a key determinant of anticancer immune responses, which has been exploited as a target mechanism for immunogenic chemotherapy41,42,75.
We recently established that cisplatin-induced HMGB1 secretion is mediated by the nuclear export receptor XPO13 rather than the widely reported acetylation of lysine residues on nuclear localization signal (NLS) 1 and NLS2 (Fig. 1; highlighted in red)76. Using selinexor, a potent XPO1 inhibitor, we have now conclusively established that HMGB2 is also secreted by XPO1 from A549 NSCLC and HCT116 colon cancer cells. Western blot analysis (Fig. 6b, d), immunofluorescence (Fig. 7a, b), and flow cytometry analysis (Fig. 7c, d) revealed that Inhibition of XPO1 in lung cancer and colon cancer cells also prevented oxaliplatin-mediated translocation of CRT to the plasma membrane surface of the two cancer cell lines. This suggested that oxaliplatin-induced secretion of HMGB2 into the cytosol (rather than HMGB1) might be responsible for the CRT translocation because both untreated cell lines had significant levels of HMGB1 in the cytosol (Figs. 3b and 4b) but little HMGB2 (Figs. 3d and 4d). In addition, cisplatin-induced HMGB1 secretion from the nucleus to the cytosol did not cause CRT translocation. HMGB1 and HMGB2 levels in the nucleus of the A549 cells decreased with increasing amounts of oxaliplatin (Fig. 3a, b). HMGB1 levels in the cytosol of the A549 cells also decreased with increasing amounts of oxaliplatin (Fig. 3c). However, only trace amounts of HMGB2 were detected in the cytosol of A549 cells before and after treatment with oxaliplatin (Fig. 3d). As the HMGB2 must have been secreted from the nucleus into the cytosol after treatment with oxaliplatin, this suggests that the HMGB2 was secreted more rapidly from the cytosol into the extracellular milieu than HMGB1. Similarly, HMGB1 and HMGB2 levels in the nucleus of HCT116 cells decreased with increasing amounts of oxaliplatin (Fig. 4a, b). However, in contrast to the A549 cells, HMGB1 levels in the cytosol of the HCT116 cells increased with increasing amounts of oxaliplatin (Fig. 4c). This suggests that the cytosolic HMGB1 in the HCT116 cells is secreted more slowly into the extracellular milieu than the cytosolic HMGB1 in the A549 cells. Again, only trace amounts of HMGB2 were detected in the cytosol of the HCT116 cells before and after treatment with oxaliplatin(Fig. 4d) adding additional evidence that it is secreted more rapidly from the cytosol into the extracellular milieu than HMGB1.
To test whether intracellular HMGB2 could induce the translocation of CRT from the ER, CT-HMGB2 (Fig. 8a) was incubated with A549 and HCT116 cells. CT-HMGB2 has a TAT sequence at the amino terminus (Fig. 8a), which enables it to cross the plasma membrane into the cytosol43. A dipeptide VA linker to the HMGB2 protein (Fig. 8a) can then be cleaved by cytosolic cathepsin B44, which is upregulated in A549 NSCLC cells and HCT116 colon cancer cells77,78. CT-HMGB2 was efficiently taken up by both NSCLC and colon cancer cell lines so that at the end of 24 h, none of the protein was detected in the incubation media of both cells. However, there was a dose-dependent increase of HMGB2 in the cytosol of both cells (Figs. 8b and 9a). This contrasts with R-HMGB1 and R-HMGB2 without a TAT sequence, which remained in the media of A549 and HCT116 cells after 24 h.
Cytosolic HMGB2 derived from CT-HMGB2 caused the translocation of CRT to the plasma membrane surface of A549 cells (EC50 = 3.3 nM, Fig. 8c) and HCT116 cells (EC50 5.4 nM, Fig. 9b) in a similar manner to that observed for oxaliplatin (Figs. 6 and 7). CT-HMGB2-mediated CRT translocation from the cytosol to the plasma membrane had an almost identical IC50 (6.2 nM, Fig. 9c) to the EC50 (5.4 nM; Fig. 9b) observed for CRT translocation to the plasma membrane. Confocal microscopy revealed that 90 nM CT-HMGB2 caused almost complete translocation of CRT to the plasma membrane surface of HCT116 cells (Fig. 9e). The ratio of plasma membrane CRT to E-cadherin was 0.8 in A549 cells (Fig. 8c) and 1.0 in HCT116 cells (Fig. 9b), with a mean ratio of 0.9, after incubating the cells with 90 nM CT-HMGB2. The ratio of plasma membrane CRT to E-cadherin was 1.5 in A549 cells (Fig. 6b) and 1.1 in HCT116 cells (Fig. 6d), with a mean ratio of 1.3, after similar incubations with 100 µM oxaliplatin. This means that CT-HMGB2 is almost three orders of magnitude more potent than oxaliplatin. Surprisingly, non-targeted R-HMGB2 also caused the translocation of CRT to the plasma membrane surface of HCT116 cells (Fig. 9e), although it was significantly less potent than CT-HMGB2 in both A549 cells (Fig. 8d) and HCT116 cells (Fig. 9d). As might be predicted, R-HMGB1 did not cause translocation of CRT to the plasma membrane surface of A549 cells (Fig. 8d) or HCT116 cells (Fig. 9d. e). This raises the interesting possibility that HMGB2 can activate an extracellular receptor (that cannot be activated by HMGB1), which induces CRT translocation to the plasma membrane.
Oxaliplatin only induces apoptosis in A549 cells60 in vitro; whereas oxaliplatin induces both apoptosis79 and ferroptosis in HCT116 cells in vitro51,56,57,58,59. Ferroptosis is a non-apoptotic type of iron-dependent programmed cell death, involving dysregulation of iron homeostasis and lipid peroxidation80. It is characterized by decreased expression of GPX4, increased production of ROS, increased lipid peroxidation, increased FeII accumulation, and decreased Nrf2 expression which occurred when HCT116 cells were treated with oxaliplatin (Fig. 10b–f). The nuclear pore XPO1 inhibitor selinexor, was able to reverse the decrease in GPX4 expression (Fig. 10b), the increase in ROS production as determined using the carboxy-H2DCFDA probe (Fig. 10c), the increase in lipid peroxidation as determined using a BODIPY-C11 probe coupled with flow cytometry (Fig. 10d), the increased FeII accumulation as determined by FerroOrange (Fig. 10e) and the decreased Nrf2 expression (Fig. 10f). Therefore, selinexor-mediated inhibition of the nuclear pore exporter XPO1, decreased five of the major biomarkers of ferroptosis81,82. Selinexor also reduced oxaliplatin-mediated cell death (Fig. 10a). This provides compelling evidence that factors secreted from the nucleus are involved in the induction of ferroptosis and that their secretion is inhibited by selinexor.
HMGB1 and HMGB2, which are factors secreted from the nucleus of HCT116 cells in response to oxaliplatin, are known to activate RAGE69. Consequently, it is possible that the secreted HMGB1 and HMGB2 can also induce the expression of NF-κB45,46. Inhibition of oxaliplatin-mediated secretion of HMGB1 (Fig. 5g) and HMGB2 (Fig. 5h) from the nucleus of HCT116 cells would prevent NF-κB-mediated downregulation of Nrf245,46, and so inhibit both ROS- and lipid hydroperoxide-mediated ferroptosis49. This might explain why the selinexor-mediated reduction of HCT116 cell death by 49.4% when compared with oxaliplatin alone, was greater than the 24.8% reduction in cell death observed by inhibition of ROS-mediated ferroptosis with ferrostatin-180 (Fig. 10a). It is noteworthy that there was no additive effect when selinexor and ferrostatin-1 were used in combination (Fig. 10a).
Inhibition of HMGB1 and HMGB2 secretion and/or preventing their activation of the NF-κB pathway45,46, could potentially prevent ferroptotic cell death in vascular smooth muscle cells46 and neurons50 in vivo. This offers a potential therapeutic approach to preventing ferroptotic cell death in cardiovascular46 and pulmonary diseases83 as well as neurodegenerative diseases48 such as Friedreich ataxia84. Intriguingly, inhibition of HMGB1 secretion85 and ferroptosis50 could also potentially prevent the progression of Alzheimer's disease, where these pathways are thought to play important roles48. These data suggest that both HMGB1 and HMGB2 are potential mediators of ferroptosis; whereas HMGB2 alone can initiate CRT translocation (Fig. 9e).
It is noteworthy that immune checkpoint inhibitor (ICI) therapy appears to synergize with oxaliplatin-based, but not cisplatin-based cancer chemotherapy86. This has led to the suggestion that oxaliplatin and other chemotherapeutic agents that induce CRT translocation, could improve the efficacy of immunotherapies for immune-resistant “cold” tumors42. The improved potency of CT-HMGB2 for inducing CRT translocation in A549 NSCLC cells (EC50 = 3.3 nM) and HCT116 colon cancer cells (EC50 = 5.4 nM), when compared with oxaliplatin, means that it could be a useful adjunct to immunotherapy. In addition, Neubert et al. recently discovered a previously unknown role for HMGB2 in the differentiation and survival of functional memory cells as well as stem-like progenitor-exhausted T cells27. Nuclear HMGB2 makes an important contribution to T-cell factor-1 (TCF-1) and thymocyte selection-associated HMG box (TOX) mediated regulation of T-cell exhaustion through its ability to induce chromatin remodeling. The mechanism of action of ICIs requires the correction of T-cell exhaustion, which might explain why ICIs are only effective in a minority of cancer patients with “hot” tumors87. Targeting HMGB2 might enable “cold” tumors to become responsive to ICI therapy by two distinct and complementary mechanisms: inducing CRT translocation (Fig. 9e), and modulating T-cell exhaustion27. Therefore, targeted protein therapy with novel proteins like CT-HMGB2 could complement the current armamentarium of therapies used in the treatment of cancer as well as expand the proportion of patients responsive to immune-based therapies.
Methods
For a complete list of antibodies, reagents, and materials see Supplementary Table 1.
HMGB proteins
Stable isotope labeling by amino acids in cell culture (SILAC) was used to express stable isotope-labeled HMGB1 protein internal standard (SILAC-HMGB1) as described previously3. Gene fragments for R-HMGB1, R-HMGB2, or CT-HMGB1 were subcloned into a pET-30a (+) vector with an N-terminal 6xHis tag by GenScript (Piscataway, NJ). The plasmid was synthesized, and the relevant HMGB proteins were expressed by the GenScript service. The plasmid was transformed into BL21 Star (DE3) strain, where it underwent overnight growth on a kanamycin-resistant (K+) solid culture medium plate. For the preparation of a glycerol stock strain, a single colony was picked and inoculated into 4–5 mL of Luria-Bertani (LB) culture medium (K+). Subsequently, a 50 mL seed culture was prepared and then inoculated into a TB medium at a 1:100 ratio. Cells were grown at 37 °C until reaching an OD600 value of 1.2, followed by induction of expression using 0.5 mM isopropyl β-d-1-thiogalactopyranoside (IPTG), and expressed at 15 °C for 16-h. Cells were harvested by centrifugation and stored at −80 °C. Cell pellets were re-suspended with lysis buffer (50 mM Tris-HCl, 150 mM NaCl, pH 8.0) followed by sonication. The supernatant after centrifugation was purified by Ni column (GenScript NTA-Ni) affinity chromatography. Protein fractions were finally dialyzed into the imidazole-free buffer (50 mM Tris-HCl, 150 mM NaCl, 10% Glycerol, pH 8.0), analyzed by PAGE, and HMGB proteins were stored at −80 °C until used.
Cell culture and intervention
HCT116 colon cancer cells were cultured in McCoy’s medium and A549 NSCLC cells were cultured in Dulbecco′s modified Eagle′s medium (DMEM) each supplemented with 10% fetal bovine serum (FBS) and 1% penicillin under 5% CO2 at 37 °C. Oxaliplatin was dissolved and sonicated in the relevant culture medium for each type of cell. Selinexor was diluted to the working solution using the relevant culture medium. The final concentration of DMSO was ≤0.1%, which had no effect on the cell viability.
Trypan blue and propidium iodide (PI) fluorescence staining
Cells (1–1.5 × 10⁶) were trypsinized in 10 mL of media using 0.25% trypsin solution (4 mL) for 5 min at 37 °C to prepare a cell suspension. The cell suspension was mixed with 0.4% Trypan Blue solution in a 1:1 ratio and vortex-mixed for 2 min at room temperature. The blue-stained dead cells were counted within 3 min using a Luna-FL automated fluorescence cell (Logos Biosystems, Annandale, VA). Dead cells were stained with a clear blue color, while live cells were colorless and transparent, which were used to determine dead cell count, cell viability and total cell count. A working solution of calcein AM stain (2 µM) was prepared in PBS with ≤0.1% DMSO and enough of the solution was added to adequately cover the adherent cells. Cells in suspension were pelleted by centrifugation, washed once in Hank’s balanced salt solution (HBSS), and incubated for 30 min at 37 °C. Each sample was equilibrated briefly in 2 × saline sodium citrate (SSC) buffer (0.3 M NaCl, 0.03 M sodium citrate, pH 7.0). Cell samples were incubated in 100 μg/mL DNase-free RNase dissolved in 2 × SSC for 20 min at 37 °C. A 500 nM solution of PI was prepared in 2 × SSC, and the cells were covered with 300 μL of the PI solution for 5 min. The green calcein-stained live cells and the red PI-stained apoptotic and necrotic cells were counted using a Leica DM750 HD digital fluorescence microscope (Leica Microsystems Inc., Deerfield, IL).
Sub-cellular protein isolation
Cytosolic and nuclear proteins were isolated using a sub-cellular protein fractionation kit for cultured cells (# 78840). The protocol was adapted from that supplied with the kit. Cells (1–1.5 × 10⁶) were trypsinized with 0.25% trypsin solution (4 mL) and then centrifuged at 500 × g for 5 min in an ST40R centrifuge (Thermo Scientific, Waltham, MA). Cells were washed by suspending the cell pellet in ice-cold PBS (1 mL). Proprietary ice-cold cytoplasmic extraction buffer (CEB, 1 mL) containing 1 µL protease inhibitors was added to the cell pellet, the pellet was incubated at 4 °C for 10 min with gentle mixing, then centrifuged at 500 × g for 5 min in a 5430R microcentrifuge (Eppendorf, Hauppauge, NY). The supernatant was removed and provided the cytoplasmic fraction for further analysis. Ice-cold nuclear extraction buffer (NEB, 1 mL) containing 1 µL of protease inhibitors was added to the pellet after the supernatant had been removed and vortex-mixed at the highest setting for 15 s. The NEB mixture was incubated at 4 °C for 30 min with gentle mixing, then centrifuged at 5000 × g for 5 min using a microcentrifuge. The supernatant provided the soluble nuclear fraction for further analysis. Cell plasma membranes were prepared with the Mem-PER Plus Kit (#89842). Cells (1–1.5 × 10⁶) were suspended in growth media of the relevant cells by scraping the cells off the surface of the plate with a cell scraper. The harvested cell suspension was centrifuged at 300 × g for 5 min in a 5430R microcentrifuge. The cell pellet was washed with the provided proprietary cell wash solution (3 mL) and centrifuged at 300 × g for 5 min in the 5439R microcentrifuge. The provided proprietary permeabilization buffer (0.75 mL) was added to the cell pellet and incubated for 30 min at 4 °C with constant mixing. Permeabilized cells were centrifuged for 15 min at 16,000 × g in the 5409R microcentrifuge. The supernatant was removed and provided the cytoplasmic portion for further analysis. Proprietary membrane solubilization buffer (0.5 mL) that was provided in the kit was added to the pellet after removal of the supernatant and membranes re-suspended by pipetting up and down. After incubating at 4 °C for 50 min with constant mixing, the membrane preparation was centrifuged at 16,000 × g for 15 min at 4 °C in the microcentrifuge. Separation of the supernatant provided the plasma membrane fraction for further analysis.
Western blot analysis of media
Cell media (200 μL) from HCT116 or A549 cells was concentrated with nitrogen gas using an N-Evap concentrator (Organomation, West Berlin, MA). The residue was dissolved in 20 μL of Nupage sample loading buffer, which was loaded on a 10% NuPAGE Bis-Tris protein gel. The gel was run under 150 V for 1.5 h until the blue dye ran to the bottom of the gel. The proteins were transferred to an Invitrogen nitrocellulose membrane and HMGB1 detected by incubation overnight at 4 °C with an HMGB1 rabbit pAb (ab79823) primary antibody. All of the antibodies used for western blots were diluted by 1:2000 with 5% nonfat milk in PBS. An incubation with a secondary anti-rabbit HRP antibody was then conducted for 1.5 h. The blots were developed with the electrochemical luminescence (ECL) reagent (Revvity) and visualized with an ImageQuant LAS 4000 camera (GE Healthcare, Piscataway, NJ). HMGB2 was similarly detected via a primary HMGB2 rabbit pAb (ab124670) and a secondary anti-rabbit HRP antibody. Western blots for HMGB1 and HMGB2 were then quantified using open-source ImageJ software88. The membrane western blot signals were normalized by subtraction of the membrane blank at the appropriate gel mobility, and the grayscale value was determined for each blot.
IP of cell membrane CRT for western blot analysis
Protein A/G magnetic beads (40 µL) were transferred to 2-mL Eppendorf protein LoBind tubes. The beads were washed twice with DPBS and twice with buffer A (0.1 M sodium phosphate, pH 7.4). The tubes were then incubated at 4 °C overnight with buffer A (500 µL) and rabbit anti-CRT pAb (50 µL; ab227444). Rabbit anti-CRT pAb solution was removed and beads were washed gently with 1 mL of cross-linking buffer (0.2 M triethanolamine, pH 8). The beads were then suspended in 1 mL of 25 mM dimethylpimelimidate (DMP) prepared in cross-linking buffer and incubated at room temperature for 1 h with gentle rotation. The DMP solution was removed, and the beads were washed with 1 mL of blocking buffer (0.1 M ethanolamine, pH 8.2) and incubated at room temperature for 30 min in 1 mL of blocking buffer. The beads were then incubated in elution buffer (0.1 M glycine-HCl) for 15 min at room temperature with gentle rotation. After removing the elution buffer, covalently bound CRT pAb beads (10 μL) were aliquoted into Eppendorf protein LoBind tubes containing 1 mL of HCT116 or 1 mL of A549 cell suspension (1–1.5 × 10⁵). Intact cells were incubated for 6-h at 4 °C with gentle rotation to allow the plasma membrane CRT to bind to the covalently bound CRT pAb. Cells were then discarded, and the beads were washed 2× with DPBS (1 mL). The beads were shaken vigorously in 100 µL elution buffer for 10 min and then for a further 5 min with 10 mM NH4HCO3 (50 µL). The beads were removed, which left the CRT protein in the supernatant. Each sample was then neutralized with 250 mM NH4HCO3 (50 µL) and centrifuged at 7000 × g for 10 min in a 5430R microcentrifuge to remove any residual cell debris. Loading buffer was added (50 μL) and 15 μL of the solution containing CRT protein was analyzed by western blot as described for the sub-cellular fractions.
Western blot analysis of sub-cellular fractions and glutathione peroxidase-4 (GPX4)
The residue from nuclear, cytoplasmic, and plasma membrane samples was dissolved in 10 μL of Nupage sample loading buffer. Total protein concentration was quantified using the BCA protein assay to ensure equal amounts of protein were loaded on the gel for different sample groups. Typically, 4 μg of total protein from each of the sub-cellular fractions was loaded on a 10% NuPAGE Bis-Tris protein gel. The gel was run under 150 V for 1.5 h until the blue dye ran to the bottom of the gel. After PAGE separation was completed, proteins were transferred to a nitrocellulose membrane, which was then incubated overnight at 4 °C with the primary antibody. An incubation with a secondary antibody at room temperature for 1.5 h was then performed. The blots were developed with the ECL reagent and visualized with an ImageQuant LAS 4000 camera (GE Healthcare, Piscataway, NJ). Blots were quantified with ImageJ88 as described above. The primary and secondary antibodies for HMGB1 and HMGB2 were the same as for the media samples described above. The primary antibody for CRT was rabbit anti-CRT monoclonal antibody (mAb; ab22744), for fatty acid synthase (FASN) was rabbit anti-FASN mAb (MA5-14887), for histone H4 was rabbit anti-H4 mAb (16047-IAP), for E-cadherin was rabbit anti-E-cadherin mAb (EP700Y), and for Gpx4 was rabbit anti-GPX4 monoclonal antibody (ab125066). The secondary antibody for CRT, FASN, histone H4, E-cadherin, and GPX4 was goat anti-Rabbit IgG (#7074S). To add molecular weight information to the western blots, digital photograph of the membrane was taken by the ImageQuant LAS 4000 camera immediately after chemiluminescent imaging. The image was then temporarily overlayed in Photoshop to manually mark the molecular weight markers on the chemiluminescent image.
Western blot analysis of membrane and cytosolic CRT after treatment with CT-HMGB2
HCT116 cells (1–1.5 × 10⁵) or A549 cells (1–1.5 × 10⁵) were seeded in 6 well plates. CT-HMGB2 (0.13 to 90 nM) was added to cells, which were then incubated for 24 h. Membranes from A549 cells or membranes and cytosol from HCT116 cells were then prepared with a sub-cellular protein fraction kit for cultured cells using the protocol supplied by the manufacturer. After collecting the membrane and cytoplasmic fractions, a BCA protein assay was used for quantification of total protein to ensure consistent protein concentrations between different groups when analyzed by western blot. Samples were dissolved in the sample loading buffer, PAGE was conducted, and proteins were then transferred to a PVDF membrane. The membranes were incubated overnight at 4 °C with rabbit anti-CRT (diluted 1:2000) followed by goat anti-rabbit IgG (diluted 1:2000) at room temperature for 1.5 h. Images were acquired by ImageQuant LAS 4000 and quantified by ImageJ software88. E-cadherin and FASN were quantified as described above.
Flow cytometry for CRT analysis
HCT116 (1–1.5 × 10⁵) cells and A549 cells (1–1.5 × 10⁵) were harvested and washed twice with PBS. The cells were then incubated for 1.5 h in the dark at 4 °C with PE-Cy-7-labeled anti-CRT that had been labeled with the Abcam PE/Cy7 conjugation kit following the manufacturer’s instructions. HCT116 and A549 cells were then re-suspended in cold PBS (1.5 mL) for analysis on the NovoCyte Advanteon flow cytometer system (Agilent Technologies, Santa Clara, CA). Natural cell fluorescence was monitored by excitation at 564 nm and emission at 606 nm; whereas CRT fluorescence was monitored by excitation at 496 nm and emission at 774 nm. Results from the flow cytometer were analyzed with BD FACSuite Software (BD Biosciences, San Jose, CA).
Flow cytometry for BODIPY analysis
HCT116 colon cancer cells (2–2.5 × 10⁴) were seeded in 12-well plates. The plates were incubated overnight in a humidified tissue culture incubator at 37 °C with 5% CO2. Cells were treated with Ras Selective Lethal 3 (RSL3, 10 μL) GPX4 inhibitor (positive control), oxaliplatin (100 μM) or oxaliplatin (100 μM) + (75 nM) for 24 h. Cells were harvested by treatment with trypsin and re-suspended in medium containing 5 μM (T-4)-difluoro[5-[[5-[(1E,3E)-4-phenyl-1,3-butadien-1-yl]-2H-pyrrol-2-ylidene-kappaN]methyl]-1H-pyrrole-2-undecanoato(2-)-ΚN1]-borate(1-), monohydrogen (C11-BODIPY) dye and then incubated at 37 °C with 5% CO2 for 30 min. Flow cytometry was performed on an LSR B flow cytometer (BD Biosciences, Franklin Lakes, NJ), and the oxidized BODIPY-C11 was detected with green excitation/emission at 488/510 nm. A minimum of 10,000 cells was analyzed for each condition. Data analysis was performed using FlowJo software (version 10.6; BD Biosciences).
Immunofluorescence for CRT analysis
HCT116 cells (1–1.5 × 10⁴) cells or A549 cells (1–1.5 × 10⁴) were treated with PBS (control), oxaliplatin (100 μM), or oxaliplatin (100 μM) + selinexor (75 nM) for 24 h on a chamber slide of a confocal microscope. Cells were washed with 1 mL of PBS and fixed at room temperature with 4% paraformaldehyde for 10 min. The fixed cells were incubated with 500 μL of 0.1% Triton for 5 min to permeabilize the cell membrane by creating holes on their cell surface. Cells were then incubated with 500 μL of goat serum at room temperature for 1 h, followed by an incubation with a primary mouse anti-CRT mAb (ab22683) for 20-h at 4 °C, and a room temperature incubation with a green fluorescent-labeled secondary antibody (goat anti-mouse IgG H&L; Alexa Fluor® 488) for 1 h. Cell permeable Hoechst 3342 dye was used to visualize the presence of nuclear DNA in the cells by staining for 15 min. Hoechst 3342 binds to the minor groove of DNA at A-T-rich regions and emits blue fluorescence when bound to double-stranded DNA. Images were acquired with an Olympus FV1000 confocal microscope (Evident Scientific, Waltham, MA) at 1000 × magnification.
Quantification of reactive oxygen species (ROS)
HCT116 colon cancer cells (2–2.5 × 10⁴) were seeded in 12-well plates. After 24 h, oxaliplatin (100 μM), oxaliplatin (100 μM) + selinexor (75 nM), or TBHP solution (100 μM) were added to the cells and incubated at 37 °C under 5% CO2 for 90 min. The cells were gently washed with warm PBS and covered with 500 μL of 25 μM 6-carboxy-H2DCFDA solution as an indicator of ROS production. Cells were protected from the light and incubated for 30 min at 37 °C. Hoechst 33342 (1 μM) was added to the carboxy-H2DCFDA solution during the last 5 min of the incubation. Cells were then gently washed three times in PBS and images were taken with an Invitrogen fluorescence microscope (EVOS7000, Thermo Fisher). Fluorescent images were quantified using ImageJ software88.
Quantification of FeII in HCT116 cells with FerroOrange
HCT116 cells (2–2.5 × 10⁴) were seeded in 12-well plates and treated with PBS (control), oxaliplatin (100 μM), or oxaliplatin (100 μM) + selinexor (75 nM) for 24 h. The cell culture medium was removed, and cells were washed gently twice with PBS to remove extracellular FeII. A stock solution of FerroOrange (1 mM) was diluted with PBS to prepare a staining solution with a final concentration of 1 μM. The cells were protected from the light, incubated for 30 min at 37 °C with the FerroOrange (1 μM) solution, the stained cells were washed twice with PBS, and the nuclei were stained with Hoechst dye for 15 min. Cells were imaged using an EVOS7000 fluorescence microscope (Thermo Scientific) and image analysis was performed using ImageJ software88.
Immunofluorescence for Nrf2
HCT116 cells (2–2.5 × 10⁴) were seeded in 12-well plates and treated with PBS (control), oxaliplatin (100 μM), or oxaliplatin (100 μM) + selinexor (75 nM) for 24 h. Cells were washed with PBS and fixed at room temperature with 4% paraformaldehyde for 10 min. The cells were then treated with 500 μL of 0.1% Triton X100 for 5 min to permeabilize the cell surfaces and maintained in 500 μL of 10% goat serum (to reduce non-specific binding between samples and antibodies) at room temperature for 1 h. Cells were then incubated at 4 °C with the primary rabbit anti-Nrf2 mAb (diluted 1:500) for 20 h before incubation at room temperature with a fluorescent-labeled secondary goat anti-rabbit IgG (diluted 1:500) for 1 h. The cell nuclei were stained with Hoechst dye for 15 min and images were acquired using an EVOS7000 fluorescence microscope (Thermo Scientific) and image analysis was performed using ImageJ software88.
Gel protein digestion for nano-LC-PRM/HRMS analysis
Media (200 μL) from HCT116 or A549 cells was spiked with SILAC-HMGB1, concentrated with nitrogen gas using an N-Evap concentrator (Organomation), and dissolved in 10 μL Nupage sample loading buffer (10 μL). Samples were loaded on a 10% NuPAGE Bis-Tris protein gel. The gel was run under 150 V for 1.5 h until the blue dye ran to the bottom of the gel. Bands corresponding to mobility of between 25 kDa and 37 kDa were removed with a surgical blade, sliced into 1 mm3 gel pieces, and de-stained by rinsing these pieces twice in 25 mM NH4HCO3 buffer/50% acetonitrile solution. The gel pieces were then dehydrated in 100% acetonitrile, vortex-mixed for 10 min, and the supernatant was discarded. They were then suspended in 25 mM NH4HCO3 (100 μL) and vortex-mixed for 10 min at room temperature. Chymotrypsin (500 ng) in buffer (100 mM Tris-HCl and 10 mM CaCl2; 50 μL) was added to each sample, the pH was adjusted to 8.0, and incubations were conducted for 20-h at room temperature. After the digestion, the supernatant was transferred to a clean 1.5 mL protein LoBind tube, and 200 μL of extraction buffer (3% formic acid in 50% aqueous acetonitrile) was added to the gel pieces. The mixture was sonicated at 37 °C for 30 min. The supernatant was dried under N2, the residue re-suspended in water (50 μL), and the solution was transferred to deactivated glass inserts ready for LC-MS analysis.
Nano-LC-PRM/HRMS
Analysis was carried out using a Q Exactive HF hybrid quadrupole-Orbitrap mass spectrometer coupled to a Dionex Ultimate 3000 RSLCnano with a capillary flowmeter chromatographic system, supplied by Thermo Fisher Scientific (San Jose, CA, USA). The nano-LC system comprised a trapping column (Acclaim PepMap C18 cartridge, 0.3 mm × 5 mm, 100 Å, Thermo Scientific) for preconcentration, and an analytical column (C18 AQ nano-LC column with a 10 µm pulled tip, 75 µm × 25 cm, 3 µm particle size; Columntip, New Haven, CT, USA) for peptide separation. The nano-LC system included two pumps: a nanopump delivering solvents to the analytical column and a micropump connected to the trapping column. Additionally, a 10-port valve was part of the system. Xcalibur software was used to control the nano-LC system. Samples (8 µL) were injected using the microliter-pickup injection mode. The loading solvent, composed of water/acetonitrile (99.7:0.3 v/v) with 0.2% formic acid, was used at a rate of 10 µL/min for 3 min. During the analysis, the 10-port valve was initially set at the loading position (1–2) with the loading solvent, and after 3 min, it switched to the analysis position (1–10). At this point, the trapping column was connected to the analytical column, and the loaded samples were backflushed into the analytical column. The valve remained in the analysis position for 10 min before returning to the loading position for the next analysis. A linear gradient elution was employed at a flow rate of 0.35 µL/min, starting with 2% B at 2 min, reaching 5% B at 15 min, 35% B at 40 min, 95% B at 45–55 min, and returning to 2% B at 58–70 min. Solvent A was water/acetonitrile (99.5:0.5 v/v) with 0.1% formic acid, while solvent B was acetonitrile/water (98:2 v/v) with 0.1% formic acid. A Nanospray Flex ion source (Thermo Scientific) was utilized. MS operating conditions were set as follows: spray voltage 2500 V, ion transfer capillary temperature 250 °C, positive ion polarity, S-lens RF level 55, in-source collision-induced dissociation (CID) 1.0 eV. Both full-scan and parallel reaction monitoring (PRM) modes were employed. Full-scan parameters included a resolution of 60,000, an automatic gain control (AGC) target of 1 × 10⁶, a maximum IT of 200 ms, and a scan range of m/z 290–1600. PRM parameters involved a resolution of 60,000, AGC target of 2 × 10⁵, maximum IT of 80 ms, loop count of 5, isolation window of 1.0 Da, and normalized collision energy (NCE) of 25.
Quantification of HMGB1 and HMGB2
The HMGB1 protein standard and HMGB2 protein standard (Supplementary Fig. 2a) ran as single bands on PAGE analysis with Coomassie staining. Standard curve HMGB1 and HMGB2 samples were separated by PAGE and subjected to chymotrypsin digestion in the range 65–680 ng. The peptide K90DPNAPKRPPSAF102 resulting from chymotrypsin digestion of HMGB1 was used to quantify HMGB1 with K90DPNAPKRPPSAF102 internal standard from chymotrypsin digestion of the SILAC-HMGB1 protein (K = [13C615N2-]-lysine). There is no equivalent chymotryptic peptide from HMGB2 because F-89 is replaced by K-89 in HMGB2 (Fig. 1). Chymotryptic peptide S134EQSAKDKQPY144, which has five amino acid differences compared with the corresponding HMGB1 tryptic peptide N134NTAADDKQPY144, was used to quantify HMGB2. Standard curves for HMGB2 were prepared using S134EQSAKDKQPY144 peptide intensities after chymotrypsin digestion of HMGB2 with no internal standard (Supplementary Table 2). Light-to-heavy peptide ratios were calculated from the sum of the three most intense PRM transitions for the HMGB1 chymotryptic peptide K90DPNAPKRPPSAF102 or the signal intensity from the sum of the four most intense transitions (×10-6) for the HMGB2 chymotryptic peptide S134EQSAKDKQPY144 (Supplementary Table 2; Supplementary Fig. 2b). A typical regression line for K90DPNAPKRPPSAF102 was y = 0.01306x − 0.3176 (r2 = 0.9856) and for S134EQSAKDKQPY144 was y = 0.1594x − 1.015 (r2 = 0.9989; Supplementary Fig. 2c). Back calculated values for the HMGB1 standards and the HMGB2 standards (Supplementary Fig. 2d) were within 85% and 115% of the theoretical values. Interpolation of light-to-heavy peptide ratios for the HMGB1 peptide or the sum of the four most intense transitions for the HMGB2 chymotryptic peptide S134EQSAKDKQPY144 in the relevant linear standard curve then provided the amount of HMGB1 or HMGB2 in the cell media. Analyses of the A549 cell and HCT116 cell media were conducted in triplicate. LC-PRM/HRMS chromatograms are shown for the chymotryptic peptide S134EQSAKDKQPY144 from the 365 ng HMGB2 standard (Supplementary Fig. 2e), HMGB2 secreted from A549 cells (Supplementary Fig. 2f), and HMGB2 secreted from HCT116 cells (Supplementary Fig. 2g).
Statistics and reproducibility
Data comparisons between two different groups were performed using the Student’s unpaired two-tailed t-test and EC50 values were calculated using GraphPad Prism (Prism 10 for Mac Version 10.1.1, November 21, 2023). A p value of <0.05 was regarded as statistically significant. All error bars are expressed as ±standard deviation (SD) Processing of mass spectrometry data and standard curves was conducted using Skyline software (MacCoss Laboratory, University of Washington, Seattle, WA)89.
Reporting summary
Further information on research design is available in the Nature Portfolio Reporting Summary linked to this article.
Data availability
The data that support the findings of this study are available within the paper. Full size western blots are shown in Supplementary Fig. 3. Numerical source data underlying graph plots in the manuscript, figures exemplifying the gating strategy, and validation of cell types can be found in Supplementary Data 1. Any additional information not included in the paper is available upon request from Dr. Ian A. Blair.
Change history
04 October 2025
A Correction to this paper has been published: https://doi.org/10.1038/s42003-025-08894-z
References
Monneret, C. Platinum anticancer drugs. From serendipity to rational design. Ann. Pharm. Fr. 69, 286–295 (2011).
Tesniere, A. et al. Immunogenic death of colon cancer cells treated with oxaliplatin. Oncogene 29, 482–491 (2010).
Gillespie, K. P., Pirnie, R., Mesaros, C. & Blair, I. A. Cisplatin dependent secretion of immunomodulatory high mobility group box 1 (HMGB1) protein from lung cancer cells. Biomolecules https://doi.org/10.3390/biom13091335 (2023).
Fucikova, J. et al. Detection of immunogenic cell death and its relevance for cancer therapy. Cell Death Dis. 11, 1013 (2020).
Casares, N. et al. Caspase-dependent immunogenicity of doxorubicin-induced tumor cell death. J. Exp. Med. 202, 1691–1701 (2005).
Weng, L., Guo, L., Vachani, A., Mesaros, C. & Blair, I. A. Quantification of serum high mobility group box 1 by liquid chromatography/high-resolution mass spectrometry: implications for its role in immunity, inflammation, and cancer. Anal. Chem. 90, 7552–7560 (2018).
Starkova, T., Polyanichko, A., Tomilin, A. N. & Chikhirzhina, E. Structure and functions of HMGB2 protein. Int. J. Mol. Sci. https://doi.org/10.3390/ijms24098334 (2023).
Lotze, M. T. & Tracey, K. J. High-mobility group box 1 protein (HMGB1): nuclear weapon in the immune arsenal. Nat. Rev. Immunol. 5, 331–342 (2005).
Niu, L. et al. Biological functions and theranostic potential of HMGB family members in human cancers. Ther. Adv. Med. Oncol. 12, 1758835920970850 (2020).
Ikram, F. Z., Arulsamy, A., Retinasamy, T. & Shaikh, M. F. The role of high mobility group box 1 (HMGB1) in neurodegeneration: a systematic review. Curr. Neuropharmacol. 20, 2221–2245 (2022).
Paudel, Y. N. et al. Impact of HMGB1, RAGE, and TLR4 in Alzheimer’s Disease (AD): from risk factors to therapeutic targeting. Cells https://doi.org/10.3390/cells9020383 (2020).
Wang, M. et al. The role of HMGB1, a nuclear damage-associated molecular pattern molecule, in the pathogenesis of lung diseases. Antioxid. Redox Signal 31, 954–993 (2019).
Wu, T. et al. HMGB1 overexpression as a prognostic factor for survival in cancer: a meta-analysis and systematic review. Oncotarget 7, 50417–50427 (2016).
Lee, H. et al. Diagnostic significance of serum HMGB1 in colorectal carcinomas. PLoS ONE 7, e34318 (2012).
Kang, R. & Tang, D. The dual role of HMGB1 in pancreatic cancer. J. Pancreatol. 1, 19–24 (2018).
Plemmenos, G., Tzimogianni, V., Fili, C. & Piperi, C. Contributing role of high mobility group box 1 signaling in oral cancer development and therapy. Life https://doi.org/10.3390/life13071577 (2023).
Barreiro-Alonso, A. et al. High mobility group B proteins, their partners, and other redox sensors in ovarian and prostate cancer. Oxid. Med. Cell. Longev. 2016, 5845061 (2016).
Li, Y. et al. Serum high mobility group box protein 1 as aclinical marker for ovarian cancer. Neoplasma 61, 579–584 (2014).
Wu, X. J., Chen, Y. Y., Gong, C. C. & Pei, D. S. The role of high-mobility group protein box 1 in lung cancer. J. Cell Biochem. 119, 6354–6365 (2018).
Kuniyasu, H. et al. Expression of receptors for advanced glycation end-products (RAGE) is closely associated with the invasive and metastatic activity of gastric cancer. J. Pathol. 196, 163–170 (2002).
Xiang, Y. Y. et al. Expression of high-mobility group-1 mRNA in human gastrointestinal adenocarcinoma and corresponding non-cancerous mucosa. Int. J. Cancer 74, 1–6 (1997).
Oue, N. et al. Genes involved in invasion and metastasis of gastric cancer identified by array-based hybridization and serial analysis of gene expression. Oncology 69, 17–22 (2005).
Liang, H., Zhong, Y., Zhou, S. & Peng, L. Knockdown of RAGE expression inhibits colorectal cancer cell invasion and suppresses angiogenesis in vitro and in vivo. Cancer Lett. 313, 91–98 (2011).
Chen, J. et al. HMGB1 promotes the development of castration‑resistant prostate cancer by regulating androgen receptor activation. Oncol. Rep. https://doi.org/10.3892/or.2022.8412 (2022).
Pan, B. et al. HMGB1-mediated autophagy promotes docetaxel resistance in human lung adenocarcinoma. Mol. Cancer 13, 165 (2014).
Pusterla, T., de Marchis, F., Palumbo, R. & Bianchi, M. E. High mobility group B2 is secreted by myeloid cells and has mitogenic and chemoattractant activities similar to high mobility group B1. Autoimmunity 42, 308–310 (2009).
Neubert, E. N. et al. HMGB2 regulates the differentiation and stemness of exhausted CD8(+) T cells during chronic viral infection and cancer. Nat. Commun. 14, 5631 (2023).
Ronfani, L. et al. Reduced fertility and spermatogenesis defects in mice lacking chromosomal protein Hmgb2. Development 128, 1265–1273 (2001).
Abraham, A. B. et al. Members of the high mobility group B protein family are dynamically expressed in embryonic neural stem cells. Proteome Sci. 11, 18 (2013).
Benavides Damm, T. & Egli, M. Calcium’s role in mechanotransduction during muscle development. Cell. Physiol. Biochem. 33, 249–272 (2014).
Davies, J. E., Apta, B. H. R. & Harper, M. T. Cross-reactivity of anti-HMGB1 antibodies for HMGB2. J. Immunol. Methods 456, 72–76 (2018).
Pirnie, R., Gillespie, K. P., Weng, L., Mesaros, C. & Blair, I. A. Characterization and quantification of oxidized high mobility group box 1 proteoforms secreted from hepatocytes by toxic levels of acetaminophen. Chem. Res. Toxicol. 35, 1893–1902 (2022).
Gargantilla, M. et al. Inhibition of XPO-1 mediated nuclear export through the michael-acceptor character of chalcones. Pharmaceuticals https://doi.org/10.3390/ph14111131 (2021).
Landes, J. R. et al. The efficacy of selinexor (KPT-330), an XPO1 inhibitor, on non-hematologic cancers: a comprehensive review. J. Cancer Res. Clin. Oncol. 149, 2139–2155 (2023).
Azmi, A. S. et al. Targeting the nuclear export protein XPO1/CRM1 reverses epithelial to mesenchymal transition. Sci. Rep. 5, 16077 (2015).
Nair, J. S., Musi, E. & Schwartz, G. K. Selinexor (KPT-330) induces tumor suppression through nuclear sequestration of IkappaB and downregulation of survivin. Clin. Cancer Res. 23, 4301–4311 (2017).
Azmi, A. S. et al. Exportin 1 (XPO1) inhibition leads to restoration of tumor suppressor miR-145 and consequent suppression of pancreatic cancer cell proliferation and migration. Oncotarget 8, 82144–82155 (2017).
Wang, A. Y. & Liu, H. The past, present, and future of CRM1/XPO1 inhibitors. Stem Cell Investig. 6, 6 (2019).
Azizian, N. G. & Li, Y. XPO1-dependent nuclear export as a target for cancer therapy. J. Hematol. Oncol. 13, 61 (2020).
Kim, E., Mordovkina, D. A. & Sorokin, A. Targeting XPO1-dependent nuclear export in cancer. Biochemistry 87, S178–S191 (2022).
Kroemer, G., Galassi, C., Zitvogel, L. & Galluzzi, L. Immunogenic cell stress and death. Nat. Immunol. 23, 487–500 (2022).
Sprooten, J. et al. Trial watch: chemotherapy-induced immunogenic cell death in oncology. Oncoimmunology 12, 2219591 (2023).
Robinson, C. & Bolhuis, A. Protein targeting by the twin-arginine translocation pathway. Nat. Rev. Mol. Cell Biol. 2, 350–356 (2001).
Wang, Y., Fan, S., Zhong, W., Zhou, X. & Li, S. Development and properties of valine-alanine based antibody-drug conjugates with monomethyl auristatin E as the potent payload. Int. J. Mol. Sci. https://doi.org/10.3390/ijms18091860 (2017).
Liang, W. J., Yang, H. W., Liu, H. N., Qian, W. & Chen, X. L. HMGB1 upregulates NF-kB by inhibiting IKB-alpha and associates with diabetic retinopathy. Life Sci. 241, 117146 (2020).
Wu, H. et al. HMGB2 deficiency mitigates abdominal aortic aneurysm by suppressing Ang-II-caused ferroptosis and inflammation via NF-kappabeta pathway. Mediators Inflamm. 2023, 2157355 (2023).
Casper, E. The crosstalk between Nrf2 and NF-kappaB pathways in coronary artery disease: can it be regulated by SIRT6? Life Sci. 330, 122007 (2023).
Xiang, Y., Song, X. & Long, D. Ferroptosis regulation through Nrf2 and implications for neurodegenerative diseases. Arch. Toxicol. 98, 579–615 (2024).
Lin, X., Ping, J., Wen, Y. & Wu, Y. The mechanism of ferroptosis and applications in tumor treatment. Front. Pharmacol. 11, 1061 (2020).
Wang, M. et al. Protective effect of FXN overexpression on ferroptosis in L-Glu-induced SH-SY5Y cells. Acta Histochem. 126, 152135 (2024).
Huang, Y. et al. Nrf2 inhibition increases sensitivity to chemotherapy of colorectal cancer by promoting ferroptosis and pyroptosis. Sci. Rep. 13, 14359 (2023).
Scarpellini, C. et al. Beyond ferrostatin-1: a comprehensive review of ferroptosis inhibitors. Trends Pharmacol. Sci. 44, 902–916 (2023).
Oparka, M. et al. Quantifying ROS levels using CM-H(2)DCFDA and HyPer. Methods 109, 3–11 (2016).
Dai, Z., Zhang, W., Zhou, L. & Huang, J. Probing lipid peroxidation in ferroptosis: emphasizing the utilization of C11-BODIPY-based protocols. Methods Mol. Biol. 2712, 61–72 (2023).
Li, S. et al. RSL3 drives ferroptosis through NF-kappaB pathway activation and GPX4 depletion in glioblastoma. Oxid. Med. Cell. Longev. 2021, 2915019 (2021).
Yang, C., Zhang, Y., Lin, S., Liu, Y. & Li, W. Suppressing the KIF20A/NUAK1/Nrf2/GPX4 signaling pathway induces ferroptosis and enhances the sensitivity of colorectal cancer to oxaliplatin. Aging 13, 13515–13534 (2021).
Al-Otaibi, W. A. & AlMotwaa, S. M. Oxaliplatin-loaded nanoemulsion containing Teucrium polium L. essential oil induces apoptosis in colon cancer cell lines through ROS-mediated pathway. Drug Deliv. 29, 2190–2205 (2022).
He, Y. et al. Butyrate reverses ferroptosis resistance in colorectal cancer by inducing c-Fos-dependent xCT suppression. Redox Biol. 65, 102822 (2023).
Liu, X. et al. FOXA2 suppression by TRIM36 exerts anti-tumor role in colorectal cancer via inducing NRF2/GPX4-regulated ferroptosis. Adv. Sci. 10, e2304521 (2023).
William-Faltaos, S., Rouillard, D., Lechat, P. & Bastian, G. Cell cycle arrest and apoptosis induced by oxaliplatin (L-OHP) on four human cancer cell lines. Anticancer Res. 26, 2093–2099 (2006).
Tesniere, A. et al. Molecular characteristics of immunogenic cancer cell death. Cell Death Differ. 15, 3–12 (2008).
Park, J. S. et al. High mobility group box 1 protein interacts with multiple Toll-like receptors. Am. J. Physiol. Cell Physiol. 290, C917–C924 (2006).
Yu, M. et al. HMGB1 signals through toll-like receptor (TLR) 4 and TLR2. Shock 26, 174–179 (2006).
Tian, J. et al. Toll-like receptor 9-dependent activation by DNA-containing immune complexes is mediated by HMGB1 and RAGE. Nat. Immunol. 8, 487–496 (2007).
Hori, O. et al. The receptor for advanced glycation end products (RAGE) is a cellular binding site for amphoterin. Mediation of neurite outgrowth and co-expression of rage and amphoterin in the developing nervous system. J. Biol. Chem. 270, 25752–25761 (1995).
Watanabe, H. & Son, M. The immune tolerance role of the HMGB1-RAGE Axis. Cells https://doi.org/10.3390/cells10030564 (2021).
Ren, W., Zhao, L., Sun, Y., Wang, X. & Shi, X. HMGB1 and Toll-like receptors: potential therapeutic targets in autoimmune diseases. Mol. Med. 29, 117 (2023).
Tang, D., Kang, R., Zeh, H. J. & Lotze, M. T. The multifunctional protein HMGB1: 50 years of discovery. Nat. Rev. Immunol. 23, 824–841 (2023).
Liu, Z. H. et al. Association of serum HMGB2 level with MACE at 1 mo of myocardial infarction: aggravation of myocardial ischemic injury in rats by HMGB2 via ROS. Am. J. Physiol. Heart Circ. Physiol. 312, H422–H436 (2017).
Zitvogel, L. et al. Immunogenic tumor cell death for optimal anticancer therapy: the calreticulin exposure pathway. Clin. Cancer Res. 16, 3100–3104 (2010).
Martins, I. et al. Restoration of the immunogenicity of cisplatin-induced cancer cell death by endoplasmic reticulum stress. Oncogene 30, 1147–1158 (2011).
Sen, S., Karoscik, K., Maier, E. & Arambula, J. F. Immunogenic cell death-inducing metal complexes: from the benchtop to the clinic. Curr. Opin. Chem. Biol. 73, 102277 (2023).
Matsusaka, K. et al. Distinct roles in phagocytosis of the early and late increases of cell surface calreticulin induced by oxaliplatin. Biochem. Biophys. Rep. 29, 101222 (2022).
O’Dowd, D., Sutcliffe, D. F. & Griffith, D. M. Oxaliplatin and its derivatives – an overview. Coord. Chem. Rev. 497, 215–439 (2023).
Zhai, J. et al. Chemotherapeutic and targeted drugs-induced immunogenic cell death in cancer models and antitumor therapy: an update review. Front. Pharmacol. 14, 1152934 (2023).
Chen, R., Kang, R. & Tang, D. The mechanism of HMGB1 secretion and release. Exp. Mol. Med. 54, 91–102 (2022).
Bian, B. et al. Cathepsin B promotes colorectal tumorigenesis, cell invasion, and metastasis. Mol. Carcinog. 55, 671–687 (2016).
Siwach, K. et al. 1,2,3-Triazole-based esters and carboxylic acids as nonclassical carbonic anhydrase inhibitors capable of cathepsin B inhibition. Arch. Pharm. 357, e2300372 (2023).
Gourdier, I., Crabbe, L., Andreau, K., Pau, B. & Kroemer, G. Oxaliplatin-induced mitochondrial apoptotic response of colon carcinoma cells does not require nuclear DNA. Oncogene 23, 7449–7457 (2004).
Hadian, K. & Stockwell, B. R. The therapeutic potential of targeting regulated non-apoptotic cell death. Nat. Rev. Drug Discov. 22, 723–742 (2023).
Chen, X., Comish, P. B., Tang, D. & Kang, R. Characteristics and biomarkers of ferroptosis. Front. Cell Dev. Biol. 9, 637162 (2021).
Stockwell, B. R. Ferroptosis turns 10: emerging mechanisms, physiological functions, and therapeutic applications. Cell 185, 2401–2421 (2022).
Hu, P. et al. The mechanism of the imbalance between proliferation and ferroptosis in pulmonary artery smooth muscle cells based on the activation of SLC7A11. Eur. J. Pharmacol. 928, 175093 (2022).
Cotticelli, M. G. et al. Ferroptosis as a novel therapeutic target for Friedreich’s Ataxia. J. Pharmacol. Exp. Ther. 369, 47–54 (2019).
Koutsodendris, N. et al. APOE4-promoted gliosis and degeneration in tauopathy are ameliorated by pharmacological inhibition of HMGB1 release. Cell Rep. 42, 113252 (2023).
Liu, P. et al. PD-1 blockade synergizes with oxaliplatin-based, but not cisplatin-based, chemotherapy of gastric cancer. Oncoimmunology 11, 2093518 (2022).
Bezu, L., Kepp, O. & Kroemer, G. Immunogenic chemotherapy sensitizes RAS-mutated colorectal cancers to immune checkpoint inhibitors. Oncoimmunology 12, 2272352 (2023).
Schroeder, A. B. et al. The ImageJ ecosystem: open-source software for image visualization, processing, and analysis. Protein Sci. 30, 234–249 (2021).
MacLean, B. et al. Skyline: an open source document editor for creating and analyzing targeted proteomics experiments. Bioinformatics 26, 966–968 (2010).
Acknowledgements
We thank Drs. Kevin Horgan and Qingqing Wang for useful discussions and acknowledge the financial support of the Friedreich’s Ataxia Research Alliance and the National Institute for Environmental Health Sciences P30ES013508.
Author information
Authors and Affiliations
Contributions
I.A.B. and C.M. designed the study and experiments, J.F. conducted the cell-based experiments, J.F. and K.P.G. conducted the mass spectrometry analyses J.F., K.P.G., and I.A.B. performed the data analysis. I.A.B. and C.M. wrote the manuscript. All authors discussed the results, read the manuscript, and made revisions.
Corresponding author
Ethics declarations
Competing interests
I.A.B. has sponsored research agreements with Lexeo Therapeutics and Design Therapeutics. A provisional patent is pending for CT-HMGB2 and its analogs.
Peer review
Peer review information
Communications Biology thanks Maxime Cahuzac, Divya Venkatesh, and the other, anonymous, reviewer(s) for their contribution to the peer review of this work. Primary Handling Editors: Kaliya Georgieva.
Additional information
Publisher’s note Springer Nature remains neutral with regard to jurisdictional claims in published maps and institutional affiliations.
Rights and permissions
Open Access This article is licensed under a Creative Commons Attribution-NonCommercial-NoDerivatives 4.0 International License, which permits any non-commercial use, sharing, distribution and reproduction in any medium or format, as long as you give appropriate credit to the original author(s) and the source, provide a link to the Creative Commons licence, and indicate if you modified the licensed material. You do not have permission under this licence to share adapted material derived from this article or parts of it. The images or other third party material in this article are included in the article’s Creative Commons licence, unless indicated otherwise in a credit line to the material. If material is not included in the article’s Creative Commons licence and your intended use is not permitted by statutory regulation or exceeds the permitted use, you will need to obtain permission directly from the copyright holder. To view a copy of this licence, visit http://creativecommons.org/licenses/by-nc-nd/4.0/.
About this article

Cite this article
Fan, J., Gillespie, K.P., Mesaros, C. et al. HMGB2-induced calreticulin translocation required for immunogenic cell death and ferroptosis of cancer cells are controlled by the nuclear exporter XPO1. Commun Biol 7, 1234 (2024). https://doi.org/10.1038/s42003-024-06930-y
Received:
Accepted:
Published:
Version of record:
DOI: https://doi.org/10.1038/s42003-024-06930-y

