
Abstract
The alignment of clay minerals in sediments is of high importance for their mechanical and physical properties. The development of this alignment starts with the deposition of clay, its strength is measured by the crystallographic preferred orientation. So far, the early stages of sedimentation have been restricted to post-mortem observations. Here we present particle settling experiments in four dimensions (time and orientation, as a function of overburden and composition) observed in situ using synchrotron diffraction, in which kaolinite and kaolinite-illite mixtures were sedimented in water columns. The alignment strength in freshly settled sediments increases with overburden, but is higher in deionized water than in seawater. Alignment strength increases within the first few millimetres of overburden and stagnates afterwards. With illite added, the resulting alignment strength is substantially decreased. Our results demonstrate that electrostatic interactions between particles are overcome by gravitational forces already within the upper millimetres of sediment.
Introduction
Clay is an important constituent of the Earth’s surface and the uppermost crust (~24 vol.-%)1 occurring widespread in terrestrial as well as marine sediments. As geomaterials, clay-rich rocks are necessary for addressing major societal problems: they represent a potential repository or sealing material for nuclear waste2,3, they are crucial for the extraction of geothermal energy4 and in carbon capture and storage5. In the marine environment, clay-rich sediments are an important factor for slope stability and tsunami hazard due to mass movement and faulting6,7. Due to difficulties in sample preparation8,9 and scale dependence10, neither the microscale structure of clay-rich sediments nor the particle alignment during clastic sedimentation in water are well-understood, despite their important role in many geologic and engineering problems.
Clay minerals are phyllosilicates with high aspect ratio, small particle size and a charged particle surface. These properties steer particle interactions which lead to the development of characteristic microstructures11,12. A proper alignment of particles leads to the development of a pronounced planar anisotropy13. As a result, clay-rich rocks often exhibit fissility and a low permeability perpendicular to this strong planar fabric. Different states of alignment can be described by a general reference function for clay particle alignment14 but any progressive development of this anisotropy remains unclear.
The development of this anisotropy during clastic subaqueous sedimentation starts with the settling of particles on a surface. The alignment of clay minerals can be distinguished in four main steps: (i) sinking and interaction within the fluid column, (ii) settling at the sediment surface, (iii) consolidation by subsequent particle loading, (iv) disruption by dewatering during increasing overburden. Within these processes, shape and grain size of the individual clay platelets and aggregates as well as the physicochemical properties of the fluid affecting the crystal surface15,16 control the development of a crystallographic preferred orientation (CPO).
In principle the strength of a CPO in any polycrystalline material results from the interplay of processes promoting crystal alignment and the resistance to this alignment, e.g., in the case of clay, inhibition of mechanical rotation due to geometric confinement or surface charge repulsion. The structure of clay particles/aggregates, either suspended or settled, has been suggested to be a major factor of CPO development17. The high aspect ratio of clay minerals results from the strong correspondence of shape and crystal structure defined by interconnected tetrahedral (T) and octahedral (O) layers. These layers can be stacked in variable ways forming different clay mineral types, e.g., TO: tetrahedral layer, octahedral layer (1:1) like kaolinite, or TOT: tetrahedral, octahedral, tetrahedral layer (2:1) like illite. Hence, different clay mineral structures and compositions lead to different sorts of bonding between layers. Kaolinite layers are connected by hydrogen bonds while illite layer bonding is due to the coordination of K+.
Clay minerals can occur as either single layers or stacks of layers, so-called tactoids18, which can be arranged into larger polycrystalline aggregates, either unordered or with frequent (00 l) contacts (Fig. 1). The length of a kaolinite platelet ranges from 200 nm to >1000 nm with a height of 10–200 stacked layers19,20. Illite, in contrast, is smaller, with a platelet length of 50–100 nm and tactoid height of 5–20 layers20,21. Contacts within unordered aggregates and aligned aggregates can be described as combinations of crystal edge (‘E’) and face (‘F’) contacts. Dominant FF-contacts have been referred to as ‘stacked platelet’ configuration11, while dominant EF-contacts form ‘house of cards’ structures22.

Interactions between edges and faces of neighbouring crystals are controlled by the surface charges and the electric double layers developed in an aqueous environment. Edges and octahedral-face charges in kaolinite for example, change with pH, because the aluminol groups change their amphoteric behaviour15,16,23. Increasing salinity diminishes the size of the outer part of the electric double layer and hence also shifts the amphoteric point24. This decreases the distance between single platelets and should therefore favour alignment. Illite tetrahedral faces are considered to have a negative charge25 at pH > 5. Hence, particle orientation in an aggregate is governed by electrostatic interactions and depends on fluid chemistry26,27.
The relation between the morphology of a single layer with its crystal structure and resulting electrostatic interactions and the combination into tactoids and aggregates are the main reasons which can be beneficial for a strong (00 l)-CPO (Fig. 1). While unordered aggregates are supposed to have higher numbers of edge-edge and edge-face contacts, progressive sedimentation and related compaction of the material will force these to collapse to some degree resulting in more face-to-face type contacts of aligned crystals. In addition to the electrostatic inter-particle processes, which act on the aggregate scale, gravitational forces causing compaction in combination with increased overburden once clay is embedded in a sediment surface. Accordingly, clay alignment changes during settling and incorporation of clay particle within the sediment surface.
In order to gain a better understanding of the above mechanisms of clay particle alignment during the initial stages of sedimentation, we performed a series of in situ synchrotron X-ray diffraction (XRD) experiments during clay sedimentation in water. Our approach is to measure the CPO at a sub-millimetre resolution at different stages during sedimentation experiments. We use kaolinite in deionized and seawater, as well as 70/30 wt% mixtures of kaolinite and illite in seawater. Kaolinite was chosen as a 1:1 sheet silicate and illite as a 2:1 sheet silicate, which are both very common, non-swelling sediment components. In order to keep the experimental setup as simple as possible, swelling clays were dismissed. Seawater salinity was chosen to simulate natural conditions. Both clay minerals have similar particle sizes.
During in situ diffraction experiments a clay slurry was added to the water column (Fig. 2) and resulting 2D diffraction patterns were used to compute the CPO. The alignment strength is given in volume % of crystallites with (00 l) oriented within a spherical region of 15° around the distribution maximum (%CVol). The CPOs were measured at regular time intervals at different heights in the column. For experimental details, see Table 1.

a Sketch of sedimentation column; (b) sedimentation column mounted in experimental hutch at ESRF ID22; (c) final sediment sample after experiment, crack resulted from column unmounting; (d) single 2D diffraction image with (00 l) diffraction rings of kaolinite indicated.
Our experiments show that the CPO strength increases most rapidly within the first few millimetres of overburden and stagnates afterwards with only minor changes. In freshly settled sediments the CPO strength is higher in deionized water than in seawater. When illite is added, the CPO strength is substantially decreased.
Results
In all experiments a CPO developed with a unimodal, rotationally symmetric (00 l)-maximum normal to the sediment surface. Below, individual experimental results are described:
-
a.
Kaolinite in deionized water – one-time addition of sediment (kao-Dw-S)
Measurements were conducted 1 mm above the initial sediment surface every ~7 min. A strong fluctuation of the CPO strength is observed with time (Fig. 3a) that is not caused by external perturbations. In irregular time steps the strength drops and increases again. The volume percentage of aligned particles varies between 3.7 and 6.1% CVol.
Fig. 3: Experimental results. 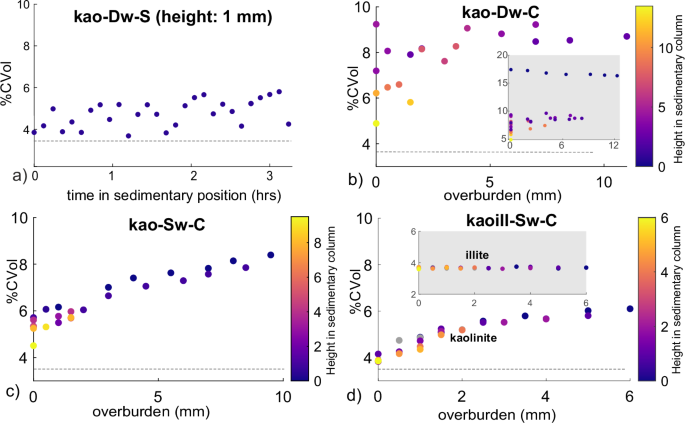
Kaolinite (00 l) pole figure strength measured during the sedimentation experiments represented as volume percentage (%CVol) of diffracting particles in 15° region. Dashed line indicates uniform distribution. Higher overburden is only achieved after longer experimental time and has hence less measurement points. a Kaolinite in deionized water – one time addition of sediment (kao-Dw-S); (b) kaolinite in deionized water – continuous addition of sediment (kao-Dw-C) CPO strength as a function of overburden, inset: full data set including measurements directly above plastic surface (see text); (c) kaolinite in seawater – continuous addition of sediment (kao-Sw-C) vs. overburden; (d) kaolinite and illite in seawater – continuous addition of sediment (kaoill-Sw-C) vs. overburden.
-
b.
Kaolinite in deionized water – continuous addition of sediment (kao-Dw-C)
The CPO strength varies with overburden and measurement position over a large range from 4.8 to 17.4% CVol (Fig. 3b). The first and therefore lowermost sedimented positions (inset in Fig. 3b) have a stronger CPO ( >17% CVol), clearly distinguishable from later measured positions. This is considered an experimental artefact due to a smooth settling surface, which was avoided in all other experiments. Measurements in the upper part of the column show a lower CPO strength, starting from 4.8 to 9.3% CVol while a steady state strength of ~8.7% CVol is achieved after ~5 mm overburden.
-
c.
Kaolinite in seawater – continuous addition of sediment (kao-Sw-C)
The CPO strength varies between 4.5 and 6.1% CVol in the first measurement of a given position, and increases with increasing overburden (Fig. 3c) towards >8% CVol at the end of the experiment.
-
d.
Kaolinite and illite in seawater – continuous addition of sediment (kaoill-Sw-C)

In this experiment, the initial CPO strength varies between 3.6 and 4% CVol (Fig. 3d). During the experiment the CPO strength then increases to 6.1% CVol in the lowermost layer. The CPO first increases rapidly up to 3 mm overburden and then gradually flattens out. The CPO strength of illite in contrast (inset in Fig. 3d) remains being uniform throughout the experiment.
The experiments with continuous sediment addition have in common that CPO strength increases more strongly within the first 2 mm overburden. Subsequently, CPO strength increases less or eventually stagnates. Sediment introduced at later time steps of the experiment shows an increasingly weaker CPO strength at the sediment surface.
Discussion
In general, the CPO strength is higher in deionized water than in seawater. Potential explanations are the state of aggregation or intra-aggregate alignment. Kaolinite tends to be more dispersed in deionized water than in ionised water at comparable pH-value26. Hence, individual crystals in deionized water are can rotate more freely during settling and therefore favour an initially higher preferred alignment. In contrast, crystals within polycrystalline aggregates in ionised water show a higher degree of bulk sample alignment compared to deionized water28. While both findings seem contradictory, our data suggests that particle dispersion has a higher impact on CPO formation than the internal ordering of aggregates.
Even though in experiment a) (kao-Dw-S) sediment was added only once, a periodic fluctuation of the CPO strength in non-regular time steps is observed. This fluctuation may indicate a process which periodically destroys the crystal alignment during sedimentation and settling. A plausible process would be dewatering of the sediment along discrete channels or structures sufficiently large to cause an overall perturbation and reduction in CPO strength. Dewatering is followed by back rotation of crystallites with (00 l) parallel to the surface under gravitational forces. This interpretation of periodic dewatering is in accordance with the need of an increasingly larger fluid patch in order to escape an increasingly stronger sediment, comparable to observations of periodically rising bubbles or fluid patches29.
In seawater, CPO strength of kaolinite is generally lower compared to CPO strength in deionized water. The CPO strength increases nonlinearly with overburden. The highest increase in crystal alignment is observed in the first ~2 mm from the sediment surface with the increase of CPO strength ceasing with any further overburden. The electric double layer of kaolinite should be more compressed in seawater due to higher ionic strength, which would usually promote a stronger alignment at aggregate scale. While this has been observed within the water column23, the experiments presented here suggest that additional processes such as settling dynamics and compaction considerably affect the final CPO in the sediment. Hence, gravity and already minimal overburden have the potential to compete with electrochemical processes, i.e., larger, sufficiently fragile aggregates experience disintegration in the sediment surface leading to CPO strengthening.
The addition of illite results in an initially lower kaolinite CPO strength, which increases with increasing overburden at a much lower rate. The illite CPO strength is rather weak and remains nearly constant throughout the duration of the experiment, indicating that illite particles do not align. In contrast, they seem to be the reason why CPO strength is weaker in this experiment. Studies of pure illite suspensions show that the alignment is stronger at aggregate scale28 compared to kaolinite. The absence of any non-uniform CPO hence indicates that those illite-containing aggregates are more stable as they do not re-order as easily as pure kaolinite at the same amount of overburden. A potential explanation might be the different bonding energies: At the given seawater pH, aggregates of illite or aggregates including illite could be mechanically more stable than those of pure kaolinite and hence hamper the formation of a stronger particle alignment. A similar effect has been shown for montmorillonite, another TOT clay mineral, which has a lower viscosity with differently ionised solutions than kaolinite30. Alternatively, or in addition, illite tactoids may have lower aspect ratios than kaolinite tactoids as calculated from particle dimension19,20,21. Under the assumption that high aspect ratio tactoids also bear a stronger alignment of crystallites settling would result in an increased CPO strength.
The experiments indicate that most of the observed CPO development depends on processes within the fluid and sediment interface depending on state and structure of the settling material, fluid-solid interaction, dewatering and the sedimentation surface. In addition, a minor but non-negligible part of CPO strengthening happens at ‘higher’ overburden of several millimetres. The decrease in CPO strength corresponding to an approximately asymptotic trend (Fig. 3d) indicates instantaneous easy rearrangement and increasingly slow mechanical rotation with increasing total density. This finding may explain the strong decrease in porosity within only a few metres measured in shallow sediment drill cores31. Hence, constant sedimentation does not allow for constantly increasing CPO strength and the development of an arbitrarily strong CPO, unless major external triggers change the setting, for example, vibrations due to seismicity, surface rupture, slumping and submarine landslides, or a rapid change in sediment input and/or composition.
It was demonstrated31 that porosity reduction during progressive compaction happens by breaking and successive rotation of clay platelets in pores, which then can reduce the initial anisotropy. In combination with our findings this would suggest that the development of a CPO occurs within the very first millimetres of overburden, where free particle rotation is still possible. CPO strengthening between this point and the onset of dissolution processes is very restricted. This is consistent with experimentally compacted re-sedimented mudstones which only show a small increase in CPO with increasing load32.
Implications
The same sediment at the same burial depth, deposited in different water environments will have different alignment strengths. The CPO strength of clay minerals controls important physical and chemical properties of rocks and geomaterials, e.g., diffusion33,34,35 or thermal expansion36, which is especially important for shales as a host rock for nuclear waste repositories. Variations in sedimentary input or of fluid salinity are able to change mechanical properties. For example, intercalated layers with different CPO strength affected by thermal expansion are more prone to fracturing. This is especially relevant in settings with low sedimentation rates.
The anisotropy development is important for any sediment surface sealing or disruption process at variable scales ranging from dewatering and hence porosity, mud volcanism, or bioturbation. It is also critical for continental slope stability, e.g., by facilitating or amplifying potentially tsunamigenic submarine mass movements.
Conclusion
In situ synchrotron sedimentation experiments show that CPO strength of settling kaolinite and kaolinite + illite depends on particle interactions within the water column as well as the initial sedimentation processes. With respect to CPO evolution, it is demonstrated that the clay mineral species as well as the particular structure of the settling material are the dominating parameters. The final CPO is a function of the initial CPO established within ~2 mm of the sediment surface. The initial CPO is a function of the parameters salinity, pH and mineral species. We demonstrate in the case of kaolinite, that those effects require only minor overburden while a largely constant CPO is attained at ~10 mm sediment depth. Electrochemical processes which govern particle interactions in the water column influence the particle alignment during sedimentation but can be overcome by gravity and overburden in the first few millimetres and hence lead to a different clay microstructure in the water column compared to the sediment.
The observed CPO development controls the physical and chemical properties of clays, muds, claystones and shales as well as artificially sedimented clay materials that may be crucial for technical applications, but also for geological processes and natural hazards. Here we demonstrate that compaction and dewatering driven by gravitational forces govern clay alignment in the sediment surface whereas a compressed double layer or electrochemical forces seem to be negligible.
Methods
Characterisation of the starting material
For our experimental setup we used two very important clay minerals: (i) kaolinite (general formula Al2[Si2O5/(OH)4]), with a low-layer charge and therefore inducing less interaction between particles, and (ii) illite (general formula (K,H3O)Al2[(Si3Al)O10/(H2O,OH)2]), with a higher layer charge and hence a higher interaction potential. The kaolinite powder is ‘Poraver’ technical bentonite and consists of ~90% kaolinite, 2–3% illite/muscovite as well as other non-clay particles as determined by powder XRD. The illite powder (Argile Verte Facial Clay by Cattier Paris) consists of 75% illite, ~15% kaolinite as well as other components including minor smectite. Both powders were used in the above mentioned composition. The particle size distributions of the two powders display a volume-weighted mode of 4.2 µm for kaolinite and 5.5 µm for illite, both with a comparable right-skewed distribution measured in deionized water using a laser particle sizer Mastersizer3000 by Malvern Panalytical. As the instrument cannot determine and hence cannot incorporate grain shapes during particle measurement, we do not use the absolute particle size values but simply as a qualitative measure that the particle sizes of the powders were comparable prior to the experiments.
Two different fluids were used: (i) deionized water (pH ~ 6.5) and (ii) water with ion concentrations comparable to seawater – produced by adding aquarium sea salt (Tropic Marin Classic) to deionized water (pH ~ 9.5). The ionic composition of the seawater was measured with a Metrohm chromatograph and can be found in Table 2.
Detailed experimental setup
In-situ sedimentation experiments were performed at beamline ID22 at the European Synchrotron Radiation Facility (ESRF)37. Acrylic sedimentation tubes with a diameter of 30 mm were filled with water to an initial water column height of 30 cm (Fig. 2a) at room temperature. 10 ml of clay-water suspension containing ~0.25 g clay each, were added repeatedly in regular intervals (90 min to 120 min) for 12 h at the top of the column (Fig. 2b). The settling time and intervals depend on slurry density and addition method and were experimentally determined prior to the synchrotron experiments. CPO was measured at different heights above zero sedimentation level (z0) at regular intervals. Beam energy was set to 70 keV with a beam size of 0.5 mm height and 1 mm width and a sample-detector distance of 1390 mm. Two-dimension (2D) diffraction images summed from 40 frames each with 0.27 s exposure time were recorded on a Perkin Elmer 2D detector. Six images at a given height were acquired at positions rotated 30° around the vertical axis in order to cover a sufficiently large orientation space. Column rotation was performed using a slow motor in order to avoid disturbance of the sediment structure due to movement.
Experimental details can be found in Table 1. The bottom of the column was pre-sedimented with the same material as was added later, except for the first experiment with continuous addition of kaolinite in deionized water (kao-Dw-C), (Fig. 2c).
Data analysis
Spherical probability density functions (“pole figures”) are derived from series of 2D detector images. The 2D diffraction images (Fig. 2d) were corrected for background and detector artefacts. Single peak fitting was used to write integral intensity data from individual Debye-Scherrer rings of (00 l) lattice planes to pole figures using the Matlab toolbox MTEX38. An annular region with a mean radius of 2 θ for a given d-spacing on each image corresponds to small circles on a sphere with an opening angle of 180° − 4*θ. Between images the sample is rotated by 30° around the vertical axis and hence each image adds a new small circle with the same rotation to the pole figure.
The intensity at each point on a small circle is derived by parametric integration of a Lorentz function fitted to the intensity distribution of an annular segment. The azimuthal values inside the annular region are averaged across 6°-intervals. Density distributions are derived by spherical harmonic approximation and normalised such that the function mean equals 1. The script to perform pole figure extraction from 2D detector images can be found at https://github.com/kilir/synctexnalize.
The CPO strength is expressed as volume percentage of crystallites (% CVol) within a spherical region with a radius of 15°, centred at the pole figure maximum, derived from the continuous pole figure density function. A volume of 10% (10% CVol) means that 10% of the measured volume of clay crystallites are oriented such that poles to (00 l) fall within the given region. For a uniform distribution, the chosen region will hold 3.4%.
Reporting summary
Further information on research design is available in the Nature Portfolio Reporting Summary linked to this article.
Data availability
Data is available at https://doi.org/10.15151/ESRF-ES-962081752.
References
Amiotte Suchet, P., Probst, J.-L. & Ludwig, W. Worldwide distribution of continental rock lithology: implications for the atmospheric/soil CO2 uptake by continental weathering and alkalinity river transport to the oceans. Glob. Biogeochem. Cycles 17, 1038 (2003).
Madsen, F. T. Clay mineralogical investigations related to nuclear waste disposal. Clay Miner. 33, 109–129 (1998).
Delage, P., Cui, Y. J. & Tang, A. M. Clays in radioactive waste disposal. J. Rock Mech. Geotech. Eng. 2, 111–123 (2010).
De Silva, G. P. D., Ranjith, P. G., Perera, M. S. A. & Chen, B. Effect of bedding planes, their orientation and clay depositions on effective re-injection of produced brine into clay rich deep sandstone formations: implications for deep earth energy extraction. Appl. Energy 161, 24–40 (2016).
Bourg, I. C. Sealing shales versus brittle shales: a sharp threshold in the material properties and energy technology uses of fine-grained sedimentary rocks. Environ. Sci. Technol. Lett. 2, 255–259 (2015).
Stipp, M. et al. Strong sediments at the deformation front, and weak sediments at the rear of the Nankai accretionary prism, revealed by triaxial deformation experiments. Geochem. Geophys. Geosyst. 14, 4791–4810 (2013).
Kopf, A. J. et al. Soft sediment deformation in the shallow submarine slope off nice (France) as a result of a variably charged pliocene aquifer and mass wasting processes. Sed. Geol. 344, 290–309 (2016).
Di Remigio, G., Rocchi, I. & Zania, V. Scanning electron microscopy and clay geomaterials: from sample preparation to fabric orientation quantification. Appl. Clay Sci. 214, 106249 (2021).
Deirieh, A. et al. Particle arrangements in clay slurries: the case against the honeycomb structure. Appl. Clay Sci. 152, 166–172 (2018).
Kaduri, M., Dor, M., Day-Stirrat, R. J. & Emmanuel, S. Scale dependence of textural alignment in shales quantified using electron microscopy. Mar. Pet. Geol. 122, 104707 (2020).
Jönsson, B., Labbez, C. & Cabane, B. Interaraction of nanometric clay platelets. Langmuir 24, 11406–11413 (2008).
Ebrahimi, D., Whittle, A. J. & Pellenq, R. J.-M. Mesoscale properties of clay aggregates from potential of mean force representation of interactions between nanoplatelets. J. Chem. Phys. 140, 154309 (2014).
Clark, B. R. Mechanical formation of preferred orientation in clays. Am. J. Sci. 269, 250–266 (1970).
Dabat, T. et al. A general orientation distribution function for clay-rich media. Nat. Commun. 10, 5456 (2019).
Gupta, V. & Miller, J. D. Surface force measurements at the basal planes of ordered kaolinite particles. J. Colloid Interface Sci. 344, 362–371 (2010).
Chorom, M. & Rengasamy, P. Dispersion and zeta potential of pure clays as related to net particle charge under varying pH, electrolyte concentration and cation type. Eur. J. Soil Sci. 46, 657–665 (1995).
Moon, C. F. & Hurst, C. W. Fabric of muds and shales: an overview. Geol. Soc. Lond. Spec. Publ. 15, 579–593 (1984).
Tournassat, C., Bizi, M., Braibant, G. & Crouzet, C. Influence of montmorillonite tactoid size on Na–Ca cation exchange reactions. J. Colloid Interface Sci. 364, 443–454 (2011).
Tournassat, C. & Steefel, C. I. Ionic transport in nano-porous clays with consideration of electrostatic effects. Rev. Mineral. Geochem. 80, 287–329 (2015).
Sayed Hassan, M., Villieras, F., Gaboriaud, F. & Razafitianamaharavo, A. AFM and low-pressure argon adsorption analysis of geometrical properties of phyllosilicates. J. Colloid Interface Sci. 296, 614–623 (2006).
Tournassat, C. & Steefel, C. I. Reactive transport modeling of coupled processes in nanoporous media. Rev. Mineral. Geochem. 85, 75–109 (2019).
Van Olphen, H. An Introduction To Clay Colloid Chemistry 2nd edn, (John Wiley & Sons, 1963).
Tombácz, E. & Szekeres, M. Surface charge heterogeneity of kaolinite in aqueous suspension in comparison with montmorillonite. Appl. Clay Sci. 34, 105–124 (2006).
Gupta, V., Hampton, M. A., Stokes, J. R., Nguyen, A. V. & Miller, J. D. Particle interactions in kaolinite suspensions and corresponding aggregate structures. J. Colloid Interface Sci. 359, 95–103 (2011).
Beene, G. M., Bryant, R. & Williams, D. J. Electrochemical properties of illites. J. Colloid Interface Sci. 147, 358–369 (1991).
Nasser, M. S. & James, A. E. Settling and sediment bed behaviour of kaolinite in aqueous media. Sep. Purif. Technol. 51, 10–17 (2006).
Zbik, M. S., Smart, R. S. & Morris, G. E. Kaolinite flocculation structure. J. Colloid Interface Sci. 328, 73–80 (2008).
Dor, M., Levi-Kalisman, Y. L., Day-Stirrat, R. J., Mishael, Y. & Emmanuel, S. Assembly of clay mineral platelets, tactoids, and aggregates: effect of mineral structure and solution salinity. J. Colloid Interface Sci. 566, 163–170 (2020).
Bons, P. D. & van Milligen, B. P. New experiment to model self-organized critical transport and accumulation of melt and hydrocarbons from their source rocks. Geology 29, 912–922 (2001).
Penner, D. & Lagaly, G. Influence of anions on the rheological properties of clay mineral dispersions. Appl. Clay Sci. 19, 131–142 (2001).
Lahiri, S., Milliken, K. L., Vrolijk, P., Desbois, G. & Urai, J. L. Mechanical compaction mechanisms in the input sediments of the Sumatra subduction complex – insights from IODP expedition 362. Solid Earth 13, 1513–1539 (2022).
Day-Stirrat, R. J. et al. Preferred orientation of phyllosilicates: effects of composition and stress on resedimented mudstone microfabrics. J. Struct. Geol. 33, 1347–1358 (2011).
Van Loon, L. R., Soler, J. M., Müller, W. & Bradbury, M. H. Anisotropic diffusion in layered argillaceous rocks: a case study with opalinus clay. Environ. Sci. Technol. 38, 5721–5728 (2004).
Dabat, T. et al. Influence of preferred orientation of clay particles on the diffusion of water in kaolinite porous media at constant porosity. Appl. Clay Sci. 184, 105354 (2020).
Ferrage, E. et al. Anisotropy in particle orientation controls water diffusion in clay materials. Appl. Clay Sci. 244, 107117 (2023).
Zhang, C.-L., Conil, N. & Armand, G. Thermal effects on clay rocks for deep disposal of high-level radioactive waste. J. Rock. Mech. Geotech. Eng. 9, 463–478 (2017).
Fitch, A. et al. ID22 – the high-resolution powder-diffraction beamline at ESRF. J. Synchrotron Rad. 30, 1003–1012 (2023).
Hielscher, R. & Schaeben, H. A novel pole figure inversion method: specification of the MTEX algorithm. J. Appl. Crystallogr. 41, 1024–1037, https://mtex-toolbox.github.io (2008).
Acknowledgements
We acknowledge the European Synchrotron Radiation Facility (ESRF) for provision of synchrotron radiation facilities under proposal number ES1195 and we would like to thank Andrew Fitch and Catherine Dejoie for assistance and support in using beamline ID22. The authors would like to thank Silke Kurze from the Geoecology group from MLU for ion chromatography. RKuehn highly appreciated discussions with Stefan Stöber from the mineralogy group of MLU Halle. The authors are very grateful for the comments of two anonymous reviewers, which strongly improved the manuscript.
Funding
Open Access funding enabled and organized by Projekt DEAL.
Author information
Authors and Affiliations
Contributions
Rebecca Kuehn did the conceptualisation and planning, experimental work, data analysis, lead writing and editing. Rüdiger Kilian did the planning, experimental work, data analysis method development, writing and editing. Dustin Lang did experimental work. Luiz Grafulha Morales and Michael Stipp did experimental work, writing and editing. Ola G. Grendal did the experimental work, provided data processing tools, writing and editing.
Corresponding author
Ethics declarations
Competing interests
The authors declare no competing interests.
Peer review
Peer review information
Communications Earth & Environment thanks the anonymous reviewers for their contribution to the peer review of this work. Primary Handling Editors: Olivier Sulpis and Carolina Ortiz Guerrero. A peer review file is available.
Additional information
Publisher’s note Springer Nature remains neutral with regard to jurisdictional claims in published maps and institutional affiliations.
Supplementary information
Rights and permissions
Open Access This article is licensed under a Creative Commons Attribution 4.0 International License, which permits use, sharing, adaptation, distribution and reproduction in any medium or format, as long as you give appropriate credit to the original author(s) and the source, provide a link to the Creative Commons licence, and indicate if changes were made. The images or other third party material in this article are included in the article’s Creative Commons licence, unless indicated otherwise in a credit line to the material. If material is not included in the article’s Creative Commons licence and your intended use is not permitted by statutory regulation or exceeds the permitted use, you will need to obtain permission directly from the copyright holder. To view a copy of this licence, visit http://creativecommons.org/licenses/by/4.0/.
About this article

Cite this article
Kuehn, R., Kilian, R., Lang, D. et al. Clay alignment takes place during early stages of sedimentation. Commun Earth Environ 5, 696 (2024). https://doi.org/10.1038/s43247-024-01866-x
Received:
Accepted:
Published:
Version of record:
DOI: https://doi.org/10.1038/s43247-024-01866-x
