
Fig. 1: Schematic overview of the study methods.
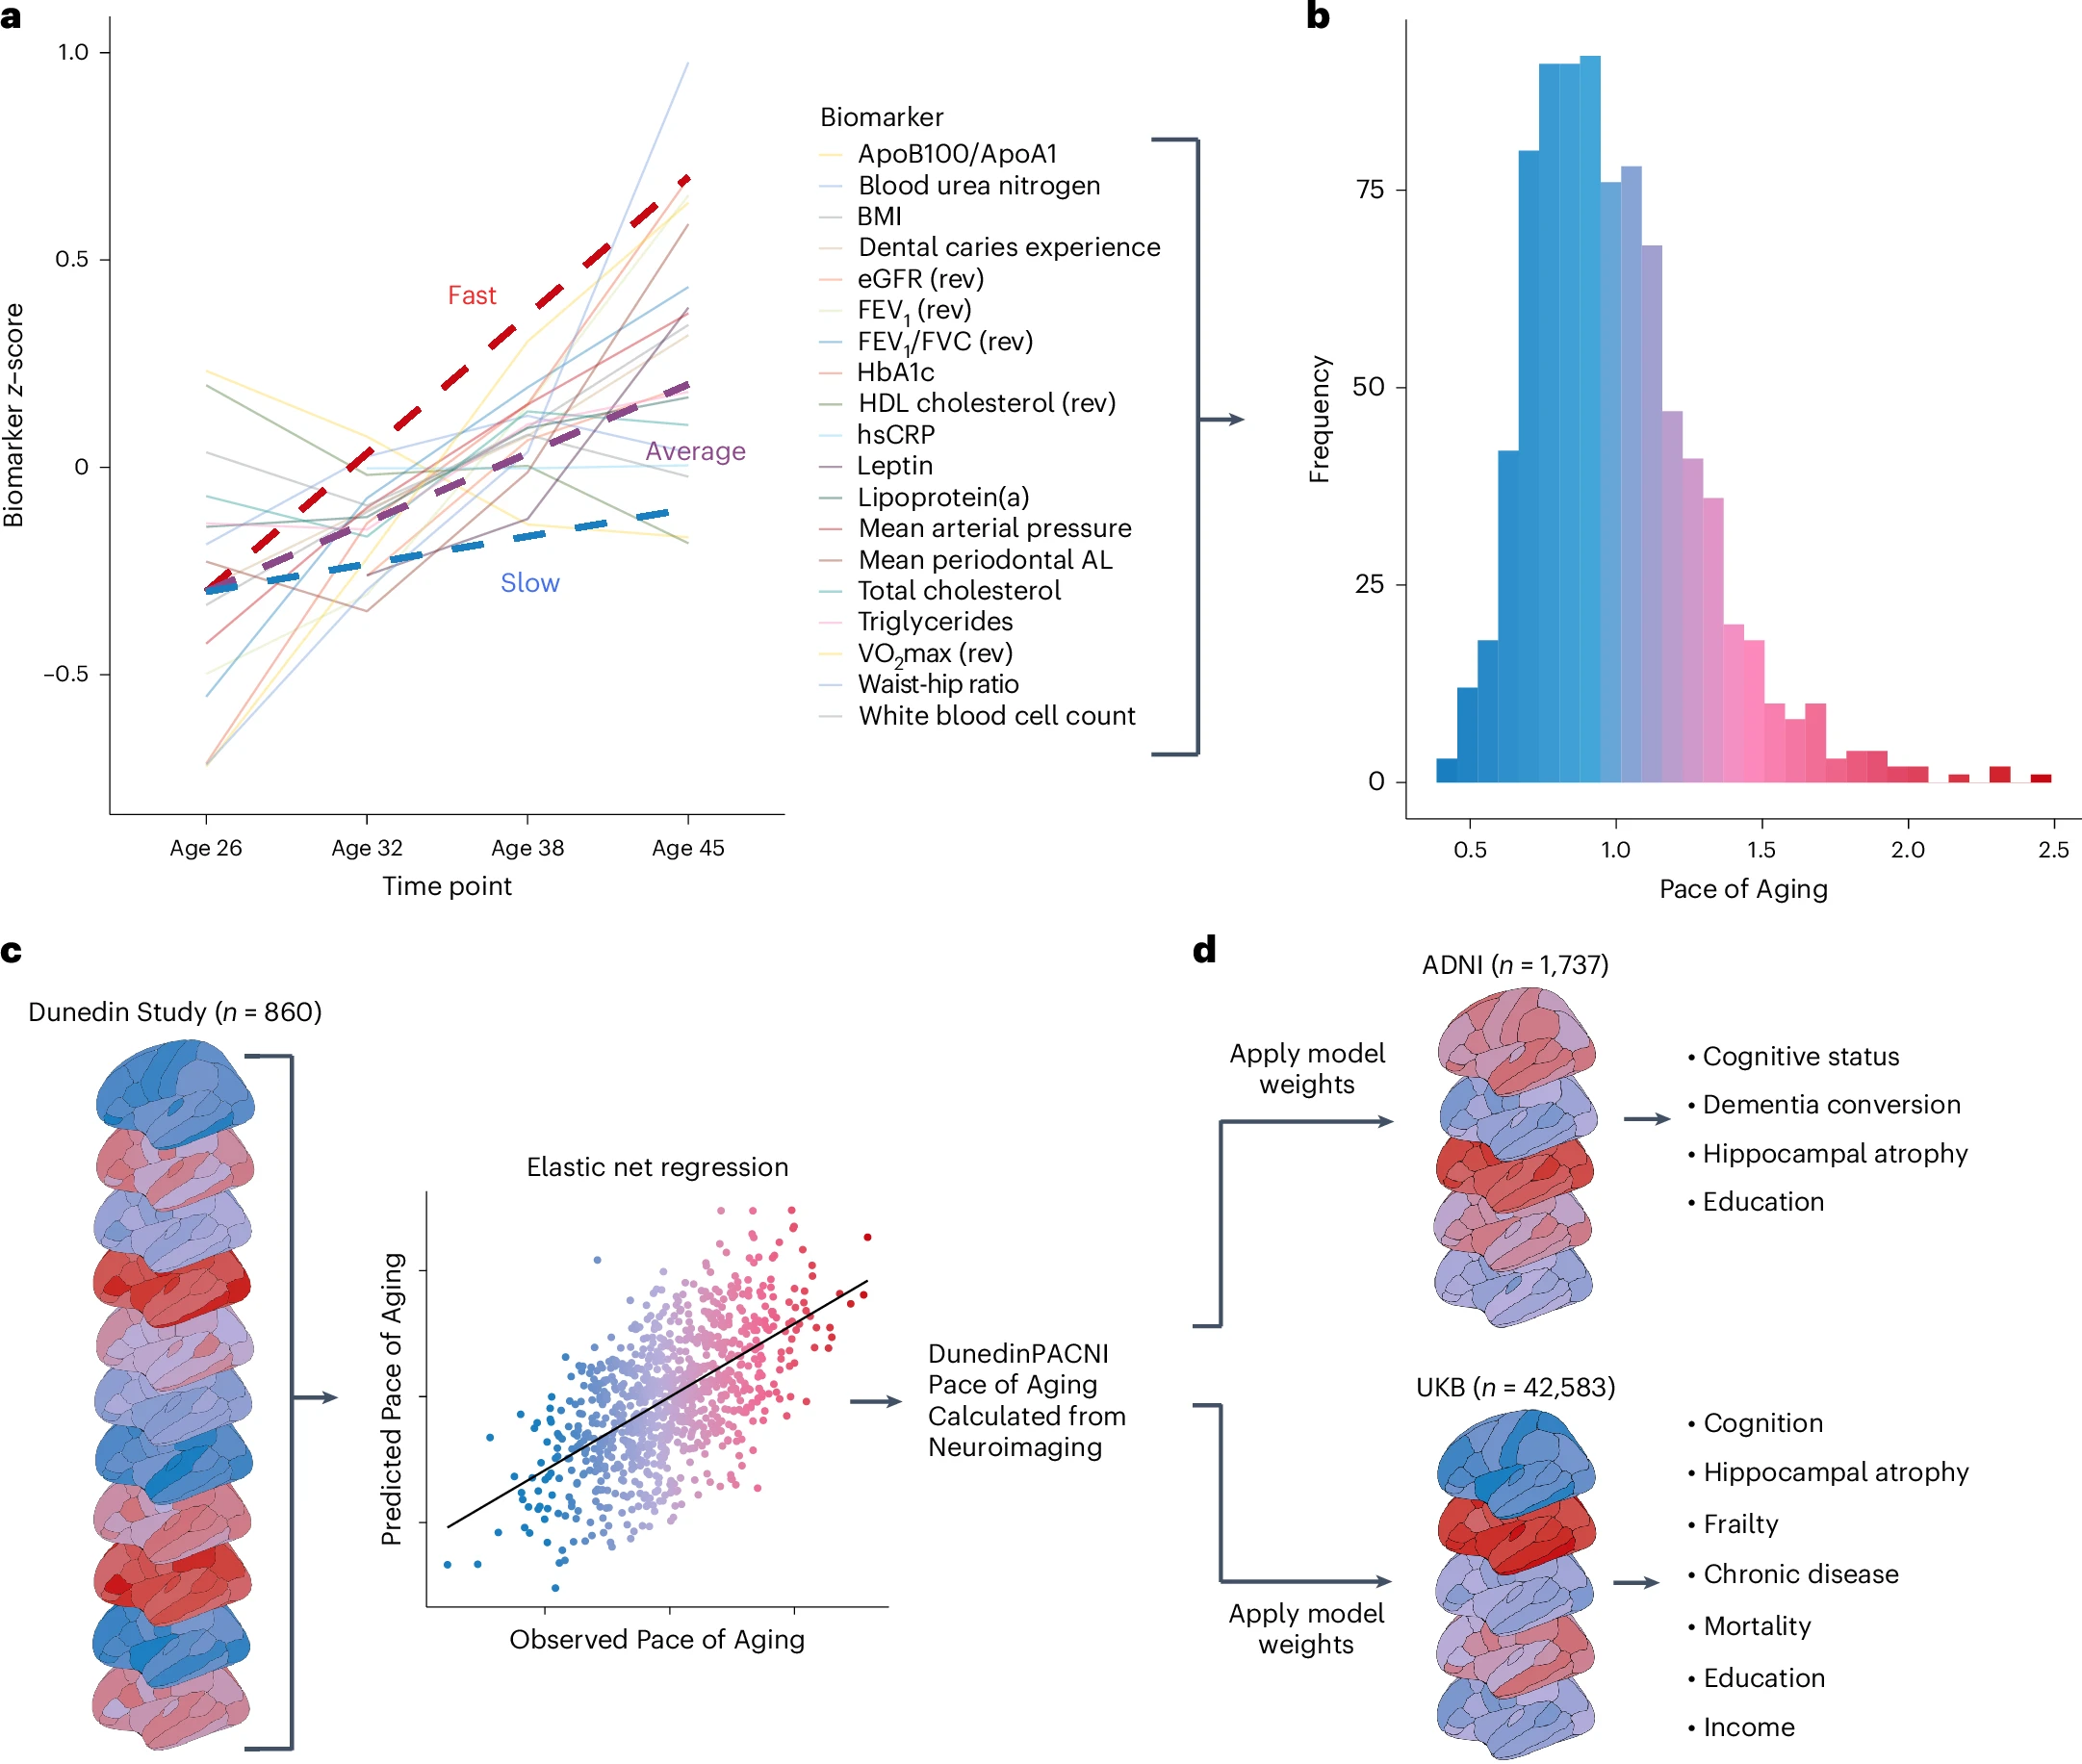
a, Plot of mean scores for all 19 biomarkers comprising the Pace of Aging across four waves of observation at ages 26, 32, 38 and 45 years in the Dunedin Study. Hypothetical individual trajectories are shown for people with relatively slow, average and fast Pace of Aging from ages 26 to 45 years. b, Distribution of Pace of Aging scores in Dunedin Study members at age 45. Warmer colors represent a faster Pace of Aging; cooler colors represent a slower Pace of Aging. c, A single T1-weighted MRI scan collected from 860 Dunedin Study members at age 45 years was used to train an elastic net regression model to predict the Pace of Aging. We call the resulting measure DunedinPACNI. d, Regression weights from the DunedinPACNI model developed in the Dunedin Study were applied to T1-weighted MRI scans collected in the ADNI and UKB datasets to derive DunedinPACNI scores. Those scores were then related to aging-related phenotypes. AL, attachment loss; Apo, apolipoprotein; BMI, body mass index; FEV1, forced expiratory volume in 1 s; eGFR, estimated glomerular filtration rate; HbA1c, glycated hemoglobin; HDL, high-density lipoprotein; hsCRP, high sensitivity C-reactive protein; VO2max, maximal oxygen uptake.
