
Fig. 1: Trajectories in meal and bed times in older adults.
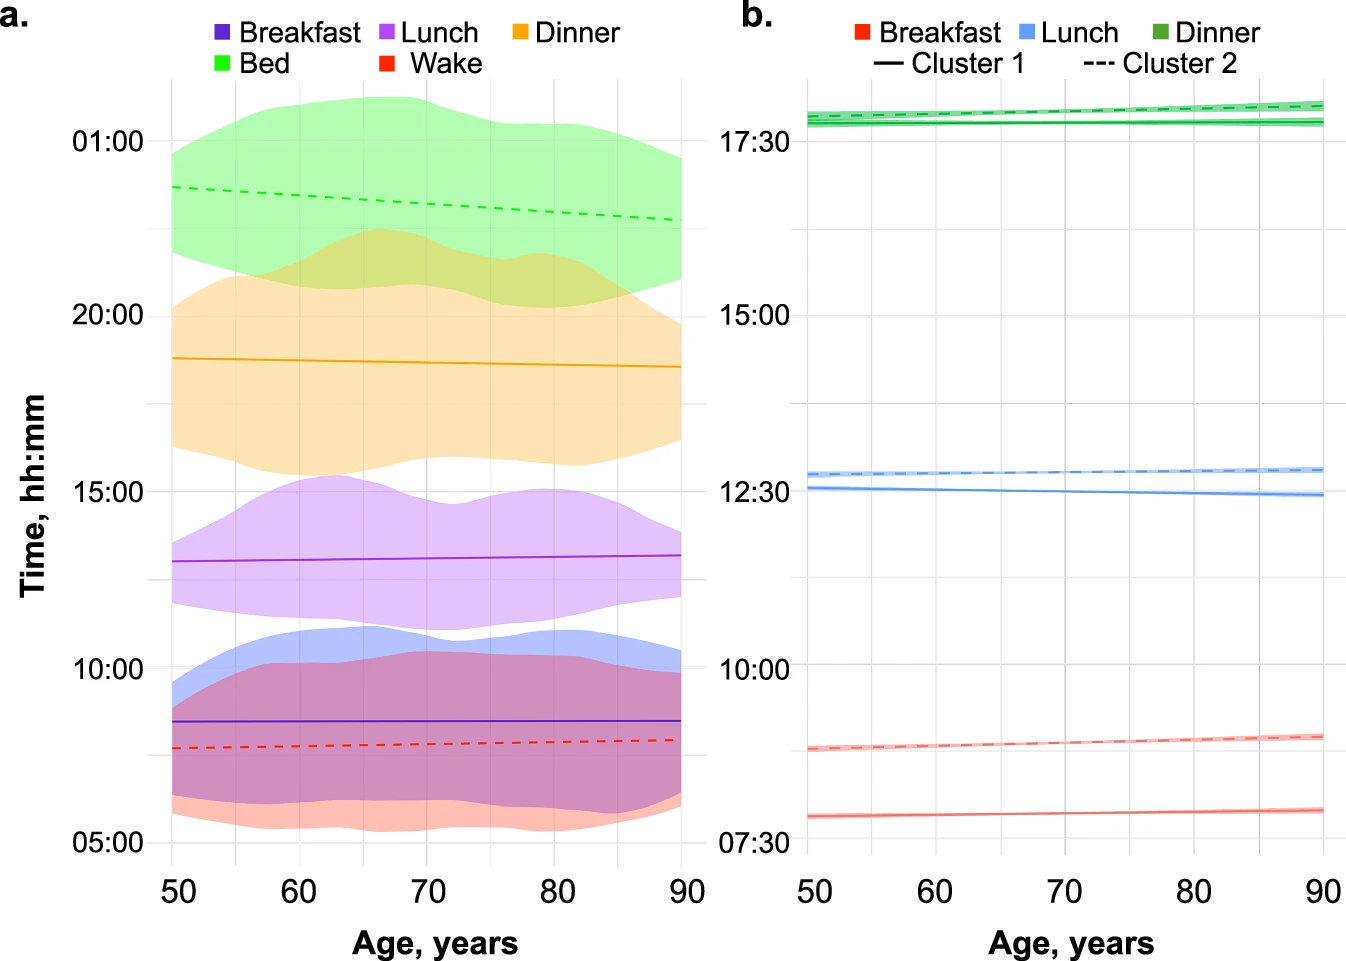
Age-related changes in meal and bed times (a), and latent class differences in meal times and trajectory (b). The lines display model-predicted values from the linear mixed-effect models, with the shaded region indicating the 95% confidence interval of the estimates.
