
Abstract
Mammals are of central interest in ecology and conservation science. Here, we estimate the trajectory of mammal biomass globally over time — including humans, domesticated and wild mammals. According to our estimates, in the 1850s, the combined biomass of wild mammals was ≈200 Mt (million tonnes), roughly equal to that of humanity and its domesticated mammals at that time. Since then, human and domesticated mammal populations have grown rapidly, reaching their current combined biomass of ≈1100 Mt. During the same period, the total biomass of wild mammals decreased by more than 2-fold. We estimate that, despite a moderate increase in the recent decades, the global biomass of wild marine mammals has declined by ≈70% since the 1850s. This provides a broader perspective to observed species extinctions, with ≈2% of marine mammal species recorded as extinct during the same period. While historical wild mammal biomass estimates rely on limited data and have various uncertainties, they provide a complementary perspective to species extinctions and other metrics in tracking the status of wildlife. This work additionally provides a quantitative view on the rapid human-induced shift in the composition of mammalian biomass over the past two centuries.
Introduction
Humans have continuously increased their global range and footprint over the last ≈10,000 years. These processes accelerated considerably following technological innovations introduced in the 19th century, with the global human population growing from 1.2 billion in 1850 to the current 8 billion individuals over less than 200 years1. This rapid growth in the global human population required a greater consumption of natural resources, accompanied by loss of natural habitat2. Over the same period, human activities placed numerous pressures on wild mammal populations, including hunting, habitat loss, and many more3,4,5. In the marine environment, for example, the second half of the 19th century marked the emergence of modern industrial whaling and extensive hunting pressures on mammals6, which intensified over the following century, causing dramatic population declines.
When discussing the changing status of fauna, it is common to refer to species extinctions. While the loss of every species is tragic, this metric only partially reflects the global status of wildlife. It gives equal weight to the elimination of globally abundant species, which shape environments on a large scale7, and rare species. This metric also does not encapsulate functional extinctions: cases in which species, although still extant, reach such low abundance that they no longer interact significantly with their environment8.
Biomass can serve as a metric giving an integrative global view across groups of species9 while answering a very basic curiosity-driven question regarding the ubiquity of life. A holistic view of mammalian biomass encompasses wild mammals, humans, and domesticated mammals. Our recent census showed that domesticated mammals currently outweigh all wild mammals tenfold10. While there is no zero-sum tradeoff between domesticated and wild mammal biomass, the land and water resources required for raising or feeding the growing livestock populations puts additional pressures on the natural environment and on wild animals4. In addition, animal biomass is strongly correlated with energetic consumption11, thus exploring trends in mammalian biomass highlights an additional perspective on resource consumption required by humanity and its livestock, including primary productivity12.
Several metrics and datasets assess changes to the global status of wild mammal biodiversity13,14,15. Among them is the Living Planet Index16, which aims to monitor trends across wildlife populations since 1970. Biomass can offer additional information regarding the status of wildlife and complement other current metrics. In addition, the use of biomass as a metric allows us to compare species with vastly different body sizes. Previous efforts that quantified temporal dynamics of mammalian biomass globally, focused only on specific groups17, worked at a very different time scale and temporal resolution (spanning a hundred thousand years18), or only provided a back-of-the-envelope estimate19. Here, we used a variety of data-driven methods to provide a provisional holistic estimate of global mammalian biomass from 1850 until today.
Results
We start by estimating the biomass of the world’s most tightly monitored mammalian species, humans. The total biomass of humanity can be calculated as the product of the population size and the mean body mass, both of which have changed throughout history. Between the years 1850 and 2020, the global human population increased from 1.2 billion to 8 billion1. Over the same time period, the mean body mass of humans increased by an estimated ≈30% (Fig. S1) due to an increase in the average weight of adults as well as their share of the total population20. Combining the two factors, we estimate that the global biomass of humans increased ≈8-fold over this time period, fueled mainly by population growth (Fig. S2), from ≈50 Mt to ≈420 Mt, as shown in Fig. 1.
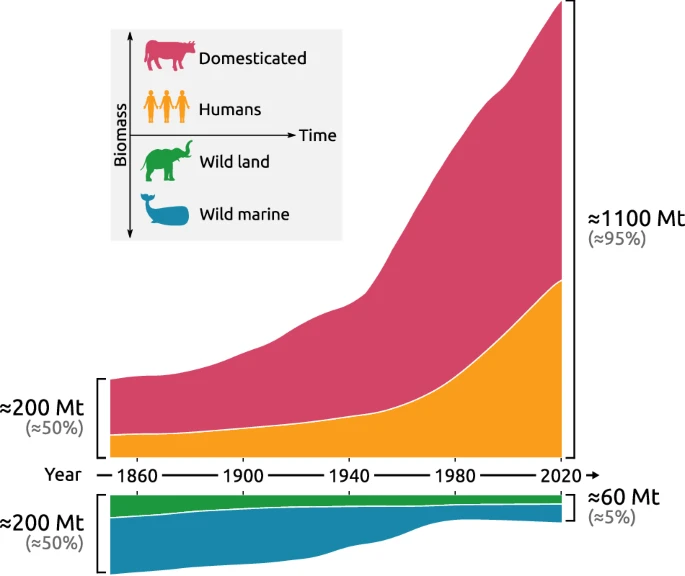
Black labels indicate absolute biomass estimates, gray labels indicate the fraction of the total estimated biomass of mammals (see Fig. S9 for the estimated fraction of global biomass). Top: the total biomass of humans and domesticated mammals (cattle, buffalo, swine and others). Bottom: the total biomass of wild marine mammals, along with a coarse, preliminary estimate of the total biomass of wild land mammals, based on previously published temporal abundance estimates. For wild land mammal species with no available historical abundance estimates, the majority of species in this group, we assume that their biomass remained constant between 1850 and the present (see Discussion). To estimate the historical global biomass of marine mammals, we used a population dynamics model that relies on catch records and population estimates (following Christensen17; see “Methods”). The icon for humans was created in BioRender. Greenspoon, L. (2025) https://BioRender.com/i2g5u8q.
Focusing on the temporal dynamics of domesticated mammals, we compiled available estimates of their total population and mean body mass (see Methods). During this period, cattle consistently comprised roughly two-thirds of the total mammalian livestock biomass. The biomass of cattle alone increased 4-fold since 1850. The biomass of other mammalian species commonly reared for meat or dairy—buffaloes, swine, sheep, goats, etc.—also increased 3–10 fold over this period (Fig. S4). The main exception is horses, whose total biomass likely peaked in the 1920s and is now roughly equal to its 1850 value. In addition to livestock, we performed a coarse estimate of the biomass of common pet species (dogs and cats) and human-associated rodents (rats and house mice). Their combined biomass increased from an estimated ≈5 Mt in 1850 to ≈20 Mt in 2020 (see Supplementary Note 4: Domestic dogs, domestic cats, rats and house mice). The combined estimates suggest a 5-fold increase in the total biomass of domesticated mammals over the last 170 years, from ≈130 Mt to ≈650 Mt, as shown in Fig. 1.
Our analysis also includes an estimate for the global biomass of wild mammals. The uncertainty associated with these estimates is expected to be greater than for human and domesticated mammal biomass due to more limited data availability (see “Discussion”). We estimate the global biomass of marine mammals using a population dynamics model that relies on a combination of catch and abundance data (following Christensen17, see Methods). A few marine mammalian populations, including the North Atlantic right whale (Eubalaena glacialis) and some historically exploited pinniped populations, have dwindled drastically due to hunting operations prior to 185021. Nevertheless, new hunting techniques introduced during the second half of the 19th century, such as the exploding harpoon6, led to a dramatic expansion of global marine mammal hunting pressures. Great Whale species—including the blue whale (Balaenoptera musculus), humpback whale (Megaptera novaeangliae), fin whale (Balaenoptera physalus) and sperm whale (Physeter macrocephalus)—were hunted extensively between the 1860s and 1980s, leading to a dramatic decline in their populations. We estimate that these four species alone comprised ≈80% of marine mammal biomass in 1850. Their decline was halted in 1986, when the International Whaling Commission initiated a moratorium on industrial hunting of Great Whales, allowing only small-scale hunting for specific purposes, such as aboriginal sustenance22. While some exploited marine mammal populations have partially recovered since 198621,23, others remain heavily depleted compared to their estimated historic abundances21,24. Altogether, the total biomass of marine mammals declined by ≈70%, from ≈130 Mt in 1850 to ≈40 Mt today, as shown in Fig. 2.

The International Whaling Commission declared a moratorium on commercial whaling starting in 1986, following some restrictions initiated already in the 1960s. We estimated marine mammal biomass using a population dynamics model that relies on catch data and direct population estimates, following Christensen17 (see “Methods”). The model inherently assumes that the only human impact on wild marine mammal abundance is direct exploitation (See “Discussion”).
The dynamics of the combined global biomass of ≈6400 wild terrestrial mammal species is especially challenging to estimate due to limited data availability. We could not apply the same method used for marine mammals to estimate the biomass of wild land mammals. While wild land mammals were also subjected to intensive hunting pressures over the past two centuries4,5, records of hunted land mammals were not maintained as systematically as those of hunted marine mammals. Moreover, in contrast to many marine populations, human pressures on wild land mammals began tens of thousands of years ago, and wild mammal populations on land were not at carrying capacity levels in 1850. Therefore, for wild land mammal biomass, we only provide a coarse estimate of the temporal dynamics based on published historical population sizes. These were only available for a small fraction of wild land mammal species, mainly large-bodied species. However, our recent census shows large-bodied mammals comprise the majority of wild land mammal biomass, with ≈60% of the biomass concentrated in even-hoofed mammals (Artiodactyla) and elephants (Proboscidea) alone10. We therefore surveyed the literature to find historical population-size estimates for species which we suspected comprised a large fraction of wild land mammal biomass at some point since 1850 (Supplementary Table 2). This includes all large-bodied (>100 kg) species. By assembling and harmonizing these heterogeneous data, we estimated that the biomass of wild land mammals decreased by over one half since 1850, from ≈50 Mt to ≈20 Mt. Indeed, our estimates suggest that the biomass of the African elephant (Loxodonta africana) alone in 1850 roughly equal to the current biomass of all wild terrestrial mammals combined10,25. While some species, such as the white-tailed deer (Odocoileus virginianus), experienced a rapid boom over the same time period26, their estimated biomass gains are negligible compared to the decline of the African elephant biomass, as shown in Supplementary Fig. 7. As we discuss below, there are many caveats to the land mammals estimate that make this only a preliminary effort.
In sum, we estimate that the global biomass of mammals in the year 1850, before the second stage of the industrial revolution, was ≈400 Mt. In the 170 years since then, it has increased almost 3-fold, to ≈1100 Mt (Fig. 2). This increase is exclusively due to the rapid growth of the human and domesticated mammal populations, namely livestock, and in spite of the decline in wild mammal biomass.
Discussion
We integrated temporal dynamic estimates for the global biomass of the main groups in the class Mammalia. This quantitative perspective on the global biomass of all mammals reveals the growth in the human population and human-associated mammals worldwide, in parallel with the decline of wild mammal biomass. Since biomass is strongly correlated with resource consumption, comparing human, domesticated mammal, and wild mammal biomass over 170 years also reveals the increased requirements of humanity compared to all wild mammals.
Biomass as a metric enables a global view of the dynamic status of wildlife beyond species extinctions. For example, while the International Union for Conservation of Nature (IUCN) Red List of Threatened Species records only three global extinctions of marine mammal species since 1850 (see Supplementary Table 8), we estimate that the global wild marine mammal biomass has reduced by ≈70% over this period27. This biomass decline indicates a significant loss of key processes facilitated by marine mammals and has likely altered the functions and structure of the marine environment28,29.
Many charismatic wild mammal species, such as the African elephant, are relatively well-monitored. However, none have continuous global population abundance observations that span over the past 170 years. In fact, multiple global population size observations are available only for a small fraction of wild mammal species. We therefore used population dynamics modeling to augment the sparse data and estimate the historical biomass of wild marine mammals. To provide a coarse estimate for the historical biomass of wild land mammals, we performed a dedicated literature survey around species for which data on their historical abundances were available. As discussed below, each of these methods has limitations and potential biases.
To estimate the biomass of wild marine mammals since 1850, we used a population dynamics model that relies on catch records and direct population estimates (see “Methods”). The model inherently assumes that the only human impact on wild marine mammal abundance is direct exploitation. Our assessments might, therefore, contain biases since human impacts on marine mammals can include fishing of whale prey, fishing gear entanglement, ship strikes, climate change and many other drivers30,31,32. Importantly, our estimates do not fully encapsulate changes in carrying capacity due to changes to the food web and available resources.
For wild terrestrial mammals, we provide a provisional estimate based on previously published temporal abundance estimates (see “Methods”). These are relatively few and predominantly species of special interest, mainly for conservation or hunting. For the wild land mammal species for which no historical population size data were available, we assume that their biomass remained constant since 1850. We therefore likely underestimate the historical global biomass of wild terrestrial mammals and the level of decline since 1850. While several striking results are already apparent given current knowledge, dedicated efforts to continuously monitor the global abundance of wild land mammal species are necessary to better quantify the temporal dynamics of mammal biomass across all species, and especially for smaller-bodied ones. This study helps to reveal those gaps in our knowledge of global wild mammal abundance, forming a step towards a holistic quantitative census of wildlife.
There are multiple global efforts to quantify the changing status of wildlife populations, including those of wild land mammals, such as the Living Planet Index14,15,33,34,35,36. While we did not find a way to use these data in our final estimate, we utilize some of these to provide a plausibility check on our final estimate of the historical biomass of wild land mammals (see “Other methods considered to estimate the temporal dynamics of wild land mammal biomass” in SI). Such datasets are highly important in paving the way for a more accurate data-driven estimate of the temporal dynamics of wild land mammal biomass in the future.
Our estimates begin in the year 1850, as it is widely used in the literature to mark a pristine ocean biomass, prior to industrial scale whaling and fishing37. Human impacts on wild terrestrial mammals began long before 1850. Human activity likely led to the elimination of half the megafauna species in the Pleistocene and early Holocene, between ≈50,000 and ≈3000 years ago18. Estimates of wild land mammal biomass in 1850, therefore, do not reflect a pristine environment, but a terrestrial environment already depleted compared to prehistoric levels.
We estimated the global biomass of mammals between 1850 and the present. As we go further back in history, data on the abundance of mammals becomes sparser. Therefore, our estimates necessarily contain increasing relative uncertainties as we go back in time towards 1850. We aimed to synthesize all extant data and get a modern timeline on the biomass of mammals on our planet, to provide a baseline estimate. We sought to utilize available data to improve this previous estimate, while transparently specifying the assumptions and data sources used. While imperfect, obtaining a quantitative perspective is crucial to create a better understanding of the status of wildlife, and to derive lessons for future conservation efforts. For example, in the case of marine mammals, their relatively slow and partial recovery following the establishment of the global moratorium on industrial hunting can serve as a lesson for other efforts in coming decades. In addition, our estimates can serve as a call to action to improve and refine historical baselines of wild mammal biomass.
This study is a quantitative estimate of the recent temporal dynamics of mammal biomass on Earth. Its results can enrich discussions on the past, present and future of wild mammals, which often serve as icons of global wildlife conservation. The results presented here can be additionally useful in avoiding the “shifting baseline” syndrome—a gradual change in the accepted norms for the condition of the natural environment, caused by a lack of knowledge38,39. It further provides a quantitative perspective on the human–wild relationship on a global scale.
Methods
Relatively detailed demographic data are available for human populations and livestock. However, for wild mammals, obtaining accurate estimates for their total biomass is challenging even for the present, as global population census data are lacking for most species10. Consequently, to estimate trends in the global mammal biomass over the past 170 years, we had to fill many gaps in the existing data, as described in depth below. Since the data availability, life cycles and human-induced pressures in the ocean are significantly different than on land, we used separate analyses for marine and terrestrial mammals. For marine mammals, we used a model of population dynamics that relies on catch data and direct population estimates17, while for wild land mammals, we collected temporal dynamics estimates from literature (focusing our efforts on species that currently, or could potentially, comprise a large fraction of wild land mammal biomass). See Supplementary Fig. 8 for a schematic visualization of our methods. All of the data used to generate our estimates, as well as the code used for analysis, are open-sourced and available at https://gitlab.com/milo-lab-public/mammal_biomass_since_1850.
Humans
Global human population estimates between 1850 and 1950 were taken from the History database of the Global Environment (HYDE, version 3.21) which contains global historical population data. Global human population estimates for the time period 1950–2020 were taken from the United Nations’ World Population Prospects database40. We estimated mean human body mass at each time point using a combination of BMI, height and demographics data (see Supplementary Note 2: Individual body mass).
Domesticated mammals
Our analysis includes 14 mammalian livestock groups (either one species or a few similar species, according to FAO definitions. See Supplementary Fig. 4). We compiled stock estimates from multiple sources. For the time period 1961–2020, we used the FAOstat database41. For the time period 1890–1961, we used global stock estimates from the History database of the Global Environment (HYDE, version 1.0)42. For the time period 1850–1890 no global stock data were available. To provide a coarse estimate for the biomass of livestock during this earliest time period, we extracted the 1890 livestock-to-human population ratio for each livestock species. We then multiplied these with available estimates of human population for the time period 1850–1890 (though livestock-to-human ratios possibly somewhat increased; see Supplementary Fig. 3).
We multiplied the attained population sizes by the mean body mass estimates43 (see Supplementary Fig. 4). Data on the historical mean body mass of livestock species were not available. We therefore used current-day body mass estimates for livestock species between 1850 and the present (see “Mean body mass of livestock species” in SI). It is likely that the historical body mass of many livestock species is lower than current day body mass, as living conditions and selective breeding were aimed to optimize yield. We therefore performed a sensitivity analysis on the impact of this assumption on our estimate of the total biomass of livestock species. We multiplied global population counts with current-day body mass estimates from the region where body mass estimates were lowest - Africa. As livestock in Africa are typically raised using more traditional methods, they could serve as a potential proxy for the mean body mass in 1850. This resulted in a total livestock biomass of ≈80 Mt for the year 1850, or ≈60% of the baseline estimated total livestock biomass in 1850.
For a few groups of mammalian livestock species, including mules, rabbits and llamas (see Supplementary Fig. 4), data on global stocks were only available since the 1960s. We therefore provide a preliminary estimate for the temporal dynamics of these groups, assuming that the population ratio between these species and humans remained constant during the time period 1850–1960 (see Domesticated mammal biomass section in SI). As their contribution to the current day total biomass of domesticated mammals is low (<5%10;), this assumption does not have a strong impact on the overall dynamics of domesticated mammal biomass.
We similarly provide a preliminary estimate for the temporal dynamics of the total biomass of common pet species, (the domestic cat and dog) and rodent species that are extremely dense in homes and urban environments (black and brown rat, house mouse), assuming that the population ratio between these species and humans remained constant between 1850 and the present. The analysis in full is provided in the Supplementary Note 4: Domestic dogs, domestic cats, rats and house mice.
Wild marine mammals
Population trajectories for historically exploited marine mammals traditionally rely on logistic models of various degrees of complexity17,44. Such models are used by the International Whaling Commission to assess historical abundances45. Some models include age structure, geographic variations and other parameters23,45. To estimate the population trajectories of wild marine mammals, we implemented a variant of a logistic model, Stochastic Stock Reduction Analysis17,46 following Christensen17. We chose this model because it is relatively simple and allows for a high-throughput analysis across all exploited marine mammal species.
For marine mammals, although most population size reports are from recent years, the numbers of whales caught have been thoroughly documented in logbooks and processing stations47. Those were curated by the International Whaling Commission as part of global efforts to regulate whaling globally 47.
To estimate the temporal dynamics of the global biomass of marine mammals, we used data on the number of individuals caught every year since the onset of industrial hunting, along with observed population sizes, mainly from recent years. In simple terms, the model we used (as described in detail below) relies on the relationship:
This is a simplified version of Eq. (2) below, which produces a population trajectory. We generated multiple such trajectories by repeatedly “guessing” the total population in the year of the onset of known hunt for that population. We gave each trajectory a score based on the years where population abundance observations are available: a simulated population size similar to observed population size would yield a high score. We then produce the final estimate using a score-weighted mean, as detailed below. We performed this calculation for every population of every species (a single species in one area, for example—the humpback whale in the North Atlantic Ocean).
We manually collected updated catch and population abundance estimates for 81 populations of 46 exploited marine mammal species for the time period 2000–2020 from multiple data sources, including the International Whaling Commission and NOAA. We added these to data from Christensen17, which curated catch and population abundance data for the same populations until the year 2000. For great whale populations in the Southern Hemisphere, we replaced these with catch data from Rocha et al.47, which includes Soviet catch totals. We then replicated the analysis performed by Christensen17 as described below. Of all population size estimates collected, ≈80% are fairly recent (between 1980 and the present, see Supplementary Data 2).
The model uses annual historical catch data to estimate the size of the population before the onset of human exploitation \(K\) (population at “carrying capacity”), along with \({r}_{\max }\), the intrinsic population production rate (births minus natural deaths) of a species using the relationship
Where \({t}_{0}\) is the year of the first recorded industrial hunt, \({N}_{t}\) is the size of the population at year \(t\), the number of individuals hunted at year \(t\), and \({w}_{t}\) is the random errors at year \(t\). This is a more detailed version of Eq. (1), used to calculate the population trajectory in practice.
We generated 10,000 population trajectories by randomly drawing from a prior distribution of \({r}_{\max }\), \(K\), and \({w}_{t}\) values (as specified in Supplementary Table 4) and simulating the system dynamics using Eq. (2) and recorded catch \({C}_{t}\).
To account for both observation errors (\(y\), the error associated with observed population size) and the error associated with our model (\(w\)), we divide a total error term, \(\kappa\), between the two as follows:
The proportion of error associated with the observation error, \(p\), is determined according to the certainty associated with population size observations. For example, if dedicated counts were performed to estimate population size, most of the total error would be allocated to process errors. In cases where the population size was reported but its uncertainty was not specified, a larger share of the total error term would be allocated to observation errors (all cases and values are specified in Supplementary Table 6). Process error values (\({\omega }_{t}\), see Eq. 2) are drawn from a normal distribution with a mean of 0 and standard deviation \(\sigma_{w}\).
The likelihood of obtaining the observed abundances, \(Y\), was calculated as follows
where \(n\) is the number of abundance observations and \({y}_{t}\) is the observed abundance at year \(t\).
We calculated the posterior probability to obtain each trajectory using the product of its likelihood and the prior probability to obtain the \({r}_{\max }\) used to generate said trajectory. We then re-sampled the generated trajectories with a sample probability proportional to the calculated posterior probability, and extracted the median estimate along with a 95% confidence interval from that posterior probability distribution.
We applied the model above to all marine mammal populations for which exploitation levels have been recorded. In cases where \({t}_{0}\) > 1850, we assume that the abundance of that population remained constant between 1850 and \({t}_{0}\). Due to lack of other available data, for populations that were not hunted commercially (see full list in Supplementary Data 1) we use their current day biomass for the time period 1850–present. These include 69 marine mammal species, along with 24 populations of species exploited in other areas. We estimated the combined biomass of these populations at ≈5 Mt, less than a fifth of the total current-day biomass of wild marine mammals. Fully aquatic freshwater mammals were also included in this category, due to their functional and phylogenetic association with marine mammals. These comprise only a very small fraction of the total biomass of marine and fully aquatic mammals (<0.01 Mt).
For sperm whales, we used a previously published estimate for the historical population trajectory globally instead of generating a new trajectory using the model used for other populations. As Whitehead and Shin23 recently estimated the current-day and historical population trajectory of sperm whales globally, we manually extracted their estimated sperm whale abundance between 1850 and the present.
Estimated population sizes were multiplied at each time point by mean body masses estimated by Trites and Pauly 48.
Our analysis inherently assumes that the carrying capacity (\(K\)), production rate (\({r}_{\max }\)) and body mass of marine mammal populations remained constant throughout the past 170 years. Pressures on these heavily harvested populations likely led to slower production rate, as well as to a decrease in the mean individual body mass49,50. Similarly, indirect human pressures on the same populations changed resource availability, likely reducing carrying capacity. To account for the possible implications of some of these assumptions using available data, we compared the values produced by our model for the populations with the largest contribution to the historical biomass of wild marine mammals, to published pre-exploitation abundance estimates based on other models. While most of these were derived from more complex population dynamics models (which incorporate, for example, age structure and prey availability), they produced similar results (see Supplementary Note 5, “Comparing inferred marine mammal population trajectories to published estimates based on other models”; Supplementary Table 3).
Wild land mammals
We provide a preliminary, coarse estimate of the temporal dynamics of wild land mammal biomass using a dedicated literature survey.
We performed this dedicated literature survey focusing on species we suspected of having a major contribution to mammal biomass at some point during the past 170 years. The list of species includes all 74 large-bodied (>100 kg) species, as well as seven widespread cervid and boar species, such as the white-tailed deer (Odocoileus virginianus), and all current-day major biomass contributors (contribution >0.5% to the total current day biomass of wild land mammals as estimated in our previous study10). We were able to obtain historical population estimates for 37 of these 121 species (see Supplementary Note 8, “Published abundance estimates used to calculate the global biomass of wild land mammals”; Supplementary Table 2). Due to lack of data availability, we portray the biomass of all other wild land mammal species as constant. These species combined comprise roughly half of the global biomass of wild terrestrial mammals in the 1850s, as shown in Supplementary Fig. 7.
Collected historical abundance estimates include census data and modeled estimates. For many of the species analyzed, estimates of past total abundance were later than 1850. To be conservative, we assumed that, for all species, their biomass remained constant between 1850 and the year of the first available abundance estimate. We multiplied these obtained population sizes by mean body mass estimates (see Supplementary Note 2: Individual body mass).
Reporting summary
Further information on research design is available in the Nature Portfolio Reporting Summary linked to this article.
Data availability
The data used in this study are all available or linked in the designated GitLab repository, https://gitlab.com/milo-lab-public/mammal_biomass_since_1850. All Figures from the main manuscript and SI were created using the Python Matplotlib library. All of the source code is available on our online Gitlab repository. The raw data of human BMI data is available at https://www.ncdrisc.org/data-downloads-adiposity.html; human population by age https://population.un.org/wpp/; human height at https://uni-tuebingen.de/fakultaeten/wirtschafts-und-sozialwissenschaftliche-fakultaet/faecher/fachbereich-wirtschaftswissenschaft/wirtschaftswissenschaft/lehrstuehle/volkswirtschaftslehre/wirtschaftsgeschichte/forschung/data-hub-height.html; country income level https://datahelpdesk.worldbank.org/knowledgebase/articles/906519-world-bank-country-and-lending-groups. These are also linked directly in the designated GitLab repository.
Code availability
The code used to analyze data and generate figures for this study is all available in the designated GitLab repository, https://gitlab.com/milo-lab-public/mammal_biomass_since_1850.
References
Klein Goldewijk, K., Beusen, A., Doelman, J. & Stehfest, E. Anthropogenic land use estimates for the Holocene–HYDE 3.2. Earth Syst. Monit. 9, 927–953 (2017).
Steffen, W. et al. The anthropocene: from global change to planetary stewardship. Ambio 40, 739–761 (2011).
Dirzo, R. et al. Defaunation in the Anthropocene. Science 345, 401–406 (2014).
Ripple, W. J. et al. Collapse of the world’s largest herbivores. Sci. Adv. 1, e1400103 (2015).
Ripple, W. J. et al. Status and ecological effects of the world’s largest carnivores. Science 343, 1241484 (2014).
Tønnessen, J. N. & Johnsen, A. O. The History of Modern Whaling (University of California Press, 1982).
Gaston, K. J. Ecology. Valuing common species. Science 327, 154–155 (2010).
McCauley, D. J. et al. Marine defaunation: animal loss in the global ocean. Science 347, 1255641 (2015).
Bar-On, Y. M., Phillips, R. & Milo, R. The biomass distribution on Earth. Proc. Natl Acad. Sci. USA 115, 6506–6511 (2018).
Greenspoon, L. et al. The global biomass of wild mammals. Proc. Natl Acad. Sci. USA 120, e2204892120 (2023).
Brown, J. H., Gillooly, J. F., Allen, A. P., Savage, V. M. & West, G. B. Toward a metabolic theory of ecology. Ecology 85, 1771–1789 (2004).
Kleiber, M. Body size and metabolic rate. Physiol. Rev. 27, 511–541 (1947).
Scholes, R. J. & Biggs, R. A biodiversity intactness index. Nature 434, 45–49 (2005).
Dornelas, M. et al. BioTIME: a database of biodiversity time series for the Anthropocene. Glob. Ecol. Biogeogr. 27, 760–786 (2018).
Hudson, L. N. et al. The database of the PREDICTS (Projecting Responses of Ecological Diversity In Changing Terrestrial Systems) project. Ecol. Evol. 7, 145–188 (2017).
Acreman, M. Water and ecology: Linking the Earth’s ecosystems to its hydrological cycle. Revista CIDOB d’Afers Internacionals 129–144 (1999).
Christensen, L. B. Marine mammal populations: Reconstructing historical abundances at the global scale. https://doi.org/10.14288/1.0074757 (2006).
Barnosky, A. D. Megafauna biomass tradeoff as a driver of quaternary and future extinctions. Proc. Natl Acad. Sci. 105, 11543–11548 (2008).
Smil, V. Harvesting the biosphere: the human impact. Popul. Dev. Rev. 37, 613–636 (2011).
Blum, M. Why are you tall while others are short? Agricultural production and other proximate determinants of global heights. Eur. Rev. Econ. Hist. 18, 18 (2014).
Magera, A. M., Mills Flemming, J. E., Kaschner, K., Christensen, L. B. & Lotze, H. K. Recovery trends in marine mammal populations. PLoS One 8, e77908 (2013).
International Whaling Commission. Total catches. https://iwc.int/total-catches.
Whitehead, H. & Shin, M. Current global population size, post-whaling trend and historical trajectory of sperm whales. Sci. Rep. 12, 19468 (2022).
Lotze, H. K. & Worm, B. Historical baselines for large marine animals. Trends Ecol. Evol. 24, 254–262 (2009).
Milner-Gulland, E. J. & Beddington, J. R. The exploitation of elephants for the ivory trade: an historical perspective. Proc. R. Soc. Lond. Ser. B: Biol. Sci. 252, 29–37 (1997).
VerCauteren, K. C. The Deer Boom: Discussions on Population Growth and Range Expansion of the White-Tailed Deer. 281, (USDA Wildlife Services: Staff Publications, 2003).
Savoca, M. S. et al. Baleen whale prey consumption based on high-resolution foraging measurements. Nature 599, 85–90 (2021).
Roman, J. & McCarthy, J. J. The whale pump: marine mammals enhance primary productivity in a coastal basin. PLoS One 5, e13255 (2010).
Roman, J. et al. Whales as marine ecosystem engineers. Front. Ecol. Environ. 12, 377–385 (2014).
Thomas, P. O., Reeves, R. R. & Brownell, R. L. Jr. Status of the world’s baleen whales. Mar. Mamm. Sci. 32, 682–734 (2016).
Avila, I. C., Kaschner, K. & Dormann, C. F. Current global risks to marine mammals: taking stock of the threats. Biol. Conserv. 221, 44–58 (2018).
Stewart, J. D. et al. Boom-bust cycles in gray whales associated with dynamic and changing Arctic conditions. Science 382, 207–211 (2023).
Puurtinen, M., Elo, M. & Kotiaho, J. S. The Living Planet Index does not measure abundance. Nature 601, E14–E15 (2022).
Santini, L., Benítez-López, A., Dormann, C. F. & Huijbregts, M. A. J. Population density estimates for terrestrial mammal species. Glob. Ecol. Biogeogr. 31, 978–994 (2022).
Santini, L., Isaac, N. J. B. & Ficetola, G. F. TetraDENSITY: a database of population density estimates in terrestrial vertebrates. Glob. Ecol. Biogeogr. 27, 787–791 (2018).
Almond, R., Grooten, M. & Peterson, T. Living Planet Report 2020—bending the curve of biodiversity loss. (2020).
Hatton, I. A., Heneghan, R. F., Bar-On, Y. M. & Galbraith, E. D. The global ocean size spectrum from bacteria to whales. Sci. Adv. 7, eabh3732 (2021).
Soga, M. & Gaston, K. J. Shifting baseline syndrome: causes, consequences, and implications. Front. Ecol. Environ. 16, 222–230 (2018).
Pauly, D. Anecdotes and the shifting baseline syndrome of fisheries. Trends Ecol. Evol. 10, 430 (1995).
United Nations Department of Economic and Social Affairs, Population Division. World population prospects 2022, Online Edition. https://population.un.org/wpp/.
Food and Agriculture Organization of the United Nations. FAOSTAT Statistics Database. https://www.fao.org/faostat/en/#data.
Klein Goldewijk, K., Battjes, C. G. M. & Batjes, J. J. A Hundred Year (1890–1990) Database for Integrated Environmental Assessments (HYDE, version 1.1). http://hdl.handle.net/10029/10028.
Change, I. P. O. C. 2006 IPCC Guidelines for National Greenhouse Gas Inventories, Volume 4, Chapter 10. (Institute for Global Environmental Strategies, 2006).
Holt, S. J. Counting whales in the North Atlantic. Science 303, 39–40 (2004). author reply 39–40.
Jackson, J. A., Patenaude, N. J., Carroll, E. L. & Baker, C. S. How few whales were there after whaling? Inference from contemporary mtDNA diversity. Mol. Ecol. 17, 236–251 (2008).
Walters, C. J., Martell, S. J. D. & Korman, J. A stochastic approach to stock reduction analysis. Can. J. Fish. Aquat. Sci. 63, 212–223 (2006).
Rocha, R. C. Jr, Clapham, P. J. & Ivashchenko, Y. Emptying the oceans: a summary of industrial whaling catches in the 20th century. Mar. Fish. Rev. 76, 37–48 (2015).
Trites, A. W. & Pauly, D. Estimating mean body masses of marine mammals from maximum body lengths. Can. J. Zool. 76, 886–896 (1998).
Stewart, J. D. et al. Decreasing body lengths in North Atlantic right whales. Curr. Biol. 31, 3174–3179.e3 (2021).
Hutchings, J. A. & Baum, J. K. Measuring marine fishes biodiversity: temporal changes in abundance, life history and demography. Philos. Trans. R. Soc. Lond. B Biol. Sci. 360, 315–338 (2005).
Acknowledgements
We thank Ariel Amir, Trevor Branch, Roee Ben-Nissan, Phil Hammond, Gabriel Henrique de Oliveira Caetano, Eric Galbraith, Ian Hatton, Patrik Henriksson, Avi Flamholz, Tamir Klein, Samuel Lovat, Heike Lotze, Douglas McCauley, Shai Meiri, Henrik Österblom, Yitzhak Pilpel, Itai Raveh, Yuval Rosenberg, Ron Sender, Ronny Sthoeger, Els Vermeulen, Tali Wiesel, David Zeevi for their intellectual insights for this study. This work was supported by the Resnick Sustainability Institute at Caltech and the Schwartz-Reisman Collaborative Science Program at the Weizmann Institute of Science. This research was generously supported by the Institute for Environmental Sustainability (IES) at the Weizmann Institute of Science. Prof. Ron Milo is the Director of the Institute for Environmental Sustainability (IES) and the incumbent of the Charles and Louise Gartner Professorial Chair.
Author information
Authors and Affiliations
Contributions
L.G., E.N., and R.M. conceived the idea, designed and performed research, analyzed data and created visualizations; L.G., N.R., U.M. collected and curated data; L.G., U.R., R.P., E.N., and R.M. wrote the paper.
Corresponding author
Ethics declarations
Competing interests
The authors declare no competing interests.
Peer review
Peer review information
Nature Communications thanks the anonymous, reviewer(s) for their contribution to the peer review of this work. A peer review file is available.”
Additional information
Publisher’s note Springer Nature remains neutral with regard to jurisdictional claims in published maps and institutional affiliations.
Rights and permissions
Open Access This article is licensed under a Creative Commons Attribution-NonCommercial-NoDerivatives 4.0 International License, which permits any non-commercial use, sharing, distribution and reproduction in any medium or format, as long as you give appropriate credit to the original author(s) and the source, provide a link to the Creative Commons licence, and indicate if you modified the licensed material. You do not have permission under this licence to share adapted material derived from this article or parts of it. The images or other third party material in this article are included in the article’s Creative Commons licence, unless indicated otherwise in a credit line to the material. If material is not included in the article’s Creative Commons licence and your intended use is not permitted by statutory regulation or exceeds the permitted use, you will need to obtain permission directly from the copyright holder. To view a copy of this licence, visit http://creativecommons.org/licenses/by-nc-nd/4.0/.
About this article

Cite this article
Greenspoon, L., Ramot, N., Moran, U. et al. The global biomass of mammals since 1850. Nat Commun 16, 8338 (2025). https://doi.org/10.1038/s41467-025-63888-z
Received:
Accepted:
Published:
Version of record:
DOI: https://doi.org/10.1038/s41467-025-63888-z
This article is cited by
-
Human biomass movement exceeds the biomass movement of all land animals combined
Nature Ecology & Evolution (2025)
