
Abstract
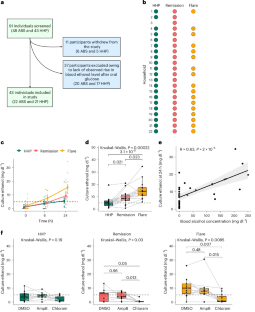
Auto-brewery syndrome (ABS) is a rarely diagnosed disorder of alcohol intoxication due to gut microbial ethanol production. Despite case reports and a small cohort study, the microbiological profiles of patients remain poorly understood. Here we conducted an observational study of 22 patients with ABS and 21 unaffected household partners. Faecal samples from individuals with ABS during a flare produced more ethanol in vitro, which could be reduced by antibiotic treatment. Gut microbiome analysis using metagenomics revealed an enrichment of Proteobacteria, including Escherichia coli and Klebsiella pneumoniae. Genes in metabolic pathways associated with ethanol production were enriched, including the mixed-acid fermentation pathway, heterolactic fermentation pathway and ethanolamine utilization pathway. Faecal metabolomics revealed increased acetate levels associated with ABS, which correlated with blood alcohol concentrations. Finally, one patient was treated with faecal microbiota transplantation, with positive correlations between gut microbiota composition and function, and symptoms. These findings can inform future clinical interventions for ABS.
This is a preview of subscription content, access via your institution
Access options
Access Nature and 54 other Nature Portfolio journals
Get Nature+, our best-value online-access subscription
$32.99 / 30 days
cancel any time
Subscribe to this journal
Receive 12 digital issues and online access to articles
$119.00 per year
only $9.92 per issue
Buy this article
- Purchase on SpringerLink
- Instant access to the full article PDF.
USD 39.95
Prices may be subject to local taxes which are calculated during checkout


Data availability
Shotgun metagenomics and ITS2 sequencing datasets have been uploaded to the Sequence Read Archive under BioProject accession number PRJNA1257465. Metabolomics data are available upon request. Please contact corresponding author B.S. and the request will be addressed in a timely manner.
Code availability
Scripts associated with this study are available via GitHub at https://github.com/hlfreund/ABS_CHsu.
References
Painter, K., Cordell, B. J. & Sticco, K. L. Auto-Brewery Syndrome (StatPearls Publishing, 2025).
Bayoumy, A. B., Mulder, C. J. J., Mol, J. J. & Tushuizen, M. E. Gut fermentation syndrome: a systematic review of case reports. United European Gastroenterol. J. 9, 332–342 (2021).
Xue, G. et al. Three Klebsiella species as potential pathobionts generating endogenous ethanol in a clinical cohort of patients with auto-brewery syndrome: a case control study. EBioMedicine 91, 104560 (2023).
Dinis-Oliveira, R. J. The auto-brewery syndrome: a perfect metabolic “storm” with clinical and forensic implications. J. Clin. Med. 10, 4637 (2021).
Malik, F., Wickremesinghe, P. & Saverimuttu, J. Case report and literature review of auto-brewery syndrome: probably an underdiagnosed medical condition. BMJ Open Gastroenterol. 6, e000325 (2019).
Dahshan, A. & Donovan, K. Auto-brewery syndrome in a child with short gut syndrome: case report and review of the literature. J. Pediatr. Gastroenterol. Nutr. 33, 214–215 (2001).
Welch, B. T., Coelho Prabhu, N., Walkoff, L. & Trenkner, S. W. Auto-brewery syndrome in the setting of long-standing Crohn’s disease: a case report and review of the literature. J. Crohns Colitis 10, 1448–1450 (2016).
Yuan, J. et al. Fatty liver disease caused by high-alcohol-producing Klebsiella pneumoniae. Cell Metab. 30, 675–688.e7 (2019).
Li, N. N. et al. High alcohol-producing Klebsiella pneumoniae causes fatty liver disease through 2,3-butanediol fermentation pathway in vivo. Gut Microbes 13, 1979883 (2021).
Meijnikman, A. S., Nieuwdorp, M. & Schnabl, B. Endogenous ethanol production in health and disease. Nat. Rev. Gastroenterol. Hepatol. 21, 556–571 (2024).
Meadows, V., Antonio, J. M., Ferraris, R. P. & Gao, N. Ruminococcus gnavus in the gut: driver, contributor, or innocent bystander in steatotic liver disease?. FEBS J. 292, 1252–1264 (2025).
Clark, D. P. The fermentation pathways of Escherichia coli. FEMS Microbiol. Rev. 5, 223–234 (1989).
Fusco, W. et al. Short-chain fatty-acid-producing bacteria: key components of the human gut microbiota. Nutrients 15, 2211 (2023).
Mills, R. H. et al. Multi-omics analyses of the ulcerative colitis gut microbiome link Bacteroides vulgatus proteases with disease severity. Nat. Microbiol. 7, 262–276 (2022).
Nelson, M. E. & Werkman, C. H. Dissimilation of glucose by heterofermentative lactic acid bacteria. J. Bacteriol. 30, 547–557 (1935).
Rendon, J. et al. Demethylmenaquinol is a substrate of Escherichia coli nitrate reductase A (NarGHI) and forms a stable semiquinone intermediate at the NarGHI quinol oxidation site. Biochim. Biophys. Acta 1847, 739–747 (2015).
Henningsen, B. M. et al. Increasing anaerobic acetate consumption and ethanol yields in Saccharomyces cerevisiae with NADPH-specific alcohol dehydrogenase. Appl. Environ. Microbiol. 81, 8108–8117 (2015).
Ianiro, G. et al. Variability of strain engraftment and predictability of microbiome composition after fecal microbiota transplantation across different diseases. Nat. Med. 28, 1913–1923 (2022).
Whistance, G. R. & Threlfall, D. R. Effect of anaerobiosis on the concentrations of demethylmenaquinone, menaquinone and ubiquinone in Escherichia freundii, Proteus mirabilis and Aeromonas punctata. Biochem. J. 108, 505–507 (1968).
Peterson, J. D. & Ingram, L. O. Anaerobic respiration in engineered Escherichia coli with an internal electron acceptor to produce fuel ethanol. Ann. N. Y. Acad. Sci. 1125, 363–372 (2008).
Vandekerckhove, E., Janssens, F., Tate, D. & De Looze, D. Treatment of gut fermentation syndrome with fecal microbiota transplantation. Ann. Intern. Med. 173, 855 (2020).
Casañas-Martínez, M. et al. Fecal microbiota transplantation in a long-standing auto-brewery syndrome with complex symptomatology. J. Hepatol. 82, e186–e188 (2025).
Gan, L. et al. Bacteriophage targeting microbiota alleviates non-alcoholic fatty liver disease induced by high alcohol-producing Klebsiella pneumoniae. Nat. Commun. 14, 3215 (2023).
Meijnikman, A. S. et al. Microbiome-derived ethanol in nonalcoholic fatty liver disease. Nat. Med. 28, 2100–2106 (2022).
Hafez, E. M., Hamad, M. A., Fouad, M. & Abdel-Lateff, A. Auto-brewery syndrome: ethanol pseudo-toxicity in diabetic and hepatic patients. Hum. Exp. Toxicol. 36, 445–450 (2017).
Zhu, L. et al. Characterization of gut microbiomes in nonalcoholic steatohepatitis (NASH) patients: a connection between endogenous alcohol and NASH. Hepatology 57, 601–609 (2013).
Youngster, I. et al. Oral, capsulized, frozen fecal microbiota transplantation for relapsing Clostridium difficile infection. JAMA 312, 1772–1778 (2014).
Riwes, M. M. et al. Feasibility of a dietary intervention to modify gut microbial metabolism in patients with hematopoietic stem cell transplantation. Nat. Med. 29, 2805–2813 (2023).
Klingbeil, E. A., Cawthon, C., Kirkland, R. & de La Serre, C. B. Potato-resistant starch supplementation improves microbiota dysbiosis, inflammation, and gut-brain signaling in high fat-fed rats. Nutrients 11, 2710 (2019).
Suez, J. et al. Post-antibiotic gut mucosal microbiome reconstitution is impaired by probiotics and improved by autologous FMT. Cell 174, 1406–1423.e16 (2018).
Demir, M. et al. The fecal mycobiome in non-alcoholic fatty liver disease. J. Hepatol. 76, 788–799 (2022).
Ferraris, R. P., Yasharpour, S., Lloyd, K. C., Mirzayan, R. & Diamond, J. M. Luminal glucose concentrations in the gut under normal conditions. Am. J. Physiol. 259, G822–G837 (1990).
Marotz, C. et al. SARS-CoV-2 detection status associates with bacterial community composition in patients and the hospital environment. Microbiome 9, 132 (2021).
iMSMS Consortium Gut microbiome of multiple sclerosis patients and paired household healthy controls reveal associations with disease risk and course. Cell 185, 3467–3486.e16 (2022).
Beghini, F. et al. Integrating taxonomic, functional, and strain-level profiling of diverse microbial communities with bioBakery 3. eLife 10, e65088 (2021).
Blanco-Míguez, A. et al. Extending and improving metagenomic taxonomic profiling with uncharacterized species using MetaPhlAn 4. Nat. Biotechnol. 41, 1633–1644 (2023).
Truong, D. T., Tett, A., Pasolli, E., Huttenhower, C. & Segata, N. Microbial strain-level population structure and genetic diversity from metagenomes. Genome Res. 27, 626–638 (2017).
Scholz, M. et al. Strain-level microbial epidemiology and population genomics from shotgun metagenomics. Nat. Methods 13, 435–438 (2016).
Podlesny, D. et al. Metagenomic strain detection with SameStr: identification of a persisting core gut microbiota transferable by fecal transplantation. Microbiome 10, 53 (2022).
Andrews, S. FastQC: A Quality Control Tool for High Throughput Sequence Data (Bahbraham Bioinformatics, 2010); https://www.bioinformatics.babraham.ac.uk/projects/fastqc/
Bushnell, B. BBMap: A Fast, Accurate, Splice-Aware Aligner (Lawrence Berkeley National Laboratory, 2014); https://escholarship.org/uc/item/1h3515gn
Callahan, B. J. et al. DADA2: high-resolution sample inference from Illumina amplicon data. Nat. Methods 13, 581–583 (2016).
Mallick, H. et al. Multivariable association discovery in population-scale meta-omics studies. PLoS Comput. Biol. 17, e1009442 (2021).
Acknowledgements
This study was supported by National Institutes of Health (NIH) grants R00 AA031328 and T32 DK007202, grant number CTORA23-208366 from the American Association for the Study of Liver Diseases Foundation, and a Pilot and Feasibility Award from the Southern California Research Center for ALPD and Cirrhosis funded by the National Institute on Alcohol Abuse and Alcoholism of the NIH P50AA011999 (to C.L.H.); in part by NIH grants R01 AA031710, R21 AA031410, R01 AA024726, R01 AA020703 and U01 AA026939; by Award Number BX004594 from the Biomedical Laboratory Research & Development Service of the VA Office of Research and Development (to B.S.); and services provided by NIH centres P50 AA011999 and the San Diego Digestive Diseases Research Center P30 DK120515. This study was supported in part by NIH grants R01 AA029106, R21 AA030654, P30 AR073761 and the D34 HP31027 UCSD’s Hispanic Center of Excellence, and by the Isenberg Endowed Fellowship jointly awarded by the Pilot/Feasibility Program of the San Diego Digestive Diseases Research Center the Hellman Family Foundation (P30 DK120515) (to C.L.). This study was also supported by the Joint BioEnergy Institute, US Department of Energy, Office of Science, Biological and Environmental Research Program under Award Number DE-AC02-05CH11231. This publication includes data generated at the UCSD Institute for Genomic Medicine Genomics Center using an Illumina NovaSeq X Plus that was purchased with funding from a National Institutes of Health Shared Instrument Grant grant (S10 OD026929).
Author information
Authors and Affiliations
Contributions
C.L.H. was responsible for the study concept and design, data collection, data analysis and interpretation, and the writing and editing of the paper. S.S., L.F., A.C.C., Y.Y., R.B., F.R.T., N.C. and H.G.L. performed experiments and data analysis. S.L., M.D., S.M., V.M. and B.J.C. were responsible for patient coordination and collating patient clinical data. P.S., C.L., B.O.P., C.M. and B.S.B. supervised the data analysis. E.H. performed FMT and was responsible for the data analysis, interpretation and editing of the paper. B.S. was responsible for the study concept and design, editing the paper and study supervision.
Corresponding authors
Ethics declarations
Competing interests
B.S. has been consulting for Ambys Medicines, Boehringer Ingelheim, Ferring Research Institute, Gelesis, HOST Therabiomics, Intercept Pharmaceuticals, Mabwell Therapeutics, Patara Pharma, Surrozen and Takeda. The institution of B.S., UCSD, has received research support from Axial Biotherapeutics, BiomX, CymaBay Therapeutics, Intercept, NGM Biopharmaceuticals, Prodigy Biotech and Synlogic Operating Company. B.S. is founder of Nterica Bio. E.H. has received research support from Seres Therapeutics and MicrobiomeX/Tend. B.S.B. has received research support from Mirador, Gilead and Merck and has been consulting for Abbvie, Merck and Celltrion. The other authors declare no competing interests.
Peer review
Peer review information
Nature Microbiology thanks Gang Fang, Jing Yuan and the other, anonymous, reviewer(s) for their contribution to the peer review of this work.
Additional information
Publisher’s note Springer Nature remains neutral with regard to jurisdictional claims in published maps and institutional affiliations.
Extended data
Extended Data Fig. 1 Gut microbiota is characterized by taxonomic differences in patients with Auto-brewery Syndrome.
(a) Relative abundance of gut bacteria at the family level in patients with Auto-brewery Syndrome in remission or during a flare, their household partners (HHP), and healthy controls (HC). Each column represents one subject and the relative abundance of conditions with more than one sample were averaged. (b) Top 15 contributing species for axis 1 and 2 of the principal component analysis shown in (Fig. 2e) and % contribution. (c) Microbial species significantly associated with the “Flare” condition (q < 0.05) as determined by MaAsLin2. Red dots indicate species with increased relative abundance in “Flare” compared to healthy controls (HC), household partners (HHP), or remission, while blue dots represent species with decreased relative abundance compared to other conditions. Dot size is proportional to the significance of the association, represented by the negative logarithm of the q-value. (d-f) Relative abundance of top three species over-abundant in patients in a flare: Ruminococcus gnavus (d), Escherichia coli (e), and Klebsiella pneumoniae (f). (HC, n = 22; HHP, n = 21; Remission, n = 22; Flare, n = 26). For all boxplots, the midline represents the median, the boxes represent the interquartile range (IQR) and the whiskers represent the range. Comparative statistical analyses were done with two-sided Wilcoxon rank sum tests between two groups and Kruskal-Wallis tests between all groups.
Extended Data Fig. 2 Bacterial rather than fungal shifts underpin ABS pathophysiology.
(a) Relative abundance of gut fungi at the phyla level in patients with clinically documented Auto-brewery Syndrome (ABS) in remission or during a flare or their household partners (HHP). Each column represents one patient or household partner. (b) Principal component analysis (PCoA) of the relative abundance of gut fungal species in patients with ABS in remission or flare or HHPs. P-value calculated by PERMANOVA. (c) Representative figures of stool from a patient with ABS and their HHP cultured in YPD media and grown on YPD plates for 48 h, next to a negative and positive control (Candida albicans).
Extended Data Fig. 3 Increased abundance of Proteobacteria alone is not sufficient for pathologic gut microbial ethanol production.
Ethanol measured in microbiota cultures from healthy controls (HC, n = 15), patients with ulcerative colitis (UC, n = 20), patients with Crohn’s disease (CD, n = 20), and patients with Auto-brewery Syndrome during a flare (ABS, n = 5) at 24 h. The same samples from patients with ABS were cultured and measured in Fig. 1, and freshly cultured and measured together with control and inflammatory bowel disease samples here. For all boxplots, the midline represents the median, the boxes represent the interquartile range (IQR) and the whiskers represent the range. Comparative statistical analyses were done with two-sided Wilcoxon rank sum tests between two groups and Kruskal-Wallis tests between all groups.
Extended Data Fig. 4 Metabolic pathway analysis reveals differences in gut microbial function.
(a-f) Abundance of different metabolic pathways: mixed acid fermentation pathway (a), heterolactic fermentation pathway (b), ethanolamine utilization pathway (c), acetylene degradation pathway (d), demethylmenaquinol 6 biosynthesis pathway (e), and TCA cycle (acetate producers) (f). (HC, n = 22; HHP, n = 21; Remission, n = 22; Flare, n = 26). For all boxplots, the midline represents the median, the boxes represent the interquartile range (IQR) and the whiskers represent the range. Grey lines connect samples within the same household. Comparative statistical analyses were done with two-sided Wilcoxon signed-rank tests between paired samples from the same household, with two-sided Wilcoxon rank sum tests between HC and Flare, and Kruskal-Wallis tests between all groups.
Extended Data Fig. 5 Mixed acid and heterolactic fermentation pathway enrichment in ABS.
Relative abundance of the Kyoto Encyclopedia of Genes and Genomes (KEGG) Orthology (KO) genes contributing to the mixed acid fermentation pathway and heterolactic fermentation pathway in patients with clinically documented Auto-brewery Syndrome in remission or during a flare or their household partners (HHP). (HHP, n = 21; Remission, n = 22; Flare, n = 26). For all boxplots, the midline represents the median, the boxes represent the interquartile range (IQR) and the whiskers represent the range. Comparative statistical analyses were done with two-sided Wilcoxon rank sum tests between two groups and Kruskal-Wallis tests between all groups. PEP, phosphoenolpyruvate.
Extended Data Fig. 6 Ethanolamine utilization pathway enrichment in ABS.
Relative abundance of the KEGG Orthology (KO) genes contributing to the ethanolamine utilization pathway in patients with clinically documented Auto-brewery Syndrome in remission or during a flare or their household partners (HHP). (HHP, n = 21; Remission, n = 22; Flare, n = 26). For all boxplots, the midline represents the median, the boxes represent the interquartile range (IQR) and the whiskers represent the range. Comparative statistical analyses were done with two-sided Wilcoxon rank sum tests between two groups and Kruskal-Wallis tests between all groups.
Extended Data Fig. 7 Ethanol-producing pathway and gene enrichment in ABS.
(a) Stacked pathway enrichment contribution by mixed acid fermentation pathway, heterolactic fermentation pathway, acetylene degradation pathway, or ethanolamine utilization pathway in patients with Auto-brewery Syndrome in remission or during a flare or their household partners (HHP). The dashed line represents the mean of the sum of relative abundance of all metabolic pathways that contribute to ethanol production in healthy controls. (b) Relative attribution of bacterial species to the mixed acid fermentation pathway, heterolactic fermentation pathway, acetylene degradation pathway, or ethanolamine utilization pathway in patients with Auto-brewery Syndrome in remission or during a flare or their household partners (HHP). (c) Total gene counts related to alcohol dehydrogenase activity (GO:0004022) in the top 6 species responsible (Escherichia coli, Klebsiella pneumoniae, Alistipes putredinis, Ruminococcus gnavus, Blautia wexlerae, and Blautia obeum) and blood alcohol concentration at the time of stool collection. Spearman’s rho and a two-sided p-value for the correlation are provided. Grey color depicts 95% confidence interval.
Extended Data Fig. 8 Fecal acetate correlates with blood alcohol and bacterial composition in ABS.
(a) Concentration of acetate in fecal samples from patients with Auto-brewery Syndrome in a flare (Flare, n = 17) and household partners (HHP, n = 17). The midline represents the median, the boxes represent the interquartile range (IQR) and the whiskers represent the range. Comparative statistical analysis was done with two-sided Wilcoxon rank sum tests between two groups. (b) Spearman correlation of blood alcohol concentration of subject at time of stool collection and fecal acetate levels. Spearman’s rho and a two-sided p-value for the correlation are provided. Grey color depicts 95% confidence interval. (c) Heatmap of Spearman correlation coefficient between fecal acetate and top 15 most abundant bacterial genera. Spearman’s rho and two-sided p-values for each correlation after adjustment by the Benjamini-Hochberg method are provided. Asterixis represents adjusted p-value < 0.05. (d) Principal component analysis demonstrating beta diversity of fecal metabolites in patient in a flare (Flare) and their household partners (HHP). (e) Volcano plot of fecal metabolites detected in >95% of samples, with log2 of fold change of Flare vs HHP on the x-axis and -log10 of adjusted p-value (by the Benjamini-Hochberg method) on the y-axis. Significant fecal metabolites with log2(Fold change) >1 and adjusted p-value < 0.05 are in red and labeled.
Extended Data Fig. 9 Strain engraftment during FMT aligns with clinical changes in ABS.
(a) Timeline of biospecimen collection from the patient who received FMT, in relation to first FMT. (b) Phylogenetic tree (left) and multiple sequence alignment (right) of shared genomes of Escherichia coli strains from samples collected from the patient who received FMT, identified by StrainPhlan. (c) Longitudinal analysis of percent shared gut microbial strains with initial pre-FMT sample, donor sample, and percent donor engraftment (shared with donor and not with initial pre-FMT sample), over the course of two FMTs.
Extended Data Fig. 10 Ethanol‑producing E. coli from ABS patient exhibit enhanced ethanol tolerance.
Growth curves of E. coli strains isolated from ABS patient A20 and FMT donor in cultures (n = 3 with two technical replicates) containing increasing concentrations of ethanol. Comparative statistical analyses were done with two-sided Wilcoxon rank sum tests between two groups and asterisks indicate p-value < 0.001 at the 24-hour time point.
Supplementary information
Supplementary Tables (download XLSX )
Supplementary Table 1: Patient lifestyle survey. Supplementary Table 2: Bacterial species Maaslin2 results. Supplementary Table 3: Fungal ITS2 Maaslin2 results. Supplementary Table 4: Metabolic pathway Maaslin2 results.
Rights and permissions
Springer Nature or its licensor (e.g. a society or other partner) holds exclusive rights to this article under a publishing agreement with the author(s) or other rightsholder(s); author self-archiving of the accepted manuscript version of this article is solely governed by the terms of such publishing agreement and applicable law.
About this article

Cite this article
Hsu, C.L., Shukla, S., Freund, L. et al. Gut microbial ethanol metabolism contributes to auto-brewery syndrome in an observational cohort. Nat Microbiol 11, 415–428 (2026). https://doi.org/10.1038/s41564-025-02225-y
Received:
Accepted:
Published:
Version of record:
Issue date:
DOI: https://doi.org/10.1038/s41564-025-02225-y
