
Abstract
Accumulated carbon storage is a crucial indicator for assessing the health of mangrove ecosystems and can suitably reflect the changes in the carbon sequestration capacity of mangrove forests over time. Unlike carbon stock for a specific year, accumulated carbon storage measures the capacity for continuous carbon sequestration in mangroves; however, spatially explicit datasets and maps on mangrove accumulated carbon storage are yet lacking on a global scale. This study pioneered the development of a global gridded dataset of mangrove accumulated carbon storage (2000–2020) at a 1 km resolution, by utilizing the most recent high-precision mangrove distribution data from the Global Mangrove Watch. This dataset captures the spatiotemporal heterogeneity of mangrove accumulated carbon storage and pinpoints hotspots of accumulated carbon stock changes at both global and regional levels. The outcomes can help identify areas requiring protection and restoration efforts, as well as prioritize policy interventions, thereby promoting the sustainable management of mangrove ecosystems worldwide.
Background & Summary
Mangrove ecosystems constitute one of the most significant carbon reservoirs in the world1,2. Despite occupying only 0.36% of the global forest area3, mangroves own a prominent carbon sequestration capacity per unit area, nearly four times larger than that of terrestrial forest ecosystems4. Furthermore, as a vital component of blue carbon ecosystems, mangroves contribute 10% to 15% of coastal marine carbon stocks5. However, intensified anthropogenic activities, such as aquaculture and agricultural farming, resulted in substantial losses of mangroves worldwide and hence significantly affected mangrove carbon storage4,6 Research has shown that every 1% reduction in global mangrove forests will result in a loss of 199.6 billion tons of carbon, thus jeopardizing the efforts of climate change mitigation4. Given the crucial role of mangrove forests in coping with climate change, some countries, such as Indonesia, the Philippines, and Senegal, have explicitly incorporated the protection and restoration of mangrove ecosystems into their Nationally Determined Contributions (NDCs) as part of their commitments under the Paris Agreement7,8. However, a number of countries are yet to include mangroves in their NDCs, highlighting the need for further integration of mangrove protection in climate action plans7,8. Quantifying and protecting mangrove carbon stocks of world regions, which serves as a critical indicator for assessing the health of mangrove ecosystems, has gained momentum in global climate negotiations9,10,11,12. Particularly, the accurate accounting of mangrove carbon stock is a prerequisite for formulating effective conservation and restoration solutions13,14.
Since mangrove forests are mostly distributed in tropical and subtropical regions, previous research on mangrove carbon stocks was mainly conducted at the national or regional scales2,15. Donato et al.2 quantified the carbon stock of the Indo-Pacific mangrove ecosystem by measuring biomass and soil carbon across 25 mangrove forests in 30 districts of the Indo-Pacific region, using field measurements as the key approach. However, as acknowledged in their research, the lack of global mangrove distribution data has posed severe challenges for accurate assessment at the global scale, and mangroves along the major ocean coasts of 118 countries were overlooked in that study2. To fill the gap, Atwood et al.9 adopted a different approach by overlaying NDVI data onto marine ecoregions to determine global mangrove distribution and by compiling soil carbon data from 1,230 mangrove sampling sites across 48 countries from existing studies. Nevertheless, as pointed out by Atwood et al.9, data inconsistencies from disparate datasets and methods may lead to variations in data quality across countries, resulting in high uncertainties at the macro scale. To minimize the uncertainty, they rated the quality of the datasets from each country in the process of producing this comprehensive global map of mangrove soil carbon.
Recent progress in satellite-based remote sensing techniques has facilitated the availability of high-resolution long-term global datasets on mangrove distribution16,17,18,19, which provides essential data products for investigating mangrove carbon stocks such as soil carbon and above-ground biomass10,11,20. These studies generally use regional extrapolation methods to create relevant maps by combining field-measured sample data with machine learning tools to extend estimates across entire regions. For instance, Sanderman et al.11 incorporated a wide range of covariates into an Organic Carbon Density (OCD) model, generating a high-resolution global dataset for mangrove soil carbon density in 2000. Similarly, Simard et al.10 integrated factors such as cyclones, rainfall, and canopy height to release a high-precision dataset of global mangrove above-ground biomass for the year 2000. These two datasets are widely utilized due to their high spatial resolution and accuracy. Rather than focusing on specific sub-pools of carbon pools, Hamilton et al.21 estimated global mangrove carbon stock losses caused by the changes in mangrove areas from 2000 to 2012, by using the high-precision global mangrove distribution data and following the IPCC inventory method21,22. A similar attempt was also undertaken by Richards et al.23, which estimated the net change in global mangrove carbon stocks resulting from land cover changes between 1996 and 2016, by analyzing mangrove deforestation and afforestation as well as the proportional changes in carbon stocks during periods of loss and gain. However, as noted in that work, their study focused on quantifying changes in net carbon stocks rather than carbon sequestration capacity23. Measuring net carbon stocks alone can not directly reflect the trend of loss of carbon sequestration capacity caused by changes in mangrove areas. In contrast, estimating accumulated carbon storage may provide a new and supplementary perspective on ecosystem health over time and ecological services such as carbon sequestration. This is critical for informing mangrove conservation strategies at global and regional scales and advancing ecosystem restoration initiatives.
In this study, we pioneered the estimation of global mangrove accumulated carbon storage from 2000 to 2020 at a 1 km resolution. By following the IPCC Carbon Pooling Guidelines22, a spatially explicit dataset was developed to assess the impact of mangrove extent changes on carbon sequestration capacity. By examining the spatiotemporal changes in accumulated carbon storage, this work may have essential implications for identifying vulnerable areas where protection efforts are needed and for assessing the effectiveness of global policy interventions on mangrove restoration.
Methods
-
Overall framework. In this study, we used ‘baseline total carbon stock’ to represent the carbon stock in the baseline year (2000) and used ‘accumulated carbon storage’ to describe the accumulated changes in total carbon storage from the baseline year to the target year due to biomass increments. Figure 1 shows the overall framework of calculating the global mangrove accumulated carbon storage from 2000 to 2020. Firstly, the spatial distribution24, above-ground biomass density25, and soil carbon density data of mangroves in the base year were utilized to calculate the baseline total carbon stock of global mangroves in 2000 using the IPCC inventory method22,26. Secondly, the increment of global mangrove biomass from 2000 to 2020 was calculated. Lastly, the historical accumulated carbon storage of global mangroves for the period 2000–2020 was obtained based on the baseline total carbon stock and biomass increments27. The data used in this study are presented in Table 1.
Fig. 1 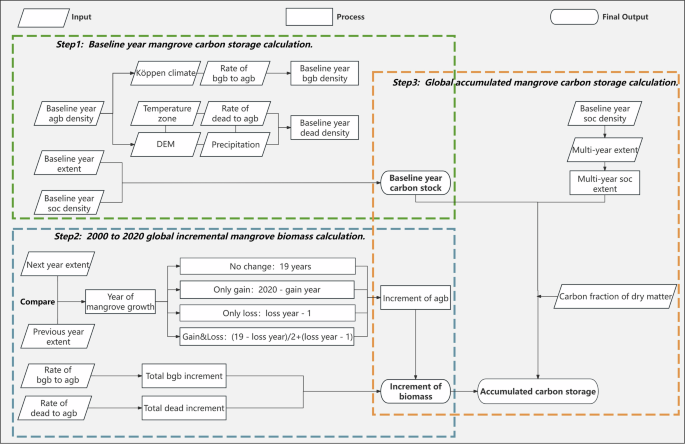
Overall methodological framework of calculating the accumulated carbon storage of mangroves.
Table 1 Data sources and descriptions. -
Baseline total carbon stock and changes in global mangrove area between 2000 and 2020. This study employs the 2000 mangrove distribution data from the United States Geological Survey (USGS) as the baseline24. As clarified by Giri et al.19, while the classification errors of the USGS dataset have not been explicitly documented, the use of consistent methodologies and advanced mapping techniques allows the detection of mangrove patches as small as 0.08 ha, which is especially suitable for estimating mangrove carbon stocks. Furthermore, the above-ground biomass (AGB) and soil organic carbon (SOC) data used in this study are also based on the 2000 mangrove distribution data provided by the USGS10,11,19. In addition, the Global Mangrove Watch (GMW) dataset27, which provides mangrove distribution data for 1996, 2007–2010, and 2015–2020 with an accuracy of 87.4%, explicitly utilizes the USGS data as a reference for training and validation16,19. Since the Global Mangrove Watch (GMW) dataset does not include data for the baseline year 200016, we therefore used the mangrove distribution data from the USGS for the year 2000 instead to calculate the baseline total carbon stock24. These two datasets have the same LUCC definition for mangroves, thus avoiding potential misalignment of mangrove distribution under different datasets. The global mangrove carbon stock in 2000 as the baseline year was calculated by dividing the mangrove carbon pool into four sub-pools: above-ground biomass, below-ground biomass, soil carbon, and dead organic matter carbon pools, as presented in Eq. (1):

where Carbon stock represents the global mangrove baseline total carbon stock (Mg); A refers to the mangrove area (ha); AGBd is the above-ground biomass density (Mg/ha); BGBd is the below-ground biomass density (Mg/ha); DEADd is the dead organic matter density (Mg/ha), and SOCd represents the soil carbon density (Mg/ha).
Mangrove distribution maps for other years were obtained from the GMW dataset27. To obtain the land use change of mangroves from 2000 to 2020, we referred to the study by Harris et al.28 and classified land use change into four types: (1) Only loss; (2) Only gain; (3) Both gain and loss; (4) No change during 2000–2020. According to Harris et al.28, ‘Loss’ includes all observable disturbances (natural and anthropogenic) in the imagery; ‘Gain’ refers to the transition from non-forest areas to mangrove forests; ‘Both gain and loss’ includes plots where both gain and loss occur simultaneously due to forest management or other forms of disturbance and regrowth.
Due to the lack of mangrove land use data for 2001–2006 and 2011–201427, we divided the mangrove land use change from 2000 to 2020, as shown in Fig. 2, into four phases based on existing data availability: Phase I (2000–2007), Phase II (2007–2010), Phase III (2010–2015), and Phase IV (2015–2020).

Classification of global mangrove carbon accumulation based on land use change from 2000 to 2020. E represents the change in mangrove spatial distribution between years. For example, ‘E0007’ refers to mangrove distribution data for 2007 minus that for 2000. When overlaying distribution data for two years, three possible outcomes will emerge: ‘og’ (1), ‘ol’ (−1), and ‘nolg’ (0). Specifically, ‘og’ represents areas with mangrove gain (coded as 1); ‘ol’ indicates areas of only loss (coded as −1); ‘nolg’ indicates areas with no mangrove change (coded as 0). Besides, when distribution data for consecutive years are overlaid, ‘lg’ indicates areas with both gains and losses, with a code range of (−1,0,1).
Phase I (2000–2007, 7 years)
Due to the lack of mangrove distribution data during 2001–2006, we used the median year and assumed that ‘Only loss’ and ‘Only gain’ occurred in 2004. According to Alongi et al.29, mangrove forests exhibit a high carbon accumulation rate during the early growth stage. However, this rate can be influenced by environmental conditions such as salinity, tides, and sediment supply, as well as anthropogenic activities such as logging and pollution4,6, which may significantly affect early-stage carbon accumulation. Therefore, we only calculated the carbon accumulation rate for ‘Only loss’ after its loss, resulting in an accumulation period of 2.5 years for ‘Only loss’ in Phase I. The ‘Both gain and loss’ scenario could not be considered in this phase (Table 2).
Phase II (2007–2010, 3 years)
Using the mangrove distribution data for this period, we identified the specific years of ‘Only gain’ and ‘Only loss’ by code and included the ‘Both gain and loss’ scenario. In Phase II, the carbon accumulation year for ‘Only gain’ mangrove is calculated as ‘2010 minus the year of gain’ (2010 - gain year), and the carbon accumulation year for ‘Only loss’ is calculated as ‘the year of loss minus 2007 minus 1’ (loss year - 2007 - 1). Details of the ‘Both gain and loss’ scenario are provided in Table 3.
Phase III (2010–2015, 5 years)
Similar to Phase I, due to the lack of mangrove distribution data from 2011 to 2014, we chose the median year and assumed that ‘Only loss’ and ‘Only gain’ occurred in 2013. Therefore, in Phase III, the carbon accumulation period of the ‘Only gain’ region is 2 years, and that for the ‘Only loss’ region is 1 year (Table 4).
Phase IV (2015–2020, 5 years)
Similar to Phase II, we identified specific years for ‘Only gain’ and ‘Only loss’ from successive mangrove distribution data and included the ‘Both gain and loss’ scenario. In Phase IV, the carbon accumulation year for mangroves classified as ‘Only gain’ is ‘2020 minus the year of gain’ (2020 - gain year), while the carbon accumulation year for ‘Only loss’ is ‘the year of loss minus 2015 minus 1’ (loss year - 2015 - 1). Details of the ‘Both gain and loss’ scenario (Table 5).
-
Below-ground biomass and dead organic matter carbon density in mangroves. In this study, regarding the carbon density of below-ground biomass in the baseline period, it was generated by using the ratio of below-ground to above-ground biomass in the IPCC report and by overlaying above-ground biomass density data on the Köppen climate zone data10,22,30. Since most mangroves were distributed along the coastline, the original Köppen climate data could not fully cover the distribution range of mangroves. Therefore, we interpolated the original Köppen climate data to make it fit with the mangrove range30. Then, the obtained data were clipped, masked and extracted to generate the climate data that are consistent with the distribution range of mangroves in 200024. Subsequently, the data of below-ground biomass density in 2000 were obtained through geospatial overlay analysis (Table 6)22. The annual mangrove distribution data classified by climate zone and above-ground biomass increment data were overlaid on the baseline carbon density data, and the accumulated below-ground biomass of mangroves was afterwards calculated. Additionally, this approach was also used for the base period and accumulated carbon density of dead organic matter. We adopted the ratio of dead organic matter to above-ground biomass, as outlined in Table 7 from the United Nations Framework Convention on Climate Change (UNFCCC)31, and combined global elevation, rainfall, and temperature zone data to obtain the dead organic matter data32,33,34.
-
Loss and gain of carbon storage in mangroves. In the mangrove ecosystem, soil carbon accounts for the majority of the total carbon stock. However, soil carbon is relatively stable and does not undergo significant changes over short periods9. As stated in the Tier 1 method of the IPCC guidelines22, forest soil carbon stocks are assumed to remain unchanged with management. Moreover, as proposed in the IPCC guidelines22, when Tier 2 or 3 activity data are used, it is unnecessary to take into account carbon stock changes for mineral soils (i.e., the change in soil organic carbon stocks is assumed to be zero). Therefore, this study utilizes the 2000 soil carbon data provided by Sanderman et al.11 as the baseline and does not calculate changes in soil carbon values. Instead, we focused on spatial pattern changes resulting from variations in mangrove extent. Consequently, this study will concentrate on the changes in carbon storage resulting from variations in biomass (above-ground biomass, below-ground biomass, and dead organic matter). Based on the mangrove land use changes, we obtained the duration of mangrove carbon accumulation in each historical patch and calculated the corresponding mangrove accumulated carbon storage. Meanwhile, the IPCC report provides data on the average annual increment in above-ground biomass of mangroves (Table 8)22. Following Eq. 2, the total growth of global mangrove biomass during 2000–2020 can be obtained as:
$${G}_{{total}(i)}=\sum _{i}\left[{G}_{w}\times \left(1+{R}_{1}+{R}_{2}\right)\right]$$(2)where Gtotal(i) represents the total growth of above-ground biomass, below-ground biomass (Mg), and dead organic matter (Mg/ha); i represent the specific year of mangrove biomass accumulation (yr); Gw is the average annual increment of above-ground biomass (Mg/ha/yr); R1 is the ratio of below-ground to above-ground biomass; and R2 is the ratio of dead organic matter to above-ground biomass.
-
Global distribution of mangrove accumulated carbon storage from 2000 to 2020. By combining the global mangrove baseline total carbon stock with the mangrove biomass increment within the period, the accumulated carbon storage from 2000 to 2020 can be calculated following Eq. 3. To obtain accurate geospatial data of accumulated carbon storage for specific years, we used the mangrove distribution data of the corresponding years to mask and crop the calculated accumulated carbon storage27.
Table 5 2015–2020: The growth period of mangroves. Table 6 The ratio of below-ground biomass to above-ground biomass in mangroves22. Table 7 The ratio of dead organic matter to above-ground biomass in mangroves31. Table 8 The average annual increment of above-ground biomass in mangroves22.
where Carbon storage(2000+i) represents the global accumulated carbon storage of mangroves for the year 2000+i (Mg); i represents the time period of mangrove biomass accumulation (yr); Carbon stock2000 is the global mangrove baseline total carbon stock (Mg); A denotes the mangrove area (ha); Gtotal(i) indicates the total growth of above-ground biomass, below-ground biomass, and dead organic matter during the time period (Mg/ha); CF is the carbon fraction of dry matter (tonne of carbon/tonne of dry matter) (CF refers to the value for mangroves in the IPCC report22, CF = 0.45).
The accumulated global mangrove carbon storage dynamics and contributions of different countries during 2000–2020 are shown in Fig. 3. The global total mangrove carbon stock in 2000 was approximately 8051 Mt, with the top 11 countries accounting for 68.7% of this gross carbon stock. Of these countries, Indonesia occupied a quarter of the total, while Australia and Brazil ranked second and third, with a share of 6.48% and 6.47%, respectively. From 2000 to 2020, the global accumulated mangrove carbon storage showed an increasing trend, reaching an amount of 9330 - 10766 Mt. In particular, the accumulated carbon storage of India’s mangroves has increased nearly four times since 2000 and surpassed Venezuela in the amount. Meanwhile, Mexico’s mangrove carbon stock in 2000 accounted for about 3.9% of the global total, while by 2020 this share had nearly doubled to 7%. Similar to Mexico, countries such as Nigeria and Bangladesh have witnessed an increase in their contribution to accumulated carbon storage, with Nigeria’s contribution rising from 5.9% to 7.5% and Bangladesh’s contribution from 2.3% to 4%. In addition, some countries with comparatively fewer mangrove resources, such as China and Colombia, have also demonstrated a gradual increase in their contributions to the global total. As shown in Fig. 3(b,d), the percentage of all these countries altogether (classified as ‘Others’) has increased from 31.3% to 31.9%. This indicates that mangrove ecosystems worldwide have been given varying degrees of attention. Countries with substantial carbon stocks (e.g., Myanmar, Bangladesh), as well as those that have smaller mangrove extents (e.g., Colombia and Mozambique) have increasingly prioritized the conservation and restoration of mangrove ecosystems35,36. Overall, during the period 2000–2020, the contribution of mangrove carbon stocks to the global total generally increased for most countries, while the global mangrove accumulated carbon storage also showed significant spatial heterogeneity.

Distribution maps of total mangrove accumulated carbon storage from 2000 to 2020. (a) Distribution of mangrove baseline carbon storage in 2000, with countries colored by climatic zones. (b) The global proportion of mangrove carbon stock in each country in 2000. (c) Distribution of mangrove accumulated carbon storage from 2000 to 2020, with countries colored by climatic zones. (d) The global proportion of mangrove accumulated carbon storage in each country between 2000 and 2020. (e) Proportion of mangrove baseline carbon storage in each sub-pool in 2000, including above-ground biomass, below-ground biomass, dead organic matter, and soil carbon.
In terms of climate zones, tropical mangroves dominated the global accumulated carbon storage, accounting for 85% of the total (Table 9). Mangroves in the tropical wet climate zone exhibited relatively stable carbon density values, ranging from 679 Mg/ha to 706 Mg/ha, while those in the tropical dry climate zone had lower carbon density. In contrast, mangroves in the subtropical climate zone experienced a substantial increase in carbon density, reaching 960 Mg/ha by 2020, demonstrating a significant enhancement in carbon accumulation capacity, which is consistent with earlier studies2,37. As shown in Fig. 3(e), the composition of mangrove carbon pools across countries indicates that Indonesia, located in the tropical zone, shows an absolute advantage in both above-ground and below-ground biomass, with above-ground biomass being the most abundant. Soil carbon typically serves as the biggest contributor; however, it is not the only determinant of the total carbon stock. For example, although Cuba in the subtropical zone has higher soil carbon content than Papua New Guinea in the tropical zone, its above-ground and below-ground biomass is comparatively lower, resulting in a less prominent total carbon stock. The amount of soil carbon in mangroves remains much more stable than their biomass, which is attributed to the distinctive ecological conditions14. Overall, different carbon accumulation rates across climate zones and the relative contributions of each component within the mangrove carbon pool are both crucial factors influencing carbon storage capacity and baseline total carbon stock.
Data Records
This dataset captures global mangrove accumulated carbon storage at a 1 km resolution from 2000 to 2020 and is publicly available in single-band GeoTIFF format with World Mercator projection (https://doi.org/10.6084/m9.figshare.27759558)38. In this study, the data follow standardized naming convention: ‘input_name_yr.tif’, ‘process_name_yr.tif’, and ‘out-put_name_yr.tif’. Regarding these file names, ‘input’ refers to the prepared input data; ‘process’ represents intermediary data generated during calculations; ‘output’ means the results of this study; ‘Name’ indicates the data type, and ‘yr’ specifies the year of the data. For instance, ‘input_agb_2000.tif’ corresponds to the 1 km resolution global above-ground biomass data for mangroves in the year 2000 from Simard et al.10; ‘process_G_0007.tif’ represents the total cumulative biomass of global mangroves from 2000 to 2007 at a 1 km resolution; ‘output_carbon_0020.tif’ represents the output of this study in terms of the 2000–2020 global mangrove accumulated carbon storage at a 1 km resolution.
Technical Validation
-
A quantitative comparison of mangrove carbon storage at the global scale. Since this study mainly relied on geospatial overlay analysis, we initially validated our results by comparing the results with those of Donato et al.2, which evaluated mangrove carbon storage in tropical regions using field measurements. Their study found that mangroves in the tropics were among the most carbon-intensive forest types, with an average carbon storage of approximately 1023 Mg/ha. In comparison, our study indicated that the global average carbon stock in mangroves was 1297 Mg/ha, which is of an approximate magnitude. This has demonstrated the robustness of the results obtained in this work. Meanwhile, it is worth noting that the average mangrove carbon storage in the year 2000 in our work is higher than that reported by Donato et al.2. This could be attributed to that their study only considered mangrove carbon storage in tropical regions like India and the Pacific, without accounting for those in other areas and thus underestimating the global total. To further validate our results, we compared them with those reported by Richards et al.23, which utilized biomass data from Simard et al.10 and soil carbon data from Sanderman et al.11. In the study by Richards et al.23, the net change in global mangrove carbon storage during 1996–2016 was calculated using 1996 as the baseline year, which showed that the global mangrove carbon stock in 1996 was 8,627 Mt. Our study showed that the global mangrove carbon stock was 8,768 Mt (range: 8,050–9,486 Mt) in 2000, which aligns closely with the results obtained in Richards et al.’s study23. Overall, these quantitative comparisons of global total or average mangrove carbon stock can validate the accuracy and robustness of our study’s results.
Meanwhile, apart from the validation in terms of global total and average values, we further assessed the accuracy of national contributions to global mangrove carbon storage as compared to existing studies. Since this study adopted Harris et al.’s definition28 of forest carbon accumulation and aligned with their spatial-temporal scales, we conducted a comparative analysis of the results obtained in these two studies. By further processing the results by Harris et al.28, we estimated the proportion of carbon removal by mangroves in each country relative to global carbon removals and compared it with our results on the global proportion of mangrove accumulated carbon storage by country. As illustrated in Table 10, countries with wide mangrove extents exhibit a similar proportion in both carbon storage and carbon removal. However, there is a relatively notable difference in the proportions among the following four countries, namely Australia, Malaysia, Bangladesh, and Myanmar. This difference can be attributed to the fact that our study did not distinguish forest age in the process of calculating biomass increment. Instead, we used the average annual biomass increment data provided by the IPCC22. Specifically, Tier 1 of the IPCC calculation guidelines does not consider the effect of forest age on biomass increment, whereas Tier 2 and Tier 3 take forest age into account but only categorize tree age based on a 20-year baseline: 20 years or less, 21–40 years, 41–100 years, 100–200 years, and greater than 200 years. Since the specific age of mangrove forests was not considered in our calculations, the same biomass increment data was used for all carbon-accumulating mangroves, regardless of whether they were young or mature forests. Therefore, our study may have overestimated the carbon sequestration capacity of early successional mangroves to a certain extent, leading to higher estimates of carbon storage in some regions. This explains the differences between our results and those of Harris et al.28, particularly in the abovementioned four countries that experienced significant changes in mangrove extent between 2000 and 2020, such as Australia.
Table 10 Comparative analysis of global proportional contributions by country. -
Spatial heterogeneity of mangrove accumulated carbon storage hotspots from 2000 to 2020 at urban scale. We conducted a hotspot analysis to reveal the spatial change patterns of global mangrove accumulated carbon storage from 2000 to 2020 at the urban scale. In this context, the hotspot is defined as an area where the carbon density of the region and its surrounding neighbourhood is significantly enhanced, meaning that the mangrove accumulated carbon storage in these areas is significantly higher than the global average of the same year. Conversely, areas exhibiting low carbon density are identified as coldspots, indicating much smaller accumulated carbon storage in those regions. As shown in Fig. 4, ‘99%’ hotspot and ‘99%’ coldspot in the legends indicate the confidence level of statistical significance. Specifically, ‘99%’ hotspots represent areas where relatively high carbon storage values are significantly clustered, highlighting regions with notable carbon sequestration potential. Conversely, ‘99%’ coldspots represent areas where relatively low carbon storage values are spatially aggregated39. The 2000 global mangrove carbon stock revealed a polarization trend between coldspots and hotspots. Most cities in Indonesia and Nigeria and a few cities in Brazil were identified as ‘99%’ hotspots, while carbon stock in the remaining cities exhibited coldspot characteristics. In general, regions identified as coldspots at the urban scale also appear as coldspots at the raster scale. However, Australia presented a distinct pattern. At the regional scale, all areas of Australia were coldspots, indicating that their carbon density was significantly lower than the global average. In contrast, at the raster scale, the northern region of Australia emerged as a hotspot, with carbon density significantly higher than the global average. This phenomenon highlights the pronounced spatial heterogeneity of mangrove carbon stock in Australia. In the northern regions, such as Queensland and the Northern Territory, mangroves are relatively concentrated and benefit from favourable ecological conditions, resulting in higher carbon density. In contrast, mangroves in other areas are more sparsely distributed, leading to lower carbon stocks.
Fig. 4 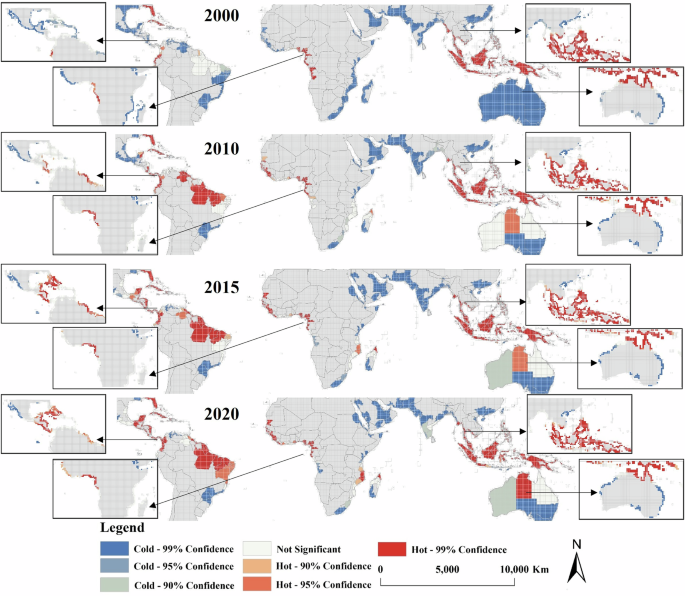
Spatial distribution of mangrove accumulated carbon storage from 2000 to 2020. The figure shows the distribution of hotspots of accumulated carbon storage per hectare of mangrove forests averaged at the district level, while the inset shows the distribution of hotspots at the raster level. Note: The adoption of the ‘Fixed Distance Band’ spatial relationship model ensured that the analysis is focused exclusively on coastal regions where mangroves exist.
While carbon storage accumulated until 2010, most cities that were previously hotspots still maintained their hotspot status, particularly in India and Nigeria. Some cities that were initially identified as coldspots, such as those in Mexico, transitioned to hotspots. Besides, certain cities in Brazil and northern Australia also transitioned to hotspot regions. At the raster scale, the Republic of the Congo, the Democratic Republic of the Congo, and the Republic of Angola remained hotspots, even with a significant reduction in hotspot ranges. This indicates that while the reduction in mangrove extent has an impact on carbon storage, carbon density is also a critical driver of accumulated carbon storage. By 2015, hotspots expanded further while coldspots gradually decreased globally. However, contrary to the global trend, hotspots in the Republic of the Congo, the Democratic Republic of the Congo, and the Republic of Angola continued to shrink, with some areas transitioning from hotspots in 2010 to coldspots in 2015 (Fig. 4). This phenomenon is closely linked to the reduction in hotspot ranges observed at the raster scale in 2010, which reflects the time lag between changes in mangrove extent and their impact on accumulated carbon storage. In other words, when the extent of mangroves decreases, the accumulated carbon storage will not decline immediately but gradually show a downward trend over time. By 2020, the global hotspots of accumulated carbon storage have further expanded, particularly in some regions of Asia and South Africa. The intensity of hotspots has gradually increased in some cities that were previously hotspots, including the northern region of Australia and Brazil and some cities in Mozambique. Compared to the significant polarization of hotspots and coldspots in 2000, the expansion of hotspot ranges and the enhancement of hotspot levels reflect an overall rising trend of global accumulated carbon storage and the improvement in carbon sequestration capacity.
-
Spatial distributions of annual carbon increment and local mangrove accumulated carbon storage from 2000 to 2020. As mentioned above, global mangrove accumulated carbon storage has increased overall during the past 20 years, with the mean annual carbon accumulation being particularly prominent in Mexico, Brazil, Nigeria, and Indonesia (as shown in Fig. 5). However, in some countries, accumulated carbon storage has declined, with annual carbon increments turning negative. Indonesia, which holds the largest mangrove carbon stock and accounts for approximately a quarter of the global total40,41, ranks third in mean annual carbon increment. It is worth noting that Indonesia has implemented a number of mangrove restoration projects since 2007 to rehabilitate mangroves degraded by aquaculture and illegal deforestation42,43. Despite these efforts, the extent of Indonesia’s mangroves continued to decline. Calculating the carbon stock for a single year can not directly reflect the loss of carbon stock caused by the decrease in mangrove extent. By estimating the mangrove accumulated carbon storage, we can directly observe that the anticipated effect of Indonesia’s measures for mangrove protection and restoration has not been well achieved.
Fig. 5 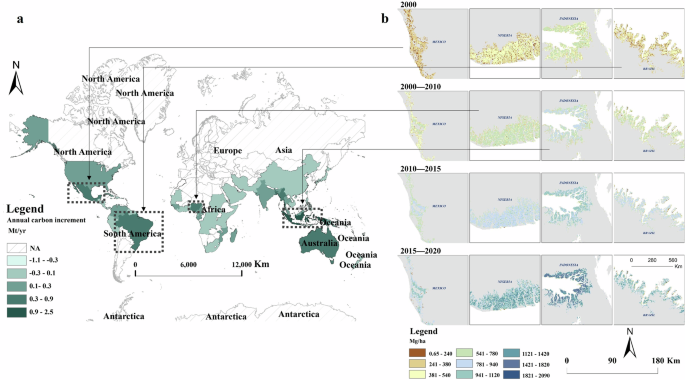
(a) Average annual carbon increment in mangrove forests from 2000 to 2020; (b) Local map of countries with abundant mangrove accumulated carbon storage: cases of Mexico, Brazil, Nigeria, and Indonesia.
As for Brazil, which took a leading role in terms of average annual carbon increment, it held 6.5% of the global baseline mangrove total carbon stock and ranked in the third place. By 2020, this share increased slightly to 6.8% (Fig. 3). Since 2010, Brazil has promoted a series of conservation programs such as the Brazilian Blue Initiative, aiming to facilitate the preservation of coastal ecosystems such as mangroves in the context of global climate change44. Correspondingly, Brazil’s accumulated carbon storage also showed a significant growth trend, indicating that community-level initiatives in Brazil to protect and restore mangrove ecosystems have been highly effective. In Nigeria, the annual carbon increment in mangroves ranked second only to that in Brazil, with a notable increasing trend in accumulated carbon storage. Nigeria was one of the few countries where the area of mangroves increased rather than decreased between 2000 and 201016. This can be attributed to the fact that Nigeria has been implementing mangrove restoration projects and community management strategies since 1999, prioritizing the establishment of conservation zones45. Similarly, Mexico also demonstrated notable progress in mangrove conservation and restoration8. Mexico ranked second only to Indonesia in terms of average annual carbon increment, and its accumulated carbon storage exhibited the most prominent growth trend. This is mainly because the extent of Mexico’s mangroves increased considerably between 2000 and 2020, attributed to the series of policy measures implemented by Mexico towards mangrove protection and restoration46. By revealing the trend of changes in accumulated carbon storage, this dataset helps us better capture the effectiveness of various conservation measures in restoring mangrove ecosystems and provides a theoretical basis for the formulation of relevant policies in the future.
-
Spatially explicit comparison of mangrove carbon storage at the gridded level. We further compared the results with previous studies at a global gridded level to enhance the reliability of our findings on the spatial-temporal evolution in mangrove carbon storage. At the global level, our results were compared with those of Spawn et al.47, which examined the global above-ground and below-ground biomass carbon density in 2010. To ensure the consistency of the carbon pools being compared, we overlaid the global mangrove soil carbon data provided by Sanderman et al.11 onto the 2010 global above-ground and below-ground biomass carbon density data from Spawn et al.47, and then compared the obtained values with the accumulated carbon storage from our study for the period 2000–2010. Four regions with relatively rich mangrove resources were selected for comparison: Papua New Guinea, Indonesia, the coastal area between India and Bangladesh, and Guinea-Bissau. Figure 6 illustrates that the results by Spawn et al.47 and those of our study show similar spatial distribution patterns across these areas. In the case of Indonesia, our study showed a more concentrated distribution of mangrove carbon storage, particularly in the western coastal areas of Sumatra and Kalimantan, as indicated in darker colors. This indicated that the mangroves in these areas had a high carbon sequestration capacity. Although these two studies demonstrated similar spatial distribution characteristics, areas with high carbon density were less apparent in Spawn et al.’s study47. This was because our study focused on the global mangrove accumulated carbon storage from 2000 to 2010, whereas Spawn et al.47 examined the carbon stock only for the year 2010.
Fig. 6 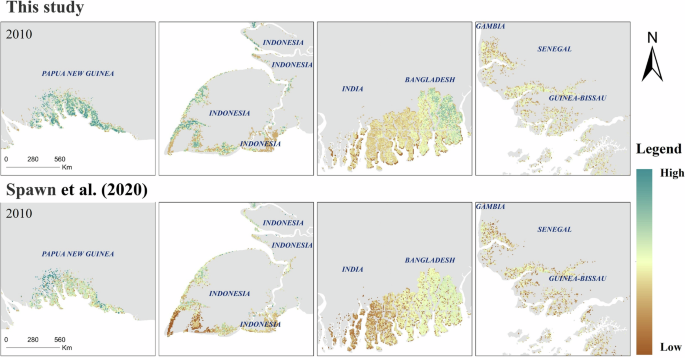
Spatial distribution of mangrove carbon storage from our study and that of Spawn et al. (2020) in selected regions in 2010.
Furthermore, the accumulated carbon storage from 2000 to 2016 in our study was compared with the global carbon stock data released by Walker et al.48. The regions selected for this comparison are the same as those adopted in the comparison with the study by Spawn et al.47. As shown in Fig. 7, the datasets released by Walker et al.48 and our study have a high degree of similarity in spatial distribution. Specifically, mangrove carbon storage in Indonesia was primarily concentrated in western Sumatra and Kalimantan, with significant storage also observed in parts of Papua New Guinea’s mangrove regions. However, in the analysis by Walker et al.48, these regions appeared in lighter shades, indicating a lower carbon density compared with our calculated values. Furthermore, the spatial patterns of the two studies in the coastal areas between India and Bangladesh exhibited bigger differences. This is because their study focused on global land carbon storage, emphasizing inland regions rather than coastal areas where mangroves are predominantly distributed. As a result, the carbon density patterns in coastal regions, such as the western coastal areas of India and the coastal areas of Bangladesh, were less pronounced in their analysis48. In our study, the darker colors in the western coastal areas of India and the coastal areas of Bangladesh indicated higher carbon densities, particularly in southern Bangladesh. In contrast, the study by Walker et al.48 showed lighter colors in the eastern coastal areas of India and Bangladesh, suggesting a more homogeneous distribution pattern and relatively lower carbon density. This comparison shows that both accumulated carbon storage and single-year carbon stock share similar spatial distribution patterns. However, compared to single-year carbon stock, accumulated carbon storage is more strongly affected by temporal changes. Therefore, this highlights the importance of calculating accumulated carbon storage, which could provide a more comprehensive view of the dynamic evolution of mangroves’ carbon sequestration capacity.
Fig. 7 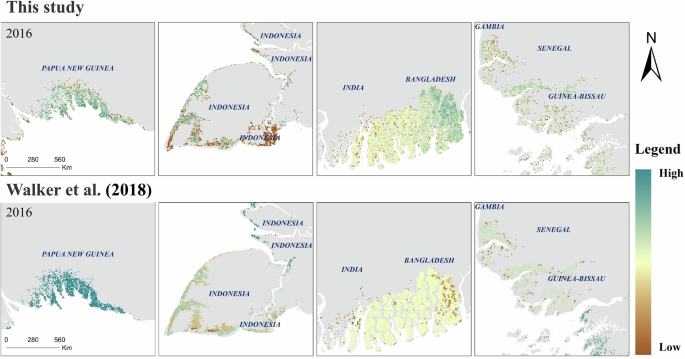
Spatial distribution of mangrove carbon storage from our study and that of Walker et al. (2022) in selected regions in 2016.
To further validate the results of our study in spatially explicit distribution for specific regions, we further compared Mexico’s mangrove accumulated carbon storage from 2000 to 2007 in our study with the results from Vázquez-Lule et al.49. Due to Mexico’s long and narrow coastline, the mangrove distribution is relatively scattered. Therefore, we selected four areas with the highest density of mangroves in Mexico for comparison. Figure 8 shows that while both studies revealed similar spatial distribution patterns, this study demonstrated a more concentrated distribution of mangrove carbon storage, with higher carbon density along the eastern coast of Mexico but lower density and more dispersed mangroves in the northern and western regions. Vázquez-Lule et al.’s study49 also exhibited a similar pattern, with higher carbon density concentrated in the eastern coastal zone and lower density with more dispersed mangroves in the southern coastal zone of Mexico. Furthermore, carbon stocks reported in Vázquez-Lule et al.’s study49 were more uniformly distributed across the regions, which is due to that their study focused solely on the carbon stock of persistent mangrove forests in Mexico’s coastal zones. Their mangrove distribution data were obtained from the monthly average Normalized Difference Vegetation Index (NDVI) from MOD13A349, which differs from the mangrove distribution data used in our study. These differences may have caused variations in the spatial distribution of mangrove carbon density. Overall, the strong consistency in spatial patterns between the studies confirms the robustness of the results for specific regions to a great extent.
Fig. 8 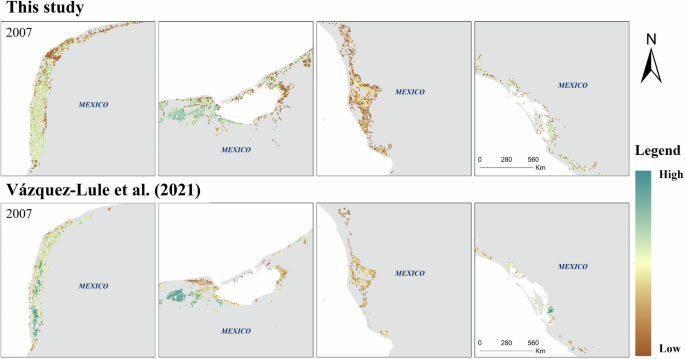
Spatial distribution of mangrove carbon storage from our study and that of Vázquez-Lule et al. (2021) in selected regions in 2007.
-
Uncertainty and sensitivity analysis. An uncertainty analysis in this study is conducted to evaluate the potential errors and their impact on the estimated results of global mangrove accumulated carbon storage from 2000 to 2020. The USGS dataset, which was developed using advanced digital image classification techniques and validated with ground-based observation data as well as existing GIS datasets, serves as the reference dataset for analyzing the uncertainty of the results24. The uncertainties in our dataset primarily stem from the quality of input data and the calculating process of the results. The main sources of input data uncertainties are described below. Although the Global Mangrove Watch (GMW) dataset serves as an essential resource for tracking mangrove distribution changes from 2000 to 202027, it is prone to overestimation or underestimation of mangrove extents at national to local scales, as highlighted by Bunting et al.16. Similarly, the soil organic carbon (SOC) data are affected by inconsistencies in measurement methods, errors in bulk density estimation, and spatial misplacement of plot locations11. Additionally, the above-ground biomass (AGB) data are subject to uncertainties due to reliance on site-specific allometric models, potential biases in SRTM-based height estimation, and the exclusion of scrub forests in biomass calculations, as noted by Simard et al.10.


To suitably evaluate these uncertainties, we adopted an uncertainty analysis framework proposed by the IPCC’s Uncertainty of Annual Estimate50. The IPCC guidelines provide a framework for evaluating the uncertainties associated with various factors or parameters, which allows us to quantify their potential influence on our estimates and enhance the robustness of the analysis50. For datasets derived through additive and multiplicative processes, the error propagation equation allows for the calculation of total uncertainty by combining uncorrelated uncertainties of factors or parameters.
The total uncertainty can be determined using Eq. (4) when uncertain factors or parameters are combined through multiplication:
where Utotal (%) represents the total uncertainty of global mangrove accumulated carbon storage, which is based upon the 95% confidence interval; Un (%) represents the uncertainty of the factor or parameter n.
When uncertain factors or parameters are combined through addition or subtraction, the total uncertainty can be calculated using Eq. (5):
where xn represents the factor or parameter n.
These results provide quantitative estimates of the uncertainty and confirm the robustness of the study’s findings. As shown in Table 11, soil carbon density (SOC) is the largest source of uncertainty, with an uncertainty value of 0.404. In contrast, the ratio of below-ground to above-ground biomass (R1) and the carbon fraction of dry matter (CF) exhibit lower uncertainties, which are respectively 0.043 and 0.047. Regarding the output data, we presented the confidence intervals for the accumulated carbon storage (Mg/ha) of global mangroves from 2000 to 2020 (Fig. 9).

Uncertainty of mangrove accumulated carbon storage. The shaded area represents the 95% confidence interval.
We also conducted a sensitivity analysis to evaluate the impact of key factors, including above-ground biomass (AGB), below-ground biomass (BGB), dead organic matter (DEAD), and soil organic carbon (SOC), on the baseline total carbon stock and accumulated carbon storage of global mangroves. The Sobol sensitivity indices were employed to quantify the direct and total contributions of these factors to the output variance, which could provide insights into their roles and interactions within the model51,52. As shown in Fig. 10, AGB emerges as the most influential factor for both baseline and accumulated carbon storage. BGB and DEAD exhibit nearly identical levels of influence, which is due to that both BGB and DEAD are calculated based on AGB. SOC also exhibits a significant influence, while its impact on the accumulated carbon storage is slightly reduced compared to the impact on the baseline carbon storage. This is attributed to our focus on carbon accumulation, which is primarily driven by biomass increments. Overall, the high total-order indices indicate that the influence of all factors plays a crucial role in driving the variance of mangrove carbon storage, which underlines the importance of accounting for all key factors in carbon storage assessments.

(a) Sensitivity index of BCs (baseline total carbon stock). (b) 95% confidence intervals of BCs. (c) Sensitivity index of ACs (accumulated carbon storage). (d) 95% confidence intervals of ACs.
In the future, we aim to further reduce the uncertainty and improve the accuracy of mangrove carbon storage estimates. Our focus will be on gaining a deeper understanding and quantifying the interactions between above-ground biomass and soil organic carbon, as addressing these interactions is essential for refining the model and enhancing the reliability of global mangrove carbon storage estimates. Furthermore, to account for the non-linear interaction among influencing factors, advanced processing methods such as Graph Neural Networks (GNN) and Convolutional Neural Networks (CNN) could be applied to improve the accuracy of mangrove carbon storage distribution mapping while reducing computational errors.
Usage Notes
This study developed a 1 km resolution dataset on a global scale that visually captures dynamic changes in mangrove accumulated carbon storage from 2000 to 2020 and thoroughly analyzed its spatiotemporal heterogeneity. Unlike carbon stock for a specific year, accumulated carbon storage measures the capability for continuous carbon sequestration in mangroves, which can well reflect the changes in mangroves’ carbon sequestration capacity over time. This dataset provides spatially explicit scientific evidence for formulating mangrove protection and restoration strategies, optimizing reserve layouts, and implementing restoration projects. The high-resolution datasets and maps developed in this study also enable the systematic evaluation of conservation efforts and support the identification of vulnerable areas, thereby promoting sustainable management and conservation of mangrove ecosystems worldwide.
The comparative analyses conducted in this study have demonstrated the accuracy and robustness of the results. However, there are several limitations that should be noted. First, the lack of data on the average annual carbon increment of mangroves by age may lead to an overestimation of carbon storage in certain regions. Second, some mangroves are distributed in marine areas due to their unique habitat conditions, which may not be fully covered by standard global boundary maps. Third, data processing methods, such as the nearest-neighbor approach for zoning statistics, may exclude some intersecting patches along boundaries. To address this, a 15 km buffering zone was applied to extend the global boundary to help ensure a more comprehensive coverage. While this approach is suitable for calculating global accumulated carbon storage, it might introduce slight variations in country-level results. Future studies should take these limitations into account when utilizing the datasets developed in our work.
Code availability
To ensure full reproducibility and transparency of our research, we provided all the scripts used in our analysis. Codes used for this study are publicly available on: https://doi.org/10.6084/m9.figshare.27759558.
References
Bouillon, S. Storage beneath mangroves. Nat Geosci. 4, 282–283, https://doi.org/10.1038/ngeo1130 (2011).
Donato, D. C. et al. Mangroves among the most carbon-rich forests in the tropics. Nat. Geosci. 4, 293–297, https://doi.org/10.1038/ngeo1123 (2011).
FAO. 2020. Global Forest Resources Assessment 2020: Main report. Rome. Available at: https://doi.org/10.4060/ca9825en (2020).
Spalding, M. D. & Leal, M. The state of the world’s mangroves 2022. Available at: https://www.mangrovealliance.org/mangrove-forests/ (2022).
United Nations Environment Programme (2009). Blue carbon: the role of healthy oceans in binding carbon. Available at: https://wedocs.unep.org/20.500.11822/7772.
Sasmito, S. D. et al. Effect of land-use and land-cover change on mangrove blue carbon: A systematic review. Glob. Chang. Biol. 25, 4291–4302, https://doi.org/10.1111/gcb.14774 (2019).
UNFCCC. Nationally Determined Contributions Registry. Available at: https://unfccc.int/fr/NDCREG (2021).
Tollin, N. et al. Urban content of NDCS: Local climate action explored through in-depth country analyses. Available at: https://unhabitat.org/urban-content-of-ndcs-local-climate-action-explored-through-in-depth-country-analyses-2024-report (2024).
Atwood, T. B. et al. Global patterns in mangrove soil carbon stocks and losses. Nat. Clim. Chang. 7, 523–528, https://doi.org/10.1038/nclimate3326 (2017).
Simard, M. et al. Mangrove canopy height globally related to precipitation, temperature and cyclone frequency. Nat. Geosci. 12, 40–45, https://doi.org/10.1038/s41561-018-0279-1 (2019).
Sanderman, J. et al. A global map of mangrove forest soil carbon at 30 m spatial resolution. Environ. Res. Lett. 13, 055002, https://doi.org/10.1088/1748-9326/aabe1c (2018).
Adame, M. F. et al. Future carbon emissions from global mangrove forest loss. Glob Change Biol 27, 2856–2866, https://doi.org/10.1111/gcb.15571 (2021).
Seydewitz, T., Pradhan, P., Landholm, D. M. & Kropp, J. P. Deforestation drivers across the tropics and their impacts on carbon stocks and ecosystem services. Anthropocene Sci. 2, 81–92, https://doi.org/10.1007/s44177-023-00051-7 (2023).
Friess, D. A. et al. The state of the world’s mangrove forests: Past, present, and future. Annu. Rev. Environ. Resour. 44, 89–115, https://doi.org/10.1146/annurev-environ-101718-033302 (2019).
da S. Bezerra, D. et al. Brazil’s mangroves: Natural carbon storage. Sci. 375, 1239, https://doi.org/10.1126/science.abo4578 (2022).
Bunting, P. et al. Global mangrove extent change 1996–2020: Global mangrove watch version 3.0. Remote. Sens. 14, 3657, https://doi.org/10.3390/rs14153657 (2022).
Hamilton, S. E. & Casey, D. Creation of a high spatio-temporal resolution global database of continuous mangrove forest cover for the 21st century (CGMFC-21). Glob. Ecol. Biogeogr. 25, 729–738, https://doi.org/10.1111/geb.12449 (2016).
Goldberg, L. et al. Global declines in human-driven mangrove loss. Glob Change Biol 26, 5844–5855, https://doi.org/10.1111/gcb.15275 (2020).
Giri, C. et al. Status and distribution of mangrove forests of the world using earth observation satellite data. Glob. Ecol. Biogeogr. 20, 154–159, https://doi.org/10.1111/j.1466-8238.2010.00584.x (2011).
Rovai, A. S. et al. Global controls on carbon storage in mangrove soils. Nat. Clim. Chang. 8, 534–538, https://doi.org/10.1038/s41558-018-0162-5 (2018).
Hamilton, S. E. & Friess, D. A. Global carbon stocks and potential emissions due to mangrove deforestation from 2000 to 2012. Nat. Clim. Chang. 8, 240–244, https://doi.org/10.1038/s41558-018-0090-4 (2018).
Hiraishi, T. et al. 2013 supplement to the 2006 IPCC guidelines for national greenhouse gas inventories: Wetlands. Available at: https://www.ipcc-nggip.iges.or.jp/public/wetlands/ (2014).
Richards, D. R., Thompson, B. S. & Wijedasa, L. Quantifying net loss of global mangrove carbon stocks from 20 years of land cover change. Nat. Commun. 11, 4260, https://doi.org/10.1038/s41467-020-18118-z (2020).
Giri, C. et al. Global Mangrove Distribution. USGS. Available at: https://databasin.org/datasets/d214245ab4554bc1a1e7e7d9b45b9329/ (2013).
Simard, M. et al. Aboveground Live Woody Biomass Density. GFW. Available at: https://data.globalforestwatch.org/datasets/gfw::aboveground-live-woody-biomass-density/about (2019).
Sanderman, J. et al. Global mangrove soil carbon: dataset and spatial maps. Harvard Dataverse. Available at: https://dataverse.harvard.edu/dataset.xhtml?persistentId=doi:10.7910/DVN/OCYUIT (2018).
Bunting, P. et al. Global Mangrove Watch (1996 - 2020) Version 3.0 Dataset (3.0). Zenodo. Available at: https://doi.org/10.5281/zenodo.6894273 (2022).
Harris, N. L. et al. Global maps of twenty-first century forest carbon fluxes. Nat. Clim. Chang. 11, 234–240, https://doi.org/10.1038/s41558-020-00976-6 (2021).
Alongi, D. M. Carbon cycling and storage in mangrove forests. Annu. Rev. Mar. Sci. 6, 195–219, https://doi.org/10.1146/annurev-marine-010213-135020 (2014).
Chen, D. & Chen, H. W. Using the köppen classification to quantify climate variation and change: An example for 1901–2010. Environ. Dev. 6, 69–79, https://doi.org/10.1016/j.envdev.2013.03.007 (2013).
United Nations Framework Convention on Climate Change (UNFCCC). Methodological tool: Estimation of carbon stocks and change in carbon stocks in dead wood and litter in A/R CDM project activities. Available at: https://cdm.unfccc.int/methodologies/ARmethodologies/tools/ar-am-tool-12-v3.0.pdf (2013).
GPCC. Global Precipitation Climatology Centre monthly precipitation dataset from 1891-present is calculated from global station data. NOAA. Available at: https://www.psl.noaa.gov/data/gridded/data.gpcc.html (2024).
CRU TS4.03. Climatic Research Unit (CRU) Time-Series (TS) version 4.03 of high-resolution gridded data of month-by-month variation in climate. NCAS. Available at: https://catalogue.ceda.ac.uk/uuid/10d3e3640f004c578403419aac167d82/ (2019).
GLOBE Topography. NOAA. Available at: https://www.ngdc.noaa.gov/mgg/topo/DATATILES/elev (2008).
Rodríguez-Rodríguez, J. A., Mancera-Pineda, J. E. & Tavera, H. Mangrove restoration in Colombia: Trends and lessons learned. For. Ecol. Manage. 496, 119414, https://doi.org/10.1016/j.foreco.2021.119414 (2021).
Ramos, A. & IUCN Mozambique. Integrating mangroves and nature-based solutions (NBS) in blue economy strategies for sustainable policy decision-making. PANORAMA Solutions. Available at: https://panorama.solutions/en/solution/integrating-mangroves-and-nature-based-solutions-nbs-blue-economy-strategies-sustainable (2021).
Twilley, R. R., Chen, R. H. & Hargis, T. Carbon sinks in mangroves and their implications to carbon budget of tropical coastal ecosystems. Water, Air, Soil Pollut. 64, 265–288, https://doi.org/10.1007/BF00477106 (1992).
Wang, M. R. et al. Global mangroves accumulated carbon storage from 2000 to 2020. Available at: https://doi.org/10.6084/m9.figshare.27759558 (2024).
Tran, D. X. et al. Characterizing the relationship between land use land cover change and land surface temperature. ISPRS J. Photogramm. Remote Sens. 124, 119–132, https://doi.org/10.1016/j.isprsjprs.2017.01.001 (2017).
Murdiyarso, D. et al. The potential of Indonesian mangrove forests for global climate change mitigation. Nat. Clim. Chang. 5, 1089–1092, https://doi.org/10.1038/nclimate2734 (2015).
Sasmito, S. D. et al. Mangrove blue carbon stocks and dynamics are controlled by hydrogeomorphic settings and land-use change. Glob. Chang. Biol. 26, 3028–3039, https://doi.org/10.1111/gcb.15056 (2020).
Friess, D. A. et al. Policy challenges and approaches for the conservation of mangrove forests in Southeast Asia. Conserv. Biol. 30, 933–949, https://doi.org/10.1111/cobi.12784 (2016).
Nurhati, I. S. & Murdiyarso, D. National strategy for mangrove ecosystem management: A reference for the conservation and rehabilitation of coastal areas to achieve sustainable development goals and low carbon development. Available at: https://www.cifor-icraf.org/publications/pdf_files/WPapers/CIFOR-ICRAF-WP-14.pdf (2023).
Ferreira, A. C. & Lacerda, L. D. Degradation and conservation of Brazilian mangroves, status and perspectives. Ocean. & Coast. Manag. 125, 38–46, https://doi.org/10.1016/j.ocecoaman.2016.03.011 (2016).
Sam, K. et al. Towards a framework for mangrove restoration and conservation in Nigeria. Reg. Stud. Mar. Sci. 66, 103154, https://doi.org/10.1016/j.rsma.2023.103154 (2023).
Comisión Nacional de Areas Naturales Proteidae. Manglers de México: solutions naturales al Cambio climatic. Available at: https://www.gob.mx/conanp/es/articulos/manglares-de-mexico-soluciones-naturales-al-cambio-climatico (2023).
Spawn, S. A. & Gibbs, H. K. Global aboveground and belowground biomass carbon density maps for the year 2010. ORNL Distributed Active Archive Center https://doi.org/10.3334/ORNLDAAC/1763 (2020).
Walker, S. M. et al. The global potential for increased storage of carbon on land. Proc. Natl. Acad. Sci. U.S.A. 119, e2111312119, https://doi.org/10.1073/pnas.2111312119 (2022).
Vázquez-Lule, A. et al. Greenness trends and carbon stocks of mangrove forests across Mexico, 2001–2015. ORNL Distributed Active Archive Center https://doi.org/10.3334/ORNLDAAC/1853 (2021).
Intergovernmental Panel on Climate Change (IPCC). 2006 IPCC guidelines for national greenhouse gas inventories, Volume 1: General guidance and reporting. Available at: https://www.ipcc-nggip.iges.or.jp/public/2006gl/vol1.html (2006).
Wang, H. & Convertino, M. Algal bloom ties: Systemic biogeochemical stress and Chlorophyll-a shift forecasting. Ecol. Indic 154, 110760, https://doi.org/10.1016/j.ecolind.2023.110760 (2023).
Pianosi, F. et al. Sensitivity analysis of environmental models: A systematic review with practical workflow. Environ. Model. Softw. 79, 214–232, https://doi.org/10.1016/j.envsoft.2016.02.008 (2016).
Acknowledgements
This study was supported by the Research Fellowship provided by Alexander von Humboldt Foundation (Recipient: Xudong Wu), the Young Talent Promotion Project of China Association for Science and Technology (Grant No. 2020–2022QNRC002), and the Project Supported by Science Foundation of Hebei Normal University (Grant No. L2025B29).
Author information
Authors and Affiliations
Contributions
Moran Wang: Preparation, Methodology, Data Curation, Analysis, Calculations, Writing-Original Draft, Writing-Reviewing and Editing. Tianyuan Zhang: Supervision, Methodology, Visualization, Analysis. Yongjuan Xie: Writing-Reviewing and Editing, Visualization, Analysis. Zhiqiang Zhang: Methodology, Visualization. Xudong Wu: Conceptualization, Supervision, Analysis, Writing-Reviewing and Editing, Funding acquisition, Project Administration.
Corresponding author
Ethics declarations
Competing interests
The authors declare no competing interests.
Additional information
Publisher’s note Springer Nature remains neutral with regard to jurisdictional claims in published maps and institutional affiliations.
Rights and permissions
Open Access This article is licensed under a Creative Commons Attribution-NonCommercial-NoDerivatives 4.0 International License, which permits any non-commercial use, sharing, distribution and reproduction in any medium or format, as long as you give appropriate credit to the original author(s) and the source, provide a link to the Creative Commons licence, and indicate if you modified the licensed material. You do not have permission under this licence to share adapted material derived from this article or parts of it. The images or other third party material in this article are included in the article’s Creative Commons licence, unless indicated otherwise in a credit line to the material. If material is not included in the article’s Creative Commons licence and your intended use is not permitted by statutory regulation or exceeds the permitted use, you will need to obtain permission directly from the copyright holder. To view a copy of this licence, visit http://creativecommons.org/licenses/by-nc-nd/4.0/.
About this article

Cite this article
Wang, M., Zhang, T., Xie, Y. et al. Mapping accumulated carbon storage of global mangroves from 2000 to 2020 at a 1 km resolution. Sci Data 12, 552 (2025). https://doi.org/10.1038/s41597-025-04881-5
Received:
Accepted:
Published:
Version of record:
DOI: https://doi.org/10.1038/s41597-025-04881-5
This article is cited by
-
Mangrove sediment carbon burial offset by methane emissions from mangrove tree stems
Nature Geoscience (2025)
-
A comprehensive review of climate warming and carbon dynamics in wetland ecosystems
Discover Sustainability (2025)
