
Abstract
Gliomas represent a heterogenous group of primary brain tumors with overlapping imaging phenotypes. Treatment typically includes surgery and/or chemoradiation, however this varies based on the overall lesion and clinical presentation. This heterogeneity in both lesion characteristics and management strategies contributes to a lack of reliable findings when evaluating treatment outcomes with conventional MRI. The overlapping imaging features of radiation necrosis and tumor progression post-treatment can be particularly challenging for radiologists. We present a dataset of 203 glioma patients with 594 post-treatment timepoints of relevant clinical history and routine T1, T1 postcontrast, T2, and FLAIR weighted MR sequences. Preprocessing of the images follow a standardized pipeline with automatic deep-learning based segmentations for each tumor component i.e. enhancing tumor, non-enhancing necrotic core, surrounding non-enhancing FLAIR signal hyperintensity, and resection cavity. The automatic segmentations were manually validated and refined by neuroradiologists to get the ground truth labels. Our contribution of this robust dataset to an open-source repository aims to contribute to the development of AI models to improve evaluation of treatment outcomes.
Background & Summary
Adult-type diffuse glioma, the most common primary malignant central nervous system (CNS) tumor, represents an infiltrating subtype that includes astrocytoma, oligodendroglioma, and glioblastoma. Diffuse gliomas represent approximately 14% of all intracranial neoplasms and 50% of all primary malignant brain tumors1.
Although imaging does not play a formal role in preoperative grading, post-treatment surveillance is vital for monitoring recurrence. A postoperative brain MRI is typically ordered 24–48 hours after surgical resection to establish a new baseline. Serial imaging is initiated after completing chemoradiation to assess clinical response. Unfortunately, post-treatment changes, such as pseudo-progression and radiation necrosis, can be highly variable in their presentation and can often mimic tumor progression. For the radiologist removed from direct patient care, accurately differentiating post-treatment changes from tumor recurrence or stable disease can be challenging. The radiologic and clinical manifestations of tumor pseudo-progression and radiation necrosis often overlap, as they can both be attributed to chemoradiation side effects2. Aside from the time course, there is no consistent symptomology or criteria based on conventional MRI sequences to distinguish the two. In 20–30% of patients treated with chemoradiation, pseudo-progression will present as an enlarging contrast enhancing lesion within three months of completing treatment3,4. Radiation necrosis has a more delayed onset, often presenting as a space-occupying lesion within the field of irradiated tissue several months to years after therapy has been completed5. Many attempts have been made to establish a non-invasive approach to correlate post-treatment imaging findings with histology, such as T1/T2 mismatch, lesion quotients, characteristic patterns of diffusion restriction on DWI/DTI, dynamic contrast enhancement MRI, MR spectroscopy, and correlation with PET/SPECT6. While the combination of these modalities may offer context, biopsy and/or surgical removal remains the gold standard for distinguishing disease progression from post-treatment changes5.
For the radiologist, navigating complex post-treatment surveillance imaging without a formal diagnostic criterion highlights a need for improved deep learning approaches7. In their 2020 review article, Zlochower et al. describe the role and potential diagnostic capabilities of convolutional neural networks, a type of deep learning algorithm, for imaging gliomas6. With accuracies ranging from 80–90%, the various neural networks are reportedly proficient in categorizing gliomas as either low or high grade, predicting molecular/genetic abnormalities such as IDH mutations, 1p19q codeletions, and MGMT promoter status, and predicting overall survival6. Despite these demonstrable advances in artificial intelligence, application in a clinical setting remains limited.
We present a comprehensive dataset of post-treatment primary gliomas with serial surveillance imaging and accompanying clinical information. Two hundred and three glioma patients with 594 postoperative MRIs were segmented using the Federated Tumor Segmentation (FeTS), and Federated Learning for Postoperative Segmentation of Treated glioblastoma (FL-PoST) toolbox (https://fets-ai.github.io/FL-PoST/)8. Each segmentation was then manually refined by University of Missouri neuroradiologists to establish a the ground truth. In creating a public database of annotated post-treatment glioma MRIs, we aim to provide foundational data that will contribute to the development of more refined deep-learning algorithms in the future that may guide clinical decision-making and accurately assess response to treatment.
Methods
Study population
This retrospective analysis was conducted in compliance with the Health Insurance Portability and Accountability Act (HIPAA) and was approved by the University of Missouri Institutional Review Board (IRB #2096253 MU). The IRB granted a waiver of informed consent for the retrospective collection and sharing of de-identified patient data for this research.The University of Missouri - Anatomic Pathology CoPathPlus database (Oracle Cerner, North Kansas City, MO) was used to collect glioma cases over the last 10 years. The search was performed using CoPath Natural Language II, an integrated natural language processing tool that allows for text-based queries of unstructured data within pathology reports. This application enabled a comprehensive search of the full text of all reports, rather than relying solely on coded diagnostic fields. The selection criteria for this search included accession dates ranging from 01/01/2014 to 02/20/2024. To ensure all relevant diagnoses for this study were included; three separate key word searches were performed using “glioma”, “astrocytoma”, and “glioblastoma”. The search only included key word results that were present in the Final Diagnoses. “Glioma” returned 85 cases; “Astrocytoma” returned 67 cases; and “Glioblastoma” returned 215 cases. Duplicate cases were then removed, resulting in approximately 275 cases.
Following the exclusion of duplicate cases (cases missing any of the four requisite MR imaging sequences, and cases that failed processing through the pipeline) our final cohort comprised 203 patients (Fig. 1). This cohort included 84 women and 119 men, representing a diverse range of postoperative MR imaging timepoints (total of 594). The mean age of the cohort was 57.55 years (±1.02 years), with a notable age discrepancy between genders: the average age for females was 54 years, while for males it was 61 years. The majority of the patients were of White race, constituting 94.58% of the cohort (n = 192). Figure 2 presents the age and sex distribution of our dataset as as age pyramid. The racial and ethnic composition of the final cohort is summarized in Table 1.

Flowchart demonstrates the process of data collection and final data cohort with reasons of exclusion of cases.

Age pyramid illustrates the distribution of age and sex in our glioma dataset. Majority of our cohort around 50–79 years with slight older ages of male patients.
Clinical data
Basic demographic data, clinical datapoints, and tumor pathology were obtained through review of the electronic medical record (EMR). Clinical datapoints included the date of diagnosis, date of first surgery or treatment, and date of any follow-up resections. Patients with no further clinical contact beyond their primary treatment were documented as “lost to follow-up.”
Among the primary brain tumors identified, glioblastoma (GBM) was the most prevalent, accounting for 77.34% of cases (n = 157). The second most common diagnosis was Grade 2 astrocytoma, observed in 13.79% of the patients (n = 28). Surgical interventions varied within the cohort; 6.9% of patients (n = 14) underwent a stereotactic biopsy prior to tumor resection. Additionally, 25.12% of patients (n = 51) experienced multiple surgical procedures. These demographic and clinical characteristics provide a comprehensive overview of the patient population and the complexity of their surgical and diagnostic trajectories.
Genetic mutations and molecular alterations
Our team meticulously cataloged the genetic mutations and molecular alterations associated with various brain tumors. Pathological information was obtained through review of the initial pathology note and any subsequent addenda for each tumor sample and included final tumor diagnosis, grade, and any identified genetic mutations. A comprehensive summary of all genetic mutations and molecular alterations identified in our dataset is provided in Table 2. This table consolidates the prevalence of various mutations, highlighting their distribution across different tumor grades and types. This detailed genetic profile offers valuable insights into the molecular underpinnings of brain tumors and aids in understanding the heterogeneity and evolutionary trajectories of these malignancies.
Survival data
Survival information included the date and nature of the first and/or subsequent disease progression or recurrence, the date of death, or—if the date of death was unknown—the date of last known contact while the patient was still alive. Disease progression and/or recurrence was characterized as imaging only, clinical only, or both based on information obtained through review of each patient’s clinical notes, brain imaging, and clinical impression as documented by the primary care team. Brief summaries of the reasoning behind each characterization were also included.
MRI acquisition and imaging data
The compiled spreadsheet was used to export available MRI studies on our McKesson Radiology 12.2 Picture archiving and communication system (PACS; Change Healthcare Radiology Solutions, Nashville, Tennessee, U.S). The image exportation process involved multiple personnel of varying ranks, including medical students, radiology residents, neuroradiology fellows, and neuroradiologists. Our team exported the four basic conventional MR sequences including T1, T1 with IV gadolinium-based contrast agent administration, T2, and Fluid Attenuated Inversion Recovery (FLAIR) into a HIPAA compliant MU secured research server.
The majority of the studies were conducted using Siemens MRI machines (97.47%, n = 579), with a smaller proportion performed on MRI machines from other vendors: GE (2.02%, n = 12) and Philips (0.51%, n = 3). Table 3 shows the distribution of studies across different Siemens MR machines. Regarding the magnetic field strength, 1.5 T MRIs accounted for 45.08% (n = 318), and 3 T MRIs accounted for 45.08% (n = 261). Table 4 summarizes the MRI parameters of each MR sequence.
Our team made efforts to obtain 3D sequences whenever available. Scans were performed using 3D acquisition methods in 40.28% of cases (n = 975) and 2D acquisition methods in 59.82% of cases (n = 1,419). In cases where 3D images were not available, 2D images were utilized. Table 5 summarizes the counts and percentage of studies performed with 2D vs 3D acquisition across different MR sequences.
For each patient, the images were thoroughly checked for including up to six post-treatment images as available. The post-treatment images were captured on different dates, though not all patients had the maximum number of follow-up images; some had as few as one post-treatment follow-up MRI. For patients with more frequent follow-up MRIs, the immediate post-operative scan, at least one timepoint of progression and another follow-up study. Table 6 shows the average time interval between each follow-up MRI. The MR images were comprehensively reviewed to exclude significantly motion degraded or suboptimal studies.
Each scan was manually exported using the built-in McKesson DICOM export tool into separate folders labeled as post-treatment 1, post-treatment 2, etc. In a subsequent step, a subset of the data was selected to contribute for the development of FL-PoST toolbox. Consequently, the naming convention was updated to replace “post-treatment” with “timepoint” (e.g., post-treatment 1 became timepoint 1) to adhere to the instructions of the FL-PoST development team. Each sequence was saved in its own folder within these categories to a HIPAA compliant and secured server within the University of Missouri network. Exportation was conducted in DICOM format, maintaining the original image compression settings to preserve quality. To ensure patient privacy and HIPAA compliance, all images were anonymized and all protected health information (PHI), including patient name, medical record number (MRN), and accession number, were deleted from the metadata DICOM headers.
Preprocessing pipeline and data deidentification
The multiparametric MRI data were preprocessing using the Federated Tumor Segmentation (FeTS) tool8. Raw Digital Imaging and Communications in Medicine (DICOM) files were curated into the FeTS-compliant directory structure to ensure standardized labeling of T1-weighted, contrast-enhanced T1-weighted (T1-Gd), T2-weighted, and FLAIR sequences, following the BraTS convention. The pipeline began with converting DICOM files to the Neuroimaging Informatics Technology Initiative (NIfTI) format using dcm2niix, ensuring the removal of any remaining PHI not eliminated by the anonymization/deidentification tool9,10,11. The converted NIfTI images were then resampled to an isotropic 1 mm³ resolution and co-registered to the standard anatomical human brain atlas, SRI24 via rigid-body transformation using the CapTK/Greedy registration tool12,13. Intensity non-uniformities were corrected using the N4ITK bias field correction algorithm to reduce magnetic field inhomogeneity and enhance inter-sequence alignment14. Automated brain extraction was performed with BrainMaGe, a deep-learning–based skull-stripping algorithm designed for robust performance in the presence of tumor-induced anatomical distortion15,16. This step removed extracranial structures including the skull, fat and ocular tissues, thereby improving downstream registration accuracy and mitigating any potential facial reconstruction or recognition risks.
Automatic segmentation model
Tumor sub-compartment segmentation was performed using deep learning models integrated in the FeTS pipeline, including nnU-Net, DeepMedic, and DeepScan8,17,18,19. These models were trained on BraTS datasets and post-treatment glioma cohorts using a five-fold cross-validation strategy to optimize generalizability. Training incorporated data augmentation (random flipping, rotation, intensity perturbation) and employed standard nnU-Net hyperparameters: patch size of 128 × 128 × 128 voxels, batch size of 2, initial learning rate of 1e-4 with polynomial decay, and the Adam optimizer with momentum terms β1 = 0.9, β2 = 0.999. Early stopping was triggered when validation loss plateaued.
A subset of the dataset was processed using FeTS version 2, which incorporates the FL-PoST networks from the RANO Federated Learning Study (https://fets-ai.github.io/FL-PoST/). In contrast to version 1, FeTS v2 leverages self-configuring 3D U-Net architectures (nnU-Net) optimized for heterogeneous post-operative glioma data. Networks were trained in a federated learning setting across multiple institutions using the FedAvg aggregation strategy with adaptive client weighting, five-fold cross-validation, and extensive on-the-fly data augmentation (random rotation up to ±15°, scaling up to ±10%, Gaussian noise injection, and intensity shifts). Training employed a batch size of 2 with 128 × 128 × 128 voxel patches, an initial learning rate of 1 × 10⁻⁴ (Adam optimizer, β1 = 0.9, β2 = 0.999), polynomial learning rate decay, and a composite Dice–cross entropy loss function to improve sensitivity to small enhancing regions. Postprocessing included thresholding at 0.5 probability maps, removal of spurious connected components (<20 voxels), and label consistency checks across sub-compartments (enhancing tumor, non-enhancing tumor core, and peritumoral edema).
FeTS-integrated models employed stratified five-fold cross-validation to minimize overfitting and ensure stable performance across diverse tumor types. Reproducibility was maintained by fixing random seeds during model initialization, while model performance was systematically evaluated using standard metrics, including the Dice similarity coefficient (DSC), Hausdorff distance (HD95), and volumetric overlap error (VOE).
Output of automatic tumor segmentation
The pipeline resulted in tumor segmentations with four distinct labels that correspond to different components of each tumor (Fig. 3):
-
Label 1: Non-enhancing Tumor Core (NETC). This label identifies non-enhancing components within the tumor, such as cystic, necrotic, or hemorrhagic portions.
-
Label 2: Surrounding Non-enhancing FLAIR Hyperintensity (SNFH). This label represents both non-enhancing infiltrative tumor components and peritumoral vasogenic edema.
-
Label 3: Enhancing Tissue (ET). This label highlights the viable nodular enhancing components of the tumor.
-
Label 4: Resection Cavity (RC). This label covers post-surgical changes, including recent changes like blood products and air foci, as well as chronic changes with materials isointense to CSF signal.

Different segmentation sub compartments of multicentric GBM with multiple bi-cerebral heterogeneously enhancing masses. Top image panel (a–d) shows the pre-segmented, co-registered and skull stripped T1 weighted image (a), T2 weighted image (b), FLAIR image (c), and T1 following IV gadolinium-based contrast administration (d). Bottom image panel (e–h) demonstrates the overlay of the different segmentation labels in respect to the corresponding tumor sub-compartment i.e. enhancing tumor (blue), non-enhancing tumor core (red), surrounding non-enhancing T2/FLAIR hyperintensity (green), and the resection cavity (yellow).
The outputs were combined using STAPLE which enhance robustness by fusing multiple model predictions while accounting for model-specific biases8. To ensure consistent labeling of tumor compartments across institutions, segmentation outputs adhered to BraTS-defined labels. Label consistency was checked by enforcing unique label sets and intensity thresholds across the preprocessed volumes.
Data Records
The MU-Glioma Post dataset is publicly available in The Cancer Imaging Archive (TCIA)20. The dataset is organized by patient, with subfolders for each imaging timepoint. The dataset is publicly available through The Cancer Imaging Archive (TCIA) under the collection MU Glioma Postoperative (Mu-Glioma-Post) (https://www.cancerimagingarchive.net/collection/mu-glioma-post/) and is shared under a Creative Commons Attribution (CC-BY) license20. Data can be accessed through the TCIA portal by registering for a free account and downloading via the web interface or the NBIA Data Retriever for bulk access.
The collection is organized into three main categories: images and segmentations, clinical data, and segmentation volumes. The imaging component includes preprocessed MR images acquired at multiple follow-up timepoints after tumor resection. These data are skull-stripped, coregistered, resampled, and stored in compressed NIfTI (.nii.gz) format. Within each patient folder, subfolders correspond to individual timepoints, and each timepoint contains four MR sequences: native T1-weighted (t1n), contrast-enhanced T1 (t1c), T2-weighted (t2w), and T2-FLAIR (t2f). Segmentation masks accompany these images and are labeled as follows: Label 1, non-enhancing tumor core (NETC); Label 2, surrounding non-enhancing FLAIR hyperintensity (SNFH); Label 3, enhancing tissue (ET); and Label 4, resection cavity (RC).
The clinical data are provided in tabular (CSV) format with one row per patient and column headings that capture demographics, pathology, molecular features, treatments, imaging schedule, and outcomes. Key variables include patient demographics (sex at birth, race, age at diagnosis), diagnostic information (primary tumor type and grade), molecular markers (e.g., IDH1/2, 1p/19q, ATRX, MGMT, EGFR, PTEN, TP53), treatment details (surgical procedures, chemotherapy, radiotherapy, immunotherapy, brachytherapy, and additional therapies), clinical outcomes (progression events, recurrence, overall survival, hospice care), and imaging intervals (number of days from diagnosis to each of up to six MRI timepoints).
Finally, the segmentation volumes provide quantitative features extracted from each labeled region of the tumor segmentation at each timepoint. These include voxel counts and volumes (mm³) as well as intensity statistics (mean and standard deviation) from each MR sequence (T1n, T1c, T2w, T2f) within each label-defined region. Together, these three components (images and segmentations, clinical data, segmentation volumes) provide a comprehensive multimodal dataset for the study of postoperative glioma.
Technical Validation
To ensure the accuracy of the automated segmentations and establish the ground truth, all results were subjected to a rigorous, three-tiered manual quality control protocol. This expert-in-the-loop process began with an initial review and manual correction performed by a medical student with three years of neuro-oncology annotation experience. Subsequently, the refined segmentations were independently reviewed by a team comprising two radiology residents and a neuroradiology fellow. The final step required consensus approval from two board-certified neuroradiologists, each with five years of experience, for a segmentation to be accepted as the definitive ground truth. This meticulous review focused on correcting common automated errors, such as misclassification of tissue near resection cavities, radiation necrosis, and non-enhancing tumor margins (Fig. 4). This hybrid pipeline, combining deep learning segmentation with multi-layered expert validation, was designed to maximize objectivity and reproducibility while minimizing systematic error.

Correction of a suboptimal automated segmentation. Panels (a) and (c) show an example of automated segmentation failure, where the model incompletely outlined the resection cavity. Panels (b) and (d) display the result after manual refinement to ensure the entire cavity was accurately labeled for the ground-truth dataset.
During the label refinement stage, set of errors of automated segmentations were encountered:
-
Errors due to T1 hyperintensity:
-
Erroneous inclusion of T1 hyperintensity and misclassification as enhancing tumor component (Fig. 5).
Fig. 5 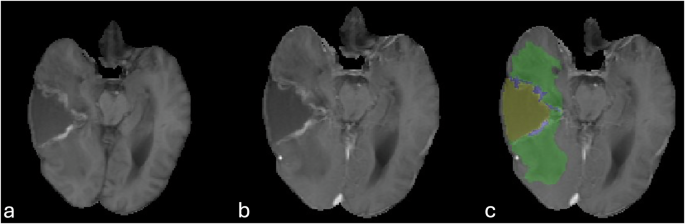
Misclassification of the T1 shortening of the resection cavity rim as enhancing tumor label. Peripheral T1 hyperintensity of the anteromedial and posteromedial margins of the resection cavity (a), without change in T1 following IV gadolinium-based contrast administration (b). Note wrong assignment of the enhancing tumor label (blue, c).
-
T1 hyperintense signals within the resection cavity were incorrectly and misclassified as non-enhancing hemorrhagic tumor component instead of blood products within the resection cavity (Fig. 6).
Fig. 6 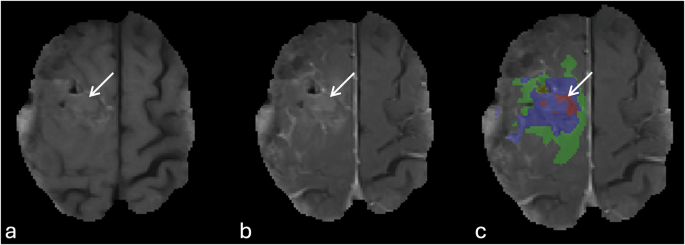
An example of misclassification of T1 hyperintensity within the center of the resection cavity. T1 hyperintense material within the resection cavity with fluid level, and foci of pneumocephalus without corresponding enhancement (arrows, a & b). The segmentation overlay image shows the wrong assignment of the T1 hyperintensity as enhancing tumor (blue), and non-enhancing tumor core (red).
-
-
Errors related to T2/FLAIR images:
-
Oversampling of peritumoral non-enhancing T2/FLAIR hyperintensities (Fig. 7a,d).
Fig. 7 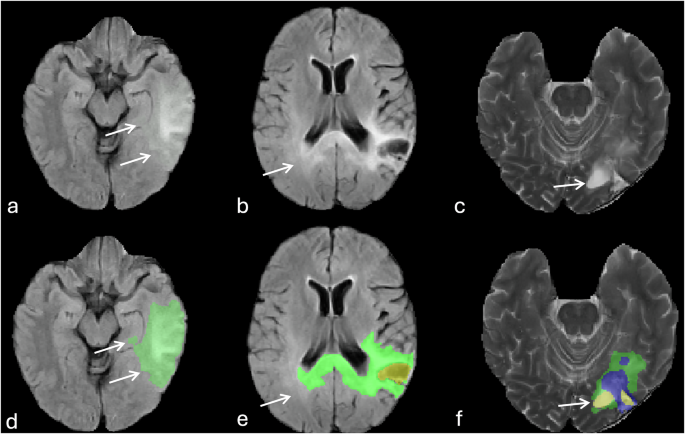
Errors of automatic tumor segmentation related to T2 and FLAIR signal abnormalities. (a, and d) image show the oversampling of FLAIR hyperintensities surrounding the tumor (arrows). (b, and e) images show incomplete delineation of FLAIR hyperintensities particularly in the contralateral occipital lobe (arrows). (c, and f) images represent misidentification of ventricular zone (occipital horn of the left lateral ventricle, arrows) adjacent to the tumor an assigning it as part of the resection cavity (yellow).
-
Incomplete delineation and under sampling of the non-enhancing T2/FLAIR hyperintensities surrounding the tumor and missing infiltrative component particularly crossing the midline into contralateral cerebral hemisphere (Fig. 7b,e)
-
Overlapping of non-enhancing T2/FLAIR hyperintensities with white matter microvascular changes or post-treatment leukoencephalopathy.
-


-
Incorrect segmentation and improper assignment of ventricular regions adjacent to the tumor as non-enhancing tumor or resection cavity (Fig. 7c,f).
-
Suboptimal delineation or failure to accurately identify or properly delineate the resection cavity (Fig. 8).
Fig. 8 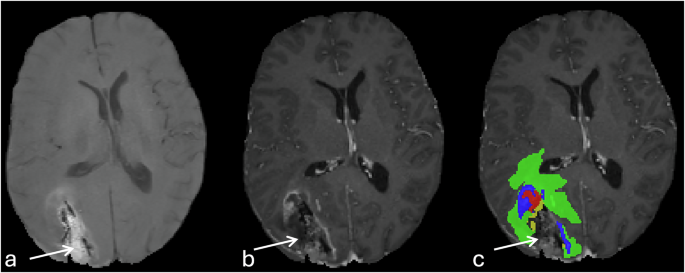
Failure of automatic delineation of the resection cavity. The image panel (a–c) indicate the incomplete segmentation of the right occipital resection cavity (arrows).

Quantitative performance evaluation
To provide a performance baseline for the automated segmentation pipeline, we conducted a quantitative comparison of the raw automated predictions against the final, manually refined ground truth labels. The evaluation was performed on the entire cohort using the predictions generated from our five-fold cross-validation setup, ensuring that the model evaluating each case had not been trained on that specific case’s data.
Performance was assessed using the Dice Similarity Coefficient (DSC) to evaluate the volumetric overlap, Jaccard index, and the 95th percentile Hausdorff Distance (HD95) to measure boundary delineation errors. The results, averaged across all patients, are presented for the three standard tumor sub-regions: Whole Tumor (WT), Tumor Core (TC), and Enhancing Tumor (ET) (Table 7).
Volumetric analysis
After refining the automatic tumor segmentations, volume of each label was extracted as follows: mean volume of Necrotic Tumor Core (Label 1), Tumor Infiltration and Edema (Label 2), Enhancing Tumor Core (Label 3), and Resection Cavity (Label 4) was 4738.34 ± 530.93, 58210.47 ± 2003.37, 13132.90 ± 739.35, and 11742.11 ± 801.14 mm3 respectively. The mean signal intensity of each tumor component (label) on each MR sequence was summarized in Table 8.
Limitations
This dataset and its creation have several limitations that should be considered by future users. First, the dataset was aggregated from retrospective clinical data, which introduces inherent variability. While all scans were manually reviewed for quality, there is significant scanner and protocol heterogeneity. The data were acquired on multiple MRI systems from different vendors (Siemens, GE, Philips) at both 1.5 T and 3 T field strengths, with considerable variation in acquisition parameters such as slice thickness and TR/TE (summarized in Tables 3, 4). While this reflects real-world clinical diversity, it is a potential confounder for developing AI models that require harmonized data. Second, while the manual refinement of segmentations by expert neuroradiologists establishes a high-quality ground truth, this process is not immune to potential biases. Despite our use of a standardized annotation protocol and consistency checks, inherent inter-rater and intra-rater variability in delineating tumor margins, particularly in complex post-treatment cases, remains a limitation. Finally, the clinical data, while comprehensive, is subject to the limitations of retrospective EMR review, including the potential for missing data points and variability in clinical reporting across the 10-year collection period. These factors should be taken into account when using this dataset for model development and validation.
Data availability
The MU-Glioma Post dataset is publicly available in The Cancer Imaging Archive (TCIA)20.
Code availability
All custom code used for the data processing and tumor segmentation pipeline described in this manuscript is openly available on GitHub. The repository can be accessed at: https://github.com/amnmed09/MU_Glioma_Post_segmentation_pipeline.
References
Ostrom, Q. T. et al. CBTRUS Statistical Report: Primary Brain and Other Central Nervous System Tumors Diagnosed in the United States in 2015–2019. Neuro-Oncol. 24, v1–v95 (2022).
Parvez, K., Parvez, A. & Zadeh, G. The Diagnosis and Treatment of Pseudoprogression, Radiation Necrosis and Brain Tumor Recurrence. Int. J. Mol. Sci. 15, 11832–11846 (2014).
Stupp, R. et al. Radiotherapy plus Concomitant and Adjuvant Temozolomide for Glioblastoma. N. Engl. J. Med. 352, 987–996 (2005).
Taal, W. et al. Incidence of early pseudo‐progression in a cohort of malignant glioma patients treated with chemoirradiation with temozolomide. Cancer 113, 405–410 (2008).
Kano, H. et al. T1/T2 Matching to Differentiate Tumor Growth From Radiation Effects After Stereotactic Radiosurgery. Neurosurgery 66, 486–492 (2010).
Zlochower, A. et al. Deep Learning AI Applications in the Imaging of Glioma. Top. Magn. Reson. Imaging 29, 115–00 (2020).
Cho, S. J. et al. Brain metastasis detection using machine learning: a systematic review and meta-analysis. Neuro-Oncol. 23, 214–225 (2021).
Pati, S. et al. The federated tumor segmentation (FeTS) tool: an open-source solution to further solid tumor research. Phys. Med. Biol. 67, 204002 (2022).
Schwarz, C. G. et al. Identification of Anonymous MRI Research Participants with Face-Recognition Software. N. Engl. J. Med. 381, 1684–1686 (2019).
Greenspan, H., Van Ginneken, B. & Summers, R. M. Guest Editorial Deep Learning in Medical Imaging: Overview and Future Promise of an Exciting New Technique. IEEE Trans. Med. Imaging 35, 1153–1159 (2016).
Li, X., Morgan, P. S., Ashburner, J., Smith, J. & Rorden, C. The first step for neuroimaging data analysis: DICOM to NIfTI conversion. J. Neurosci. Methods 264, 47–56 (2016).
Rohlfing, T., Zahr, N. M., Sullivan, E. V. & Pfefferbaum, A. The SRI24 multichannel atlas of normal adult human brain structure. Hum. Brain Mapp. 31, 798–819 (2010).
Pati, S. et al. The Cancer Imaging Phenomics Toolkit (CaPTk): Technical Overview. Brainlesion Glioma Mult. Scler. Stroke Trauma. Brain Inj. BrainLes Workshop 11993, 380–394 (2020).
Tustison, N. J. et al. N4ITK: Improved N3 Bias Correction. IEEE Trans. Med. Imaging 29, 1310–1320 (2010).
Thakur, S. et al. Brain extraction on MRI scans in presence of diffuse glioma: Multi-institutional performance evaluation of deep learning methods and robust modality-agnostic training. NeuroImage 220, 117081 (2020).
Thakur, S. P. et al. Skull-Stripping of Glioblastoma MRI Scans Using 3D Deep Learning. in Brainlesion: Glioma, Multiple Sclerosis, Stroke and Traumatic Brain Injuries (eds Crimi, A. & Bakas, S.) vol. 11992 57–68 (Springer International Publishing, Cham, 2020).
McKinley, R., Meier, R. & Wiest, R. Ensembles of Densely-Connected CNNs with Label-Uncertainty for Brain Tumor Segmentation. in Brainlesion: Glioma, Multiple Sclerosis, Stroke and Traumatic Brain Injuries (eds Crimi, A. et al.) vol. 11384, 456–465 (Springer International Publishing, Cham, 2019).
Isensee, F. et al. Automated brain extraction of multisequence MRI using artificial neural networks. Hum. Brain Mapp. 40, 4952–4964 (2019).
Kamnitsas, K. et al. Efficient multi-scale 3D CNN with fully connected CRF for accurate brain lesion segmentation. Med. Image Anal. 36, 61–78 (2017).
Yaseen, D. et al. University of Missouri Post-operative Glioma Dataset. The Cancer Imaging Archive https://doi.org/10.7937/7K9K-3C83 (2025).
Acknowledgements
The authors are grateful for the University of Missouri for the approval of contributing this dataset into public repository. The authors are also thankful for the BraTS and FL-PoST teams. This research did not receive any source of funding.
Author information
Authors and Affiliations
Contributions
E.M. has significantly refined the manuscript, prepared the revised version, and provided a point-by-point response to reviewer comments, J.G. has drafted the manuscript, actively contributed to data collection and label refinement; J.G. has compiled the clinical data for the available patients’ data list; Y.D., E.I., J.T., E.M. and N.T. actively participated in data collection and contributed to label refinement; F.G., J.S., L.L. searched the pathology registry and provided the team with glioma patient list; T.A. critically reviewed the manuscript; A.N. supervised data collection, ran the pre-processing pipeline, contributed to label refinement, and carefully reviewed the manuscript. All authors have reviewed the manuscript and approved its publication.
Corresponding authors
Ethics declarations
Competing interests
The authors declare no competing interests.
Additional information
Publisher’s note Springer Nature remains neutral with regard to jurisdictional claims in published maps and institutional affiliations.
Rights and permissions
Open Access This article is licensed under a Creative Commons Attribution-NonCommercial-NoDerivatives 4.0 International License, which permits any non-commercial use, sharing, distribution and reproduction in any medium or format, as long as you give appropriate credit to the original author(s) and the source, provide a link to the Creative Commons licence, and indicate if you modified the licensed material. You do not have permission under this licence to share adapted material derived from this article or parts of it. The images or other third party material in this article are included in the article’s Creative Commons licence, unless indicated otherwise in a credit line to the material. If material is not included in the article’s Creative Commons licence and your intended use is not permitted by statutory regulation or exceeds the permitted use, you will need to obtain permission directly from the copyright holder. To view a copy of this licence, visit http://creativecommons.org/licenses/by-nc-nd/4.0/.
About this article

Cite this article
Mahmoud, E., Gass, J., Dhemesh, Y. et al. MU-Glioma Post: A comprehensive dataset of automated MR multi-sequence segmentation and clinical features. Sci Data 12, 1847 (2025). https://doi.org/10.1038/s41597-025-06011-7
Received:
Accepted:
Published:
Version of record:
DOI: https://doi.org/10.1038/s41597-025-06011-7
