
Abstract
Human Activity Recognition (HAR) has become an active research area in recent years due to its applicability in various domains and the growing need for convenient facilities and intelligent homes for the elderly. Physical activity tends to decrease as people age, along with their ability to perform day-to-day tasks, which affects both mental and physical health. Several investigators apply deep learning (DL) and machine learning (ML) approaches to recognize human activities, but minimal investigations are concentrated on human activity recognition of older adults. Recently, the DL method has demonstrated excellent performance in classifying human activities using HAR information. Therefore, this study introduces an Advanced Smart Human Activity Recognition for Disabled People Using Deep Learning with a Snake Optimiser (AHARDP-DLSO) approach. The purpose of the AHARDP-DLSO technique is to provide an efficient deep learning-based HAR model designed to detect and classify the daily activities of individuals with disabilities with high precision and adaptability. Primarily, the min-max normalization is utilized for data normalization to ensure consistent input data quality. Furthermore, the AHARDP-DLSO technique utilizes the deep belief network (DBN) model for the classification process. To further enhance performance, the hyperparameter tuning of the DBN method is performed by using the snake optimizer algorithm (SOA) model. The experimental validation of the AHARDP-DLSO method is performed under the WISDM dataset. The comparison study of the AHARDP-DLSO method revealed a superior accuracy value of 95.81% compared to existing models.
Introduction
In recent times, HAR is one of the most efficient techniques to facilitate persons with disabilities. As a key research speciality in computer vision (CV), HAR has applications in various areas, ranging from human-computer interfaces to medical care1. With the advancement of technology, such as imaging methods and camera devices, new HAR conditions are continually evolving. Given its capability to bring higher-level visions into human activities from raw sensor inputs, HAR is utilized in fields such as gesture recognition, gait studies, home behaviour studies, and video surveillance2. Video-based HAR, which observes images or videos that contain sensor-based HAR, and human motion, which uses smart sensor data, such as accelerometers, gyroscopes, or sound sensors, are the two major classifications of HAR3. With the growing accessibility of robust crypto-systems and the ubiquity of smart sensor technology for creating specific sensor-based HAR data, privacy is gaining popularity. Several types of sensors are examined for their potential to enhance the accuracy of activity recognition4. As a result, mobile and fixed sensors have evolved as sources for various approaches to identifying human activities, depending on how sensors are utilized within a specific setting. Mobile sensor-based approaches utilize specific movement sensors found on the body5. The general usage of HAR is helpful for the quality and safety of human life. The presence of devices, such as video cameras, sensors, Wi-Fi, and radio frequency identification (RFID), is not a recent development. However, the use of these devices in HAR is still in its early stages6. The purpose of HAR’s development is to rapidly advance methods, such as artificial intelligence (AI), which enable the use of these devices in various application areas. For this reason, there is a common relationship between AI models or methods and HAR devices7.
Previously, these models relied on a single or small order of images, but developments in AI have now offered more opportunities. As observed, the development of HAR corresponds to the development of AI, which expands the scope of HAR in several application areas8. In usual activity recognition approaches, authors have often used an ML method, namely a random forest (RF), decision tree (DT), support vector machine (SVM), and naïve bayes (NB), to identify actions from characteristic vectors that come from indications in a window period using statistical values or Fourier alteration. Recurrent neural networks (RNNs) have a directed, closed cycle. RNNs are suitable for handling time-series datasets, such as audio and video, as well as natural language signals9. Now, hierarchical multi-layered convolutional neural networks (CNNs) have achieved noticeable results in areas such as image capturing and are processing the consideration of an approach called DL. In this way, as the RNN contains deep levels for temporal direction, it comes to take over as a DL technique10. HAR plays a significant role in enhancing the independence and quality of life for individuals with disabilities. Accurate interpretation of complex human movements is now possible in real-time, thanks to the rapid advancement of AI models and sensor technologies. Developing intelligent systems that can seamlessly understand and respond to human actions can significantly improve assistive devices and healthcare monitoring. Moreover, incorporating innovative optimization with AI models provides more precise and efficient activity recognition. These developments motivate the creation of smarter, adaptive solutions that effectively support people with disabilities.
This study introduces an Advanced Smart Human Activity Recognition for Disabled People Using Deep Learning with a Snake Optimiser (AHARDP-DLSO) approach. The purpose of the AHARDP-DLSO technique is to provide an efficient deep learning-based HAR model designed to detect and classify the daily activities of individuals with disabilities with high precision and adaptability. Primarily, the min-max normalization is used for data normalization to ensure consistent input data quality. Furthermore, the AHARDP-DLSO technique utilizes the deep belief network (DBN) model for the classification process. To further enhance performance, the hyperparameter tuning of the DBN method is performed by using the snake optimizer algorithm (SOA) model. The experimental validation of the AHARDP-DLSO method is performed under the WISDM dataset. The significant contribution of the AHARDP-DLSO method is listed below.
-
The AHARDP-DLSO technique effectively applies min-max normalization to pre-process data, ensuring that input features are scaled within a consistent range. This step enhances the stability and performance of the learning process by preventing features with larger ranges from dominating the model training.
-
The AHARDP-DLSO method utilizes the DBN approach to perform robust classification by capturing intrinsic patterns in the data through its layered architecture. This approach enhances the model’s capability to learn hierarchical feature representations, leading to improved accuracy and generalization.
-
The AHARDP-DLSO approach integrates the SOA model to optimally tune hyperparameters, enabling efficient exploration of the search space. This optimization enhances model performance by identifying the optimal parameter settings that enhance convergence and accuracy.
-
The AHARDP-DLSO methodology introduces a novel approach by incorporating the DBN and SOA models for tuning and classification by effectively searching the hyperparameter space. The synergy between DBN’s deep feature learning and SOA’s adaptive tuning creates a more effective and flexible model. This innovation sets the proposed method apart from conventional static tuning techniques.
Related works
Almalki et al.11 propose a HAR model, namely the bat optimization algorithm integrated with an ensemble voting classifier for HAR (BOA-EVCHAR). This approach employs ensemble classification to detect HAR in the IoT atmosphere. In the initial stage, data pre-processing is accomplished. For HAR detection and classification, an integration of DBN along with long short-term memory (LSTM) classifier methodologies is implemented. Lastly, the BOA method is employed to select the optimal hyperparameter values for the DBN and LSTM methods. Alotaibi et al.12 present an Optimum Deep RNN for HAR (ODRNN-HAR) method. Initially, this approach allows IoT devices to accumulate HAR data. The pre-processing process of the proposed model is accomplished by implementing Z-score normalization. For efficient HAR, the presented methodology utilizes the DRNN model. Finally, the optimal hyperparameter alteration is achieved by utilizing the Mayfly Optimisation (MFO) technique. Febrianti et al.13 introduce a framework that integrates Light Gradient Boosting Machine (LGBM) with an Android application, which analyses user movement data, classifies activities, displays step counts per day, and rewards users for achieving movement targets. To address privacy concerns, user data is anonymized by utilizing Elliptic Curve Cryptography (ECC) blind signature. The system also implements the power of AI techniques in the Mobile Crowd Sensing (MCS) server to effectively discriminate between diverse activities with high accuracy and reliability. Alotaibi et al.14 propose a new Arithmetic Optimisation Algorithm with LSTM Autoencoder (AOA-LSTMAE) methodology. The P-ResNet method is utilized for the feature extraction process. Additionally, the LSTMAE classifier is implemented for detecting a diverse range of actions. To enhance the recognition effectiveness of the LSTMAE method, AOA is utilized for hyperparameter tuning. Kumar et al.15 present a design paradigm for an electronic wheelchair that integrates AI-assisted smart sensors and controllers. Core components include advanced sensors for environmental and health data, an intelligent controller driven by AI models, and motorized wheels for achieving seamless mobility. The smart sensors, which measure temperature, ECG, oxygen, and heart rate, contribute to real-time health monitoring and environmental awareness. The AI-assisted controller optimizes wheelchair navigation, giving a responsive and adaptive system. Alabdulkreem et al.16 introduce a Computer Vision with Optimum Deep Stacked Autoencoder Fall Activity Recognition (CVDSAE-FAR) methodology. The densely connected networking methodology is utilized for extracting features. Moreover, the DSAE method efficiently obtains and categorizes the feature vectors. Finally, the fruit fly optimization (FFO) methodology is employed for the hyperparameter tuning process. The performance validation of the presented technique is investigated on a standard dataset.
Alzahrani et al.17 propose an Indoor Activity Monitoring by utilizing the Chaotic Dwarf Mongoose Optimisation with DL (IAM-CDMODL) method. Primarily, the approach uses a bilateral filtering (BF) methodology for pre-processing. Additionally, the approach utilizes the MobileNetV2 (MN-V2) method to learn intrinsic and complex patterns from the pre-processed images. Furthermore, the CDMO method is employed for optimum hyperparameter selection associated with the MN-V2 technique. Finally, the deep CNN bi-directional LSTM (DCNN-BiLSTM) method is used to detect indoor activities. Ciortuz et al.18 compared models such as SVM, CNN, gated recurrent unit (GRU), LSTM, transformer, and hybrid Convolutional LSTM models with and without attention for classifying state and behavioural activities. Dahiya et al.19 proposed an attention-based capsule network model (At-CapNet) technique that integrates electroencephalography (EEG) and time-domain near-infrared spectroscopy (tNIRS) features from multiple brain regions. Kumar, Surendran, and Madhusundar20 compared RF and RNN models for developing a real-time intelligent system for human posture identification. Kim et al.21 developed a comprehensive framework by utilizing explainable artificial intelligence (XAI) integrated with ML models, namely RF, DT, XGBoost (XGB), and an ensemble voting classifier (EVC) for accurate activity recognition and anomaly detection in smart home environments. Thanarajan et al.22 developed an improved wolf swarm optimization with deep learning-based movement analysis and human activity recognition (IWSODL-MAHAR) methodology that uses dimensionality reduction, a hybrid DL model, and Nadam optimizer tuning to recognize human activities accurately. Choudhury and Soni23 presented a lightweight hybrid DL method, namely convolutional LSTM (ConvLSTM), to accurately classify human activities in individuals with knee abnormalities using physiological sensor data, optimized for performance and computational efficiency. Rizk and Hashima24 proposed RISense, a DL model integrating re-configurable Intelligent Surface (RIS) technology and RNN for accurate HAR in challenging real-world environments. Luo et al.25 developed ActivityMamba, a hybrid neural network incorporating CNN and visual Mamba for efficient and precise HAR. Prabagaran et al.26 presented a hybrid Siamese top-down neural network optimized by the popular optimization algorithm (Hyb-STDNN-POA) methodology for accurate HAR, integrating noise reduction and advanced feature extraction techniques to improve performance. Zohrevand, Mirzaei, and Sajedi27 proposed a model that utilizes deep neural network (DNN) models to enhance the accuracy and efficiency of HAR by effectively processing multidimensional sensor data and complex features. Dastbaravardeh et al.28 proposed a lightweight action recognition framework using CNN with Channel Attention Mechanisms (CNN-CAM) and AE to detect human actions in low-resolution and low-size videos. Aidarova et al.29 improved HAR by integrating multimodal sensor fusion with a transformer-based attention mechanism (AM) for more accurate and real-time classification. Rezaee30 proposed a real-time student activity monitoring system using a bidirectional LSTM–grey wolf optimizer (BiLSTM-GWO) framework. The model classifies accelerometer data with improved accuracy and efficiency, using DL and optimization for health monitoring in educational settings. Amrani et al.31 presented a homogenization method to integrate diverse HAR datasets into a unified framework, computed using simplified convolutional neural network (S-CNN) and LSTM models. Gupta and Khang32 developed an AI-driven workforce training systems tailored for individuals with physical disabilities by utilizing personalized learning algorithms, predictive analytics, and adaptive content delivery to enhance inclusivity, accessibility, and employability.
Although existing studies have exhibited significant advances in HAR using various ML and DL models, several limitations remain. Several models rely on intrinsic architectures, which can result in high computational costs and limited hardware compatibility. Models used in the tuning process primarily enhance training time, while various techniques focus on accuracy but overlook robustness in noisy or real-world environments. Sensor data variability and privacy concerns also remain inadequately addressed. The research gap is in developing lightweight, efficient models that strike a balance between accuracy, computational efficiency, and adaptability across diverse scenarios, while minimizing pre-processing and ensuring privacy. Addressing these challenges is crucial for the practical and scalable deployment of HAR. Additionally, most existing models lack generalizability to real-world, dynamic environments and face difficulty with unseen or ambiguous activity patterns.
The proposed method
In this study, the AHARDP-DLSO approach is proposed. The purpose of the AHARDP-DLSO approach is to provide an efficient DL-based HAR model designed to detect and classify the daily activities of individuals with disabilities with high precision and adaptability. It comprises three distinct stages, as shown in Fig. 1, involving data normalization, DBN-based HAR classification, and SOA-based parameter optimization.

Overall process of the AHARDP-DLSO approach.
Stage I: min-max normalisation
Primarily, the AHARDP-DLSO model performs a data normalization process by using the min-max normalization approach to ensure consistent input data quality33. This model is chosen for its simplicity and efficiency in scaling data to a fixed range in [0, 1]. The method prevents dominance by features with larger numeric ranges and ensures that all features contribute equally to the model training process. This normalization preserves the original distribution shape, which is beneficial when the data does not follow a Gaussian distribution. This also enhances convergence speed for various ML models by keeping input values within a consistent scale. Moreover, min-max normalization is computationally efficient and easy to implement, making it appropriate for massive datasets. Its ability to maintain the relative relationships between data points makes it an ideal choice in scenarios where feature scaling impacts model stability and accuracy.
It normalized each feature using Min-Max scaling, resulting in an interval of [0, 1]. Attaining a quicker convergence speed in DL methods, however, while guaranteeing none suppress the learning procedure, varies considerably with this normalization method. Numerous financial prediction models find MinMax helpful normalization, as it enhances performance with wide datasets containing various scales. The normalization equation is as demonstrated:
Here, \(\:x\) represents the unique value of a feature, \(\:{x}_{\text{m}\text{i}\text{n}}\) denotes the minimal feature value, and \(\:{x}_{\text{m}\text{a}\text{x}}\) signifies the maximal feature value.
Stage II: DBN-based HAR classification
Additionally, the AHARDP-DLSO technique employs the DBN classification model to recognize various activities34. This technique is chosen for its ability to learn hierarchical feature representations from raw sensor data. This technique automatically captures intrinsic patterns and temporal dependencies, thereby enhancing classification accuracy, unlike conventional ML techniques that depend on manual feature extraction. The layered structure of the model enables effective unsupervised pre-training, which facilitates better generalization and mitigates the risk of overfitting, particularly with limited labelled data. Compared to shallow models, DBNs present deeper insight into data characteristics, making them more robust to noise and variability in HAR signals. Moreover, DBNs exhibit robust performance across diverse HAR datasets, highlighting their effectiveness in recognizing diverse activities with high precision. Figure 2 illustrates the architecture of the DBN classifier.

DBN structure.
The DBN hierarchical architecture mainly contains a visible layer \(\:v=({v}_{1},\:{v}_{2},\:\cdots\:,\:{v}_{m})\) and a hidden layer (HL) \(\:h=({h}_{1},\:{h}_{2},\:\cdots\:,\:{h}_{n})\), while the \(\:h\)-layer comprises many RBM levels.
Let \(\:\theta\:=\{w,\:c,\:b\}\), where \(\:w\) represents the weight between\(\:\:h\) and\(\:\:v,\) \(\:c\) and \(\:b\) refer to the bias between\(\:\:h\) and\(\:\:v\). Formerly, the effect of a node in the \(\:h\) layer on the \(\:v\) layer is described below:
whereas \(\:E(v,\:h)\) follows the Bernoulli distribution.
Let the three coefficients of the Bernoulli distribution of the \(\:ith\) HL and the \(\:jth\) visible layer be \(\:{c}_{j},\) \(\:{b}_{j}\) and \(\:{w}_{j}.\)
Next, the part of each node in layer \(\:h\) on layer \(\:y\) is displayed below:
Successively, each of the nodes in the \(\:v\)-layer acts on the \(\:h\)‐layer as demonstrated:
The result of each \(\:y\)-layer node on the \(\:ith\:h\)‐layer node is depicted below:
The result of each \(\:h\)-tier node on the \(\:ith\) \(\:v\)‐tier node is exhibited below:
.
When \(\:{v}_{0},\) \(\:{v}_{1},\dots\:,{v}_{m}\) in \(\:v\) follow a self-determining uniform distribution, formerly the maximal probability approximation is gained by acquiring the natural logarithm of Eq. (4).
Whereas \(\:\eta\:(\eta\:>0)\) denotes a learning rate.
The outcome of the \(\:lth\) visual layer on the \(\:h\)-layer is stated below:
To obtain the main parameters of DBN, the sources are carried out for \(\:{w}_{ij},\) \(\:{b}_{j}\), and \(\:{c}_{j}\), respectively.
The relationship between the outcomes of the present iteration and the previous iteration is expressed below:
Lastly, the \(\:v\)-layer weight parameters of the DBN are resolved in reverse to define the network structure of the DBN.
Stage III: SOA-based parameter optimizer
To further enhance performance, the hyperparameter tuning of the DBN model is performed by using the SOA method35. This model is chosen for its robust exploration-exploitation balance and adaptive search behaviour. This technique effectually navigates intrinsic, high-dimensional search spaces, making it ideal for optimizing hyperparameters in DL models. The natural movement of snakes inspires this model, which dynamically adjusts its search patterns in response to feedback, resulting in faster convergence and improved solutions. It outperforms many metaheuristic algorithms by avoiding premature convergence and maintaining diversity among candidate solutions. Its simplicity, flexibility, and robustness make it a suitable choice for fine-tuning parameters in tasks such as classification, where performance heavily depends on optimal settings.
SO is stimulated by the mating and hunting behaviour of snakes, and its search procedure is separated into dual stages: exploitation and exploration. The exploration stage defines the environmental issues, such as food and temperature. At this stage, snakes primarily focus on finding food within their environment. It guarantees that SO can search the most significant possible number. The exploitation stage encompasses two transitional types, such as mate and fight modes, which are employed to enhance the SO’s search effectiveness. During the fight mode, every male snake will fight with each other to catch the best female snake, and every female snake will choose the best male snake. During the mating mode, the existence of mating behaviour is based on the quantities of temperature and food. When the mating behaviour occurs, the poor locations of snakes are upgraded for the succeeding iteration round. The SO model initiates by randomly generating the positions of snakes within the search space as given in Eq. (13).
Here, \(\:{U}_{i}\) represents the position of the \(\:ith\:\)snake. The term \(\:"rand\)"refers to a uniformly distributed random number in the range [0, 1], ensuring diversity in initialization. \(\:{U}_{min}\) and \(\:{U}_{max}\) represent lower and upper limits for the solution problem, respectively, which define the permissible range for snake positions. This initialization provides a broad and unbiased coverage of the search space, which is significant for effective exploration during the early optimization stages.
In the exploration stage, the behaviour of snakes is governed by two key environmental factors: food availability (\(\:Q\)) and temperature (\(\:Temp\)). These control how snakes explore the search space and are computed using Eq. (14).
Here, \(\:{c}_{1}=0.5,\) \(\:t\) denotes the present iteration count, and \(\:T\) signifies the maximal iteration count. If \(\:Q\:<\:0.25\), the snakes begin to update their locations randomly in search of food. The \(\:Q\) value simulates the availability of food, decreasing or increasing exponentially with iterations, which influences the snakes’ decision to explore or exploit. Meanwhile, \(\:Temp\) models environmental temperature, gradually reducing over time to shift the algorithm from exploration to exploitation. These two parameters dynamically control the balance between global search and local refinement.
During the exploitation state, when \(\:Q<0.25\) and \(\:Temp\) >0.6, snakes move toward the globally best solution found so far. This behaviour is described in the Eqs. (15–16).
Here, \(\:{U}_{i,m}(l+1)\) and \(\:{U}_{i,f}\left(l+1\right)\) are the updated positions of male and female snakes after mating. \(\:{U}_{i}\left(t\right)\) is the current position at iteration \(\:t\), and \(\:rand\in\:\left[\text{0,1}\right]\) introduces stochasticity. \(\:{c}_{3}\) is a scaling factor (usually 2), while \(\:Q\) controls behavioural conditions based on food availability. \(\:{M}_{m}\) and \(\:{M}_{f}\) denote the mating capabilities of male and female snakes, respectively, and are defined in Eq. (17).
Here, \(\:{f}_{i,f}\) and \(\:{f}_{i,m}\) are the fitness values of the female and male snakes. These mating equations help improve diversity and introduce new candidate solutions by simulating cooperative reproductive behaviour between genders within the population. This mechanism plays a significant role in refining the search space and avoiding premature convergence. After mate mode is finished, SO has a definite probability of entering the egg-laying period. This period can help the poor male and female snakes update their locations again. The SO’s pseudo code is specified in Algorithm 1.
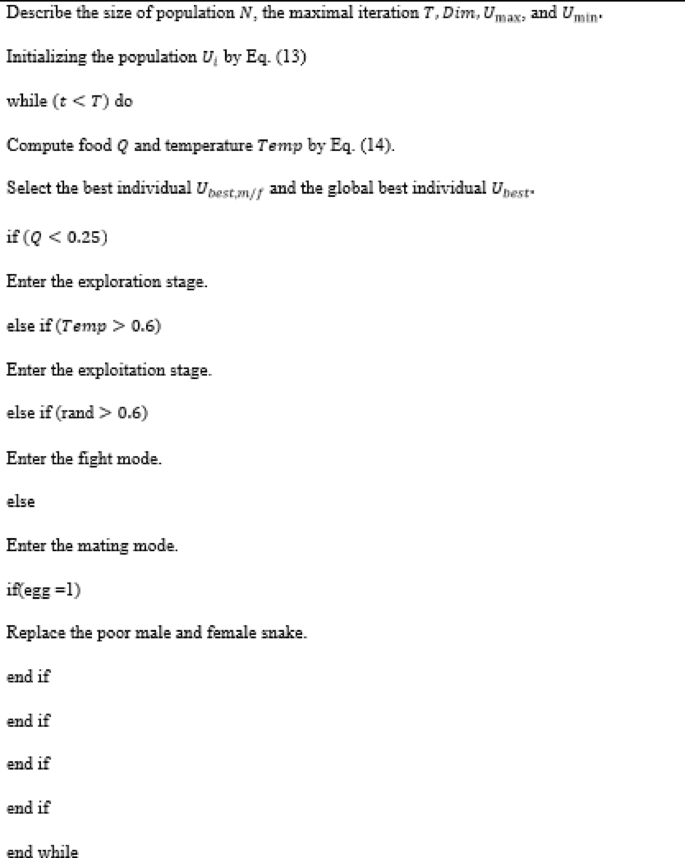
Pseudocode of the SOA model.
Fitness selection is a significant feature that influences the SOA performance. The hyperparameter choice procedure includes the solution encoder method to estimate the efficiency of the candidate solutions. In this section, the SOA considers accuracy as the primary condition for designing the fitness function, as stated.
Here, \(\:TP\) and \(\:FP\) represent the true positive and false positive values, respectively.
Result analysis and discussion
This article examines the performance of the AHARDP-DLSO technique under the WISDM dataset36. The dataset comprises 15,000 samples across six classes, as shown in Table 1. The total number of features is 128. The highest and lowest frequencies are walking (38.6%) and standing (4.4%), respectively. Afterwards, 36 subjects who were essential to implementing specific daily tasks while shifting an Android phone in their front pants pocket instituted the innovative purpose of WISDM. An accelerometer with a 20-Hz sample rate functioned as the sensor, while a motion sensor is also commonly found in smartphones. Walking (Walk), Standing (Std), upstairs (Up), sitting (Sit), jogging (Jogging), and downstairs (Down) were the documented activities. To ensure that the information was of superior value, a specific individual identified in the process examined the information gathering. The curated dataset ensures balanced class representation and reliable ground truth labeling for accurate model training and evaluation.
Figure 3 illustrates the classifier results of the AHARDP-DLSO approach on the test dataset. Figure 3a and b show the confusion matrix with the accurate identification and classification of all 6 class labels on a 70%TRASE and 30%TESSE. Figure 3c illustrates the PR study, demonstrating enhanced performance across all class labels. Lastly, Fig. 3d represents the ROC investigation, signifying efficient results with high ROC values for discrete class labels.

(a-b) Confusion matrices and (c-d) PR and ROC curves.
In Table 2; Fig. 4, brief recognition results for the AHARDP-DLSO approach are presented for 70%TRASE and 30%TESSE. The results indicate that the AHARDP-DLSO approach can efficaciously identify the samples. With 70%TRASE, the AHARDP-DLSO model achieves an average \(\:acc{u}_{y}\) of 95.48%, \(\:pre{c}_{n}\) of 86.50%, \(\:rec{a}_{l}\) of 86.45, \(\:{F}_{score}\) of 86.41%, MCC of 83.74%, and Kappa of 83.80%. Meanwhile, with 30%TESSE, the AHARDP-DLSO model achieves an average \(\:acc{u}_{y}\) of 95.81%, \(\:pre{c}_{n}\) of 87.52%, \(\:rec{a}_{l}\) of 87.40, \(\:{F}_{score}\) of 87.40%, MCC of 89.93%, and Kappa of 85.00%.

Average of AHARDP-DLSO technique under 70%TRASE and 30%TESSE.
In Fig. 5, the TRA \(\:acc{u}_{y}\) (TRAAY) and validation \(\:acc{u}_{y}\) (VLAAY) outcomes of the AHARDP-DLSO technique under 70%TRASE and 30%TESSE \(\:acc{u}_{y}\) over 0–25 epochs are illustrated. The figure highlights that the TRAAY and VLAAY values exhibit an increasing trend, which indicates the capacity of the AHARDP-DLSO method to achieve optimal performance across multiple repetitions. Moreover, the TRAAY and VLAAY remained closed beyond the epochs, indicating minimal overfitting and revealing the maximum performance of the AHARDP-DLSO method, which guarantees consistent prediction on hidden samples.

\(\:Acc{u}_{y}\) outcomes of AHARDP-DLSO technique under 70%TRASE and 30%TESSE.
In Fig. 6, the TRA loss (TRALO) and VLA loss (VLALO) graphs of the AHARDP-DLSO approach are demonstrated under 70%TRASE and 30%TESSE. The loss values are computed throughout 0–25 epochs. The following TRALO and VLALO values illustrate a decreasing tendency, which indicates the ability of the AHARDP-DLSO technique to equalize the exchange between generalization and data fitting. The continual reduction in loss values as well as assurances of the superior performance of the AHARDP-DLSO technique and tuning the prediction results, eventually.

Loss outcomes of the AHARDP-DLSO technique under 70%TRASE and 30%TESSE.
To elucidate the higher performance of the AHARDP-DLSO method, a quick comparative analysis is concluded in both Table 3; Fig. 718,19,37,38,39. The results revealed that the EfficientNet B0 model showed minimal classification performance with \(\:acc{u}_{y}\) of 89.11%, \(\:pre{c}_{n}\) of 85.25%, \(\:rec{a}_{l}\) of 84.52%, and \(\:{F}_{score}\) of 83.26%. Likewise, the VGG16, Baseline, Xception, Inception-V3, and CNN models have tried to accomplish a somewhat closer classification solution. Simultaneously, the CNN-LSTM technique exhibited reasonable performance with \(\:an\:acc{u}_{y}\) of 95.25%, \(\:pre{c}_{n}\) of 81.38%, \(\:rec{a}_{l}\) of 81.64%, and \(\:{F}_{score}\) of 86.27%. Moreover, the SVM, GRU, and At-CapNet techniques attained slightly lesser values. The AHARDP-DLSO model illustrates promising performance with an \(\:acc{u}_{y}\) of 95.81%, \(\:pre{c}_{n}\) of 87.52%, \(\:rec{a}_{l}\) of 87.40%, and \(\:{F}_{score}\) of 87.40%.

Comparison analysis of the AHARDP-DLSO approach with existing models.
The computation time (CT) performance of the AHARDP-DLSO technique is compared with that of other existing models in both Table 4; Fig. 8. The results indicate that the AHARDP-DLSO technique achieves a CT of 2.12 s. Alternatively, the SVM, GRU, At-CapNet, CNN-LSTM, CNN, Baseline, VGG16, Inception-V3, Xception, and EfficientNet B0 approaches attained increased CT values of 7.99s, 6.23s, 7.98s, 4.62s, 3.52s, 3.97s, 6.44s, 5.23s, 7.40s, and 4.98s, respectively. Consequently, the AHARDP-DLSO approach is utilized for an accurate HAR classification process.

CT evaluation of AHARDP-DLSO methodology with existing techniques.
Table 5; Fig. 9 demonstrates the error analysis of the AHARDP-DLSO methodology with the existing models. The error analysis reveals that the models exhibit low performance, with \(\:acc{u}_{y}\) of 4.19–10.89%, \(\:pre{c}_{n}\) of 12.48–19.64%, \(\:rec{a}_{l}\) of 12.60–19.26%, and \(\:{F}_{score}\) ranging from 12.60 to 16.74% for all models. The baseline model illustrates an \(\:acc{u}_{y}\) of 10.45%, \(\:pre{c}_{n}\) of 14.94%, \(\:rec{a}_{l}\) of 13.42%, and \(\:{F}_{score}\) of 16.27%, showing modest performance. EfficientNet B0 achieves the highest \(\:acc{u}_{y}\) of 10.89% but maintains moderate \(\:pre{c}_{n}\) of 14.75%, \(\:rec{a}_{l}\) of 15.48%, and \(\:{F}_{score}\) of 16.74%, suggesting room for improvement. VGG16 and GRU models present higher \(\:rec{a}_{l}\) values of 19.26% and 18.71%, respectively, but their overall \(\:acc{u}_{y}\) and \(\:{F}_{score}\) remain low, implying many misclassifications. CNN-based models, comprising CNN-LSTM and CNN Classifier, exhibit higher \(\:pre{c}_{n}\) values above 18%, but lower \(\:rec{a}_{l}\) and \(\:acc{u}_{y}\), highlighting that they are more conservative in positive predictions. Overall, the low metric values across models highlight significant classification challenges and the necessity for additional model optimization and improved feature engineering.

Error analysis of AHARDP-DLSO approach with existing models.
Conclusion
In this article, the AHARDP-DLSO approach is proposed. The purpose of the AHARDP-DLSO approach is to provide an efficient DL-based HAR model designed to detect and classify the daily activities of individuals with disabilities with high precision and adaptability. It comprises three distinct stages: data normalization, DBN-based HAR classification, and SOA-based parameter optimization. Primarily, the AHARDP-DLSO model performs a data normalization process using the min-max normalization to ensure consistent input data quality. Moreover, the AHARDP-DLSO model uses the DBN classification approach to identify various activities. To further enhance performance, the hyperparameter tuning of the DBN model is performed by the SOA approach. The experimental validation of the AHARDP-DLSO method is performed under the WISDM dataset. The comparison study of the AHARDP-DLSO method revealed a superior accuracy value of 95.81% compared to existing models. The AHARDP-DLSO method may not fully reflect the variability seen in diverse real-world environments due to its evaluation on a single dataset. The model may also be sensitive to sensor noise or placement discrepancies, which can affect activity classification accuracy. While the model exhibits high performance under controlled conditions, its robustness under dynamic, multi-user, or multi-device scenarios remains unexplored. Computational efficiency on edge devices and real-time processing were not thoroughly addressed. Future works can involve cross-dataset validation, sensor fusion, and integration with real-world smart environments. Additionally, improving model interpretability and incorporating adaptive learning could improve practical deployment.
Data availability
The authors confirm that the data supporting the findings of this study are available within the benchmark dataset, accessible at https:/archive.ics.uci.edu/dataset/507/wisdm+smartphone+and+smartwatch+activity+and+biometrics+dataset36.
References
Yousefi, B. & Loo, C. K. Biologically-inspired computational neural mechanism for human action/activity recognition: a review. Electronics 8, 1169 (2019).
Mekruksavanich, S. et al. Exercise activity recognition with surface electromyography sensor using machine learning approach. in proceedings of the 2020 joint international conference on digital arts, media and technology with ecti northern section conference on electriclectronics, computer and telecommunications engineering (ECTI DAMT and NCON), Pattaya, Thailand, 11–14 March ; pp. 75–78. (2020).
Wang, J., Chen, Y., Hao, S., Peng, X. & Hu, L. Deep learning for sensor-based activity recognition: A survey. Pattern Recognit. Lett. 119, 3–11 (2019).
Mahmud, T., Sayyed, A. S., Fattah, S. A. & Kung, S. Y. A novel multi-stage training approach for human activity recognition from multimodal wearable sensor data using deep neural network. IEEE Sens. J. 21, 1715–1726 (2020).
Wang, L. et al. Human action recognition by learning spatio-temporal features with deep neural networks. IEEE Access. 6, 17913–17922 (2018).
Nan, Y. et al. Deep learning for activity recognition in older people using a pocket-worn smartphone. Sensors 20, 7195 (2020).
Agarwal, S., Bist, L., Sharma, S. K., Dular, S. K. & Salvi, R. Intelligent IOT based audio signal processing for healthcare applications. Journal Intell. Syst. Internet Things, (1), (2024). pp.83 – 3.
Basly, H., Ouarda, W., Sayadi, F. E., Ouni, B. & Alimi, A. M. DTR-HAR: deep Temporal residual representation for human activity recognition. Visual Comput. 38 (3), 993–1013 (2022).
Kumar, K. P. S. & Bhavani, R. Human activity recognition in egocentric video using PNN, SVM, kNN and SVM + kNN classifiers. Cluster Comput. 22 (S5), 10577–10586 (2019).
Venkatesh, V., Raj, P., Kannan, K. & Balakrishnan, P. Precision centric framework for activity recognition using dempster Shaffer theory and information fusion algorithm in smart environment. J. Intell. Fuzzy Syst. 36 (3), 2117–2124 (2019).
Almalki, N. S. et al. IoT-assisted Human activity recognition using bat optimization algorithm with ensemble voting classifier for disabled persons. Journal of Disability Research, 3(2), p.20240006. (2024).
Alotaibi, F. et al. Optimal deep recurrent neural networks for iot-enabled human activity recognition in elderly and disabled persons. J. Disabil. Res. 2 (2), 79–88 (2023).
Febrianti, E. C., Sudarsono, A. & Santoso, T. B. Human activity recognition for elderly care using light gradient boosting machine (LGBM) algorithm in mobile crowd sensing application. International J. Intell. Eng. & Systems, 17(4). (2024).
Alotaibi, F. et al. Internet of things-driven human activity recognition of elderly and disabled people using arithmetic optimization algorithm with LSTM autoencoder. J. Disabil. Res. 2 (3), 136–146 (2023).
Kumar, A. et al. March. A novel electronic wheel chair design using artificial intelligence assisted smart sensors and controller. In 2024 5th International conference on intelligent communication technologies and virtual mobile networks (ICICV) (pp. 274–281). IEEE. (2024).
Alabdulkreem, E. et al. Computer vision with optimal deep stacked autoencoder-based fall activity recognition for disabled persons in the IoT environment. J. Disabil. Res. 2 (3), 120–128 (2023).
Alzahrani, J. S., Rizwanullah, M. & Osman, A. E. Indoor activity monitoring using chaotic dwarf mongoose optimization with deep learning for elderly and visually impaired people. Journal of Disability Research, 3(7), p.20240085. (2024).
Ciortuz, G. et al. Machine learning models for wearable-based human activity recognition: A comparative study. Neurocomputing, p.130911. (2025).
Dahiya, R. et al. Deep learning-based multi-brain capsule network for next-gen clinical emotion recognition using EEG signals. Neuroscience Informatics, p.100203. (2025).
Kumar, R. N., Surendran, R. & Madhusundar, N. November. An intelligent human pose detection comparing with random forest and recurrent neural network. In 2024 8th International Conference on Electronics, Communication and Aerospace Technology (ICECA) (pp. 915–921). IEEE. (2024).
Kim, T. H. et al. Automated explainable and interpretable framework for anomaly detection and human activity recognition in smart homes. Neural Comput. Appl. 37 (16), 9295–9308 (2025).
Thanarajan, T., Alotaibi, Y., Rajendran, S. & Nagappan, K. Improved Wolf swarm optimization with deep-learning-based movement analysis and self-regulated human activity recognition. AIMS Math. 8 (5), 12520–12539 (2023).
Choudhury, N. A. & Soni, B. KNEE-HAR: A ConvLSTM-based lightweight hybrid deep learning model for human activity recognition with knee abnormalities using Raw physiological sensor data. IEEE Sens. Journal (2025).
Rizk, H. & Hashima, S. June. RISense: 6G-Enhanced human activity recognition system with RIS and deep LDA. In 2024 25th IEEE international conference on mobile data management (MDM) (pp. 119–128). IEEE. (2024).
Luo, F. et al. ActivityMamba: a CNN-Mamba hybrid neural network for efficient human activity recognition. IEEE Transactions on Mobile Computing. (2025).
Prabagaran, S., Bandla, A. K., Venkatesh, R. J. & Malar, M. J. August. Poplar optimization algorithm-driven hybrid Siamese top-down neural networks for accurate human activity recognition in IoT networks. In 2024 Second International conference on intelligent cyber physical systems and internet of things (ICoICI) (pp. 392–398). IEEE. (2024).
Zohrevand, A., Mirzaei, S. & Sajedi, H. February. Optimized multi-label human activity recognition with focal loss and attention-enhanced LSTM networks. In 2025 29th International Computer Conference, Computer Society of Iran (CSICC) (pp. 1–5). IEEE. (2025).
Dastbaravardeh, E., Askarpour, S., Saberi Anari, M. & Rezaee, K. Channel attention-based approach with autoencoder network for human action recognition in low‐resolution frames. International Journal of Intelligent Systems, 2024(1), p.1052344. (2024).
Aidarova, S., Nurmakhan, T., Myrzakhan, R., Fazli, S. & Yazici, A. Advancing activity recognition with multimodal fusion and transformer techniques. IEEE Sens. Journal (2025).
Rezaee, K. An advanced deep learning structure for accurate student activity recognition and health monitoring using smartphone accelerometer data. Health Manage. Inform. Sci. 11 (2), 85–97 (2024).
Amrani, H., Micucci, D., Mobilio, M. & Napoletano, P. Leveraging dataset integration and continual learning for human activity recognition. International J. Mach. Learn. Cybernetics, pp.1–22. (2025).
Gupta, C. & Khang, A. Designing artificial intelligence-enabled training approaches and models for physical disabilities individuals. In AI-oriented Competency Framework for Talent Management in the Digital Economy (388–415). CRC. (2024).
Barua, M., Kumar, T., Raj, K. & Roy, A. M. Comparative analysis of deep learning models for stock price prediction in the indian market. (2024).
Lin, M. Intelligent recognition of musical score difficulty based on improved deep belief networks. Journal of Network Intelligence Taiwan Ubiquitous Information(2024).
Lu, H., Zhan, H. & Wang, T. A multi-strategy improved snake optimizer and its application to SVM parameter selection. Math. Biosci. Eng. 21 (10), 7297–7336 (2024).
https://archive.ics.uci.edu/dataset/507/wisdm+smartphone+and+smartwatch+activity+and+biometrics+dataset
Kwapisz, J. R., Weiss, G. M. & Moore, S. A. Activity recognition using cell phone accelerometers. ACM SigKDD Explor. Newsl. 12, 74–82 (2011).
Nafea, O., Abdul, W., Muhammad, G. & Alsulaiman, M. Sensor-based human activity recognition with spatio-temporal deep learning. Sensors, 21(6), p.2141. (2021).
Kim, C. & Lee, W. Human activity recognition by the image type encoding method of 3-axial sensor data. Applied Sciences, 13(8), p.4961. (2023).
Acknowledgements
The authors extend their appreciation to the King Salman center For Disability Research for funding this work through Research Group no KSRG-2024- 094.
Funding
The authors extend their appreciation to the King Salman center for disability research for funding this work through research group no KSRG-2024- 094.
Author information
Authors and Affiliations
Contributions
Manal Abdullah Alohali: Conceptualization, methodology, validation, investigation, writing—original draft preparation, fundingMohammed Yahya Alzahrani: Conceptualization, methodology, writing—original draft preparation, writing—review and editingAsmaa Mansour Alghamdi: methodology, validation, writing—original draft preparationIshfaq Yaseen: software, validation, data curation, writing—review and editing.
Corresponding author
Ethics declarations
Competing interests
The authors declare no competing interests.
Additional information
Publisher’s note
Springer Nature remains neutral with regard to jurisdictional claims in published maps and institutional affiliations.
Rights and permissions
Open Access This article is licensed under a Creative Commons Attribution-NonCommercial-NoDerivatives 4.0 International License, which permits any non-commercial use, sharing, distribution and reproduction in any medium or format, as long as you give appropriate credit to the original author(s) and the source, provide a link to the Creative Commons licence, and indicate if you modified the licensed material. You do not have permission under this licence to share adapted material derived from this article or parts of it. The images or other third party material in this article are included in the article’s Creative Commons licence, unless indicated otherwise in a credit line to the material. If material is not included in the article’s Creative Commons licence and your intended use is not permitted by statutory regulation or exceeds the permitted use, you will need to obtain permission directly from the copyright holder. To view a copy of this licence, visit http://creativecommons.org/licenses/by-nc-nd/4.0/.
About this article

Cite this article
Alohali, M.A., Alzahrani, M.Y., Alghamdi, A.M. et al. Advanced smart human activity recognition system for disabled people using artificial intelligence with snake optimizer techniques. Sci Rep 15, 31372 (2025). https://doi.org/10.1038/s41598-025-16180-5
Received:
Accepted:
Published:
Version of record:
DOI: https://doi.org/10.1038/s41598-025-16180-5
Keywords
This article is cited by
-
Enhance real-time activity recognition of disabled individuals using hybridisation of convolutional neural network with attention mechanism
Signal, Image and Video Processing (2025)
