
Abstract
Royal jelly, owing to its rich biochemical composition, is widely used in apitherapy and human nutrition. To enhance its production, honeybee colonies are often supplemented with industrial carbohydrate sources. This study aimed to investigate how different locations (Doğanşehir and Uluköy) and carbohydrate types influence the biochemical composition of royal jelly, including sugar content, enzymatic activity, and phenolic compounds. The results revealed that both location and carbohydrate source significantly affected the biochemical profile of the samples. The Doğanşehir–glucose-fed group exhibited the highest 10-hydroxy-trans-2-decenoic acid (10-HAD) content (2.77%, w/w; p < 0.001), whereas the Doğanşehir–control group had the lowest (1.41%, w/w; p < 0.001). Environmental conditions in Doğanşehir appeared to promote 10-HDA production, and glucose feeding proved to be an effective strategy for optimizing it. Although glucose, fructose, and sucrose levels were similar between locations, maltose content differed significantly. The highest glucose ratios were detected in the Doğanşehir bee-feed group (3.82%) and the Uluköy bee-feed group (3.57%). Invertase activity (4.51 ± 1.34 U/mL) and catalase activity (21.78 ± 0.80 U/mL) were highest in glucose-fed bees, whereas these parameters were lowest in the sucrose-fed group (0.72 ± 0.16 and 11.25 ± 2.66 U/mL, respectively; p < 0.01). Glucose feeding markedly increased the levels of invertase, catalase, total protein, amino acids, proline, and 10-HDA in royal jelly (p < 0.01). In conclusion, both environmental factors and carbohydrate-based feeding exert significant effects on the biochemical composition of royal jelly.
Introduction
Honeybees produce various secretions and offer a wide range of products derived from the substances they collect to sustain colony organization and development. Among these products, royal jelly stands out for its ability to induce remarkable anatomical and physiological changes, particularly in genetically identical female individuals1,2. Owing to its high commercial value and limited production, royal jelly has created new and profitable opportunities within the beekeeping industry. Despite Türkiye’s strong position in global apiculture, its annual royal jelly output remains limited to only a few hundred kilograms. The increasing use of royal jelly not only as a food supplement but also as an adjunct in the treatment of certain diseases has expanded market demand and made its production economically attractive. Consequently, royal jelly continues to attract growing scientific and economic interest3.
Royal jelly, secreted by the hypopharyngeal and mandibular glands of worker bees, is a vital biological substance for both bee colonies and humans4. It is a white, creamy, slightly acidic (pH ≈ 5), and mildly bitter secretion with high nutritional value5. All individuals in a bee colony (queen, workers, and drones) are fed royal jelly during their larval stage; however, the composition of royal jelly provided to queen larvae is the most nutritionally superior. Continuous feeding of the queen with royal jelly throughout her life enables her to lay her own body weight in eggs daily. In this context, royal jelly provides significant biological advantages not only for the queen but also potential health benefits for humans.
The growing interest in royal jelly is closely associated with its high energy value, biological activity, and broad pharmacological potential. Indeed, royal jelly has been used as a natural supplement to enhance physical performance, improve cognitive function, support sexual health, and aid in the management of various chronic conditions such as anemia, hypercholesterolemia, viral infections, cancer, hypertension, and arteriosclerosis6.
The biochemical composition of royal jelly varies according to environmental factors such as climate, geographic region, floral source, bee subspecies, and harvesting conditions. Due to its complex chemical nature, royal jelly exhibits diverse pharmacological properties including antioxidant, neurotrophic, hypoglycemic, hypocholesterolemic, hepatoprotective, hypotensive, antibiotic, anti-inflammatory, immunomodulatory, anti-aging, and antitumor effects. The chemical composition of royal jelly plays a crucial role in determining its biological functions. Proteins constitute 17–45% of its dry weight, of which 97–98% are nitrogenous compounds; 2.3% are free amino acids and 0.16% are peptides. More than 80% of the total protein fraction consists of major royal jelly proteins (MRJPs), which comprise nine distinct members7. These proteins perform their biological roles primarily through glycosylation and phosphorylation processes, and their concentration is a key determinant of royal jelly’s nutritional quality and bioactivity.
Several enzymes such as glucose oxidase, invertase, and acid and alkaline phosphatases have been identified in royal jelly. These temperature-sensitive enzymes are essential components that influence the nutritional and biological quality of royal jelly8.
The present study aimed to investigate the effects of different feeding regimes on the chemical composition of royal jelly obtained from colonies supplied with industrial sugars - including sucrose syrup, pasteurized bee feed, and glucose syrup - whose health implications remain under discussion.
Materials and methods
Materials
Location selection
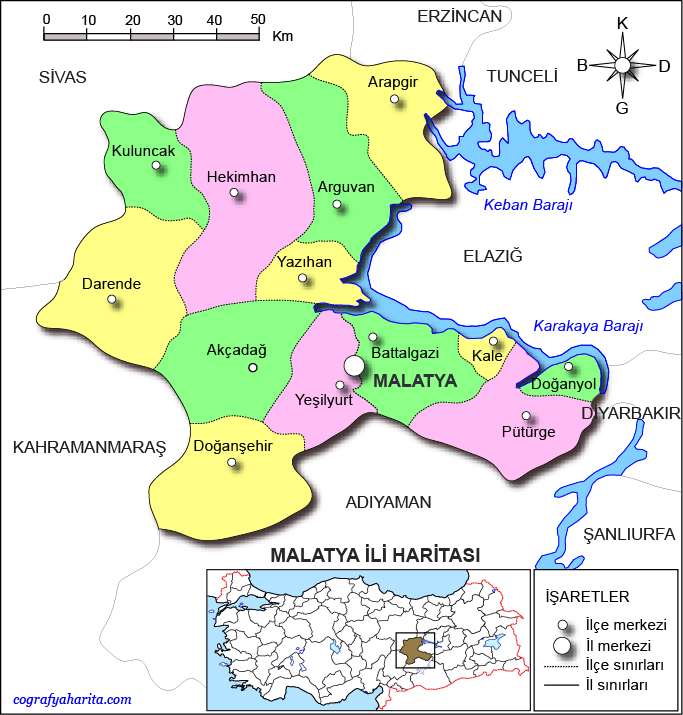
Two geographically distinct locations with differing floral compositions were selected to evaluate their effects on royal jelly yield (Fig. 1)9. The study sites were the Uluköy region (38°13′27.84″ N, 38°27′34.92″ E) in the Battalgazi district of Malatya Province10 and the Buğday Deresi region (38°05′44.88″ N, 37°52′45.12″ E) in the Doğanşehir district of the same province11. The Uluköy site is located approximately 26 km from the Malatya city center, whereas Buğday Deresi lies about 74 km away and 15 km from Doğanşehir town. Variations in plant diversity arising from geographical differences are known to influence the biochemical composition of royal jelly. The phytogeographical origin of royal jelly can be identified through microscopic pollen analysis12. Previous floristic studies have reported that members of the families Asteraceae, Fabaceae, Brassicaceae, Lamiaceae, and Poaceae are the most abundant taxa in both Uluköy and Doğanşehir, though in varying proportions13,14,15. This experimental design is therefore essential for evaluating the combined effects of location and dietary carbohydrate sources on royal jelly production.

Locations in Malatya Province where the experimental colonies were established9.
Colony preparation and royal jelly harvesting
The experiment was conducted at two different locations, with a control and three distinct feeding treatments established at each site. Accordingly, a 2 (location) × 4 (feeding) factorial experimental design was implemented. A total of 40 starter colonies 20 per location were used for royal jelly production (Table 1). In addition, 20 support colonies were maintained to provide capped brood frames to the experimental colonies once per week. During spring, colony maintenance was carried out at the apiary located on the İnönü University campus. The purchased colonies were subsequently divided into the designated experimental groups. To standardize royal jelly production across treatments, all colonies were rendered queenless during the grafting and royal jelly production period. The queen of each starter colony was removed prior to grafting, ensuring that. The experimental work was carried out in two separate apiaries, and control and three feeding treatment groups were established for the colonies in each location. All hives remained fully open throughout the study, ensuring that the bees had unrestricted access to natural nectar and pollen sources during normal foraging flights. The control colonies in both apiaries received no supplemental feeding and relied exclusively on freely foraged nectar and pollen. Spring feeding was performed using the specific carbohydrate sources assigned to each group.
Throughout the royal jelly production period, colonies were fed ad libitum by replenishing feeders as the food sources were depleted. Because glucose syrup is highly viscous, it was diluted with water (1:1, v/v) before being supplied to the colonies (Table 1). Colonies were transferred to the designated field sites on June 14–15, and royal jelly production was conducted between June 18 and July 3. Royal jelly was harvested seven times during the production period, with each collection performed at 48-hour intervals.
In queenless colonies used for royal jelly production, two sealed brood frames from support colonies were added periodically to maintain an adequate population of 5-15-day-old nurse bees17. The harvested royal jelly samples were stored in a deep freezer at − 18 °C until analysis. All collected samples were pooled within their respective groups and homogenized before laboratory analyses.
Carbohydrate sources commonly used in beekeeping
A control group was established to evaluate the effects of different industrial sugars - crystallized granulated sugar, pasteurized bee feed syrup, and glucose syrup -on royal jelly yield. To ensure high acceptance by the colonies, these carbohydrate-based feed sources were provided following standard beekeeping practices18. In this study, the sugar types most commonly used by beekeepers for colony feeding were selected. The chemical compositions of these feed materials are presented in Table 1.
(j = 1: Control, 2: Glucose, 3: Sucrose, 4: Bee Feed).
Solvents and chemicals
Sugar standards - D-(+)-glucose (Sigma G8270), D-(-)-fructose (Sigma F0127), and sucrose (Sigma S9378) - as well as potassium hexacyanoferrate(II) trihydrate (K4[Fe(CN)6]·3H2O; Carrez I solution), zinc acetate dihydrate (Zn(CH3COO)2·2H2O; Carrez II solution), formic acid, ninhydrin, ethylene glycol monomethyl ether, proline, propanol, ethanol, methanol, L-leucine, bovine serum albumin (BSA), 2,2-diphenyl-1-picrylhydrazyl (DPPH), acetic acid, sodium acetate trihydrate, and trans-10-hydroxy-2-decenoic acid were purchased from Sigma-Aldrich (St. Louis, MO, USA). o-Phthalaldehyde (OPA), 9-fluorenylmethyl chloroformate (FMOC), tetrahydrofuran (THF), borate buffer (0.4 N, pH 10.2), and triethylamine (TEA) were obtained from Fluka (Buchs, Switzerland). Ultrapure water was used for all dilutions and for the preparation of the mobile phase. All water-soluble reagents were prepared using double-deionized water produced by a Millipore Milli-Q system (Millipore, USA).
Methods
Determination of 10-HDA by HPLC
The content of 10-HDA in royal jelly samples was determined using high-performance liquid chromatography with diode-array detection (HPLC–DAD). Analytically pure 10-HDA standards were prepared by diluting a 1.0 mg/L stock solution. Specifically, 0.010 g of 10-HDA was dissolved in a methanol–deionized water mixture (1:2, v/v) to a final volume of 10 mL. Calibration solutions at concentrations of 0.5, 1, 2.5, 5, 10, 20, and 30 mg/L were prepared from this stock solution.
Approximately 1 g of royal jelly was dissolved in 20 mL of methanol–water (50:50, v/v) and sonicated for 15 min in an ultrasonic bath. The mixture was then centrifuged at 10,000 rpm for 5 min, and the resulting supernatant was filtered through a polytetrafluoroethylene (PTFE) membrane filter (0.20 μm). A 5.0 mL aliquot of the filtrate was injected into an ACE C18 column (250 mm × 4.6 mm, 5 μm). The analysis was performed under isocratic conditions at a flow rate of 1.0 mL/min. The mobile phase consisted of 0.1 M potassium dihydrogen phosphate (KH2PO4) and methanol (55:45, v/v) adjusted to pH 4.1. The total run time was approximately 30 min, and the detection wavelength was set at 215 nm.
The 10-HDA content (%) was calculated as the ratio of the detected 10-HDA amount to the initial weight of the royal jelly sample.
Determination of sugar
Approximately 1.00 g of royal jelly was accurately weighed into a 50 mL volumetric flask and dissolved in ultrapure water. To this solution, 1 mL of Carrez I solution and 1 mL of Carrez II solution were sequentially added to precipitate proteins and polysaccharides. The mixture was vigorously shaken for 1 min, made up to volume with ultrapure water, and centrifuged at 4500 × g for 10 min at 20 °C. The clear supernatant was filtered through a 0.45 μm PTFE syringe filter, transferred into an HPLC vial, and injected into the chromatographic system.
Sugar analysis (fructose, glucose, sucrose, and maltose) was carried out using a Waters HPLC system equipped with a Waters 600 quaternary pump, Waters 717 Plus autosampler, Waters 2414 refractive index detector, and a Waters TCM2 column oven. Chromatographic separation was achieved on a Waters Carbohydrate Analysis column (3.9 × 300 mm, 4 μm particle size; WAT084038). Both the column and detector temperatures were maintained at 35 °C. The mobile phase consisted of acetonitrile (HPLC grade; Merck 1.00029.2500) and ultrapure water (75:25, v/v). The system operated under isocratic conditions at a flow rate of 1.4 mL/min. The injection volume was 20 µL, and the total run time was 25 min. Detection was performed using the refractive index detector (RID) set at 35 °C. Working calibration standards were prepared by serial dilution of stock solutions with ultrapure water to yield five concentration levels: 10.0, 8.0, 6.0, 4.0, and 2.0 mg/mL (corresponding to 1.0%, 0.8%, 0.6%, 0.4%, and 0.2% w/v) for each sugar. All standard solutions were filtered through 0.45 μm PTFE syringe filters and stored at 4 °C until analysis. Quantification was performed using external standard calibration curves prepared at five concentration levels in the range of 0.5–20 mg/mL for each sugar.
Analysis of metabolite and enzyme activities
Determination of invertase activity
Invertase activity in royal jelly samples was determined spectrophotometrically according to the method described by Bogdanov18. In this assay, p-nitrophenyl-α-D-glucopyranoside (pNPG) was used as the substrate. The results were expressed as the invertase number (IN), representing the amount of sucrose hydrolyzed by the enzyme in 100 g of royal jelly within 1 h.
Determination of catalase activity
Catalase activity was determined using the Megazyme Catalase Assay Kit (Megazyme International, Ireland) following the manufacturer’s protocol. One unit (1 U) of catalase activity was defined as the amount of enzyme required to decompose 1 µmol of hydrogen peroxide (H2O2) per minute under the assay conditions.
Proline analysis
Proline content was determined spectrophotometrically according to the method described by Bogdanov18 and Ough19.
Total amino acid analysis
The concentration of free amino acids was determined using the Cd–ninhydrin method described by Doi et al.20. Quantification was performed using a calibration curve prepared with L-leucine in the range of 1.2–42 mg/L, and the results were expressed as milligrams of L-leucine equivalents per 100 g of royal jelly.
Total protein analysis
Protein content in royal jelly samples was determined using the Bradford method21,22. Bovine serum albumin (BSA) standards in the range of 10–100 µg/0.1 mL were used for calibration. The results were expressed as the percentage of protein content.
Analysis of phenolic compounds
Phenolic compounds were extracted from royal jelly samples following the method described by Kamiloglu et al.23 with minor modifications. Briefly, ultrapure water was added to royal jelly at a concentration of 100 mg/mL, and the mixture was sonicated in an ultrasonic bath until completely homogenized. The resulting solution was centrifuged at 15,000 × g for 10 min at 4 °C, and the supernatant was transferred into glass vials for analysis23.
Phenolic compound analysis was performed using a Waters Alliance e2695 HPLC system equipped with a photodiode array detector (Waters Corporation, Milford, USA). Chromatographic separation was achieved on a Grace Smart RP C18 column (250 × 4.6 mm, 5 μm). The mobile phases consisted of (A) 0.1% trifluoroacetic acid (TFA) in Milli-Q water and (B) 0.1% TFA in acetonitrile. A linear gradient elution was applied as follows: 0 min, 5% B; 0–45 min, 35% B; 45–47 min, 75% B; 47–54 min, 5% B. The flow rate was maintained at 1.0 mL/min, the injection volume was 10 µL, and detection was carried out using the diode array detector.
Identification and quantification of phenolic compounds were performed using external calibration curves prepared in the range of 1–100 µg/g for each standard. The phenolic standards included gallic acid, homogentisic acid, protocatechuic acid, catechin, 4-hydroxybenzoic acid, gentisic acid, chlorogenic acid, vanillic acid, caffeic acid, epicatechin, p-coumaric acid, taxifolin, ferulic acid, 3,4-dimethoxybenzaldehyde, m-coumaric acid, 2-hydroxycinnamic acid, resveratrol, 3,4-dimethoxycinnamic acid, cinnamic acid, naringenin, hesperetin, genistein, kaempferol, apigenin, pinocembrin, chrysin, myricetin, syringic acid, rutin hydrate, and caffeic acid phenethyl ester. Results were expressed as milligrams per 100 g of royal jelly.
Statistical analyses
Descriptive statistics of all measured parameters were first calculated. To evaluate the effects of location (1: Doğanşehir; 2: Uluköy) and feeding treatment (1: control; 2: glucose; 3: sucrose; 4: bee feed) on the biochemical characteristics of royal jelly—namely 10-hydroxy-trans-2-decenoic acid (10-HDA), invertase (IN), catalase (U/mL), total protein (%), proline (mg/kg), and total amino acids (mg/100 g)—a two-way factorial experimental design (2 × 4) was employed. The main effects and interactions between these factors were analyzed using the General Linear Model (GLM) procedure according to the following mathematical model:
where:
-
Yij = observed value of the dependent variable,
-
µ = overall population mean,
-
ai = effect of location (i = 1: Doğanşehir, 2: Uluköy),
-
bj = effect of feeding regime (j = 1: control, 2: glucose, 3: sucrose, 4: bee feed),
-
(ab)ij = interaction effect between location and feeding regime,
-
eijk = random error term, assumed to be normally distributed (0, 2).
In this study, data from the study groups for all parameters examined were evaluated to determine whether they met the assumptions of normal distribution and parametric tests. This assessment was based on the Kolmogorov-Smirnov test and other criteria for normality, including histogram, stem-and-leaf diagram, Q-Q (quantile-quantile) plot, P-P (probability-probability) plot, kurtosis, and skewness. Descriptive statistics were calculated for all parameters on a group basis. Following these evaluations, it was determined that for the parameters examined, at least one group did not meet the normal distribution assumption, and thus the assumptions for parametric tests were not satisfied. Therefore, the Kruskal-Wallis analysis of variance was used for comparisons between groups. For parameters that yielded a significant result in this analysis, the Dunn-Bonferroni post-hoc test was employed for multiple comparisons24]– [25. All statistical analyses were conducted using SPSS software (version 11.5, USA)26.
Results and discussion
10-HDA analysis
The 10-HDA content of royal jelly is a critical indicator of its quality. Descriptive statistics showing the effects of location and feeding treatments on 10-HDA levels are presented in Tables 2 and 3. The average 10-HDA concentration was significantly higher in Doğanşehir (2.38 ± 0.64%) than in Uluköy (2.07 ± 0.40%) (p < 0.05).
Yavuz and Gürel27 analyzed 13 royal jelly samples collected from commercial products in Türkiye and colonies maintained at Akdeniz University. They reported that 10-HDA content ranged from 0.57% to 3.11%, with approximately 50% of the samples falling below the legal limit of 1.4%. Similarly, Kolaylı et al.28 found that 18 royal jelly samples collected from various regions of Anatolia contained an average of 2.7 ± 1.0% 10-HDA as determined by HPLC analysis. Although their samples were collected under different regional and climatic conditions, the results were comparable to those obtained in our study.
Keskin et al.29 investigated royal jelly samples collected over multiple years and reported that 10-HDA concentrations varied between 2.1% and 2.6% depending on the year30. In another study, the 10-HDA level was 2.40% in the control colonies, 2.51% in those fed with sugar syrup, and 4.05% in colonies fed with a pollen substitute, with the effect of feeding found to be statistically significant. Beykaya et al.31 also demonstrated that the environmental conditions in Doğanşehir (e.g., vegetation, climate, and soil characteristics) positively influence bee productivity.
In the present study, the lowest 10-HDA concentration was observed in the control group, while supplementation with glucose, sucrose, and bee feed significantly increased 10-HDA levels. The 10-HDA level was lowest in the control group, and the difference relative to the feeding groups was statistically significant (p < 0.001). The highest concentration was recorded in the glucose-fed group (p < 0.001). These findings indicate that supplementary carbohydrate feeding enhances 10-HDA synthesis in bees.
In conclusion, both location and feeding regime independently affected the 10-HDA content of royal jelly; however, their interaction was not statistically significant. Environmental conditions in Doğanşehir appear to promote 10-HDA production, and glucose feeding is an effective strategy to optimize this process.
In the present study, the 10-HDA content of royal jelly samples obtained from different locations was analyzed in detail. The highest 10-HDA concentration was observed in the Doğanşehir–glucose group (2.77%, w/w), whereas the lowest value was recorded in the Doğanşehir–control group (1.41%, w/w) (p < 0.05). However, statistically significant differences were found for 10-HDA levels among the feeding groups in Uluköy (p < 0.05). Overall, the 10-HDA content was higher in all feeding groups (except control group) from Doğanşehir compared with those from Uluköy (Table 3), indicating that the environmental conditions in Doğanşehir may be more favorable for 10-HDA biosynthesis.
Sabatini et al.32 reported that 10-HDA content in natural royal jelly samples is typically above 1.4%. However, Bloodworth et al.33 found that in some high-quality royal jelly samples, 10-HDA concentrations can exceed 2.0%. Similarly, Garcia-Amoedo34 compared several royal jelly samples and reported that their 10-HDA levels ranged between 1.8% and 3.0%.
In both locations, the control groups exhibited the lowest 10-HDA concentrations. Although increases were observed in the sucrose- and bee feed-fed groups, the highest 10-HDA values were consistently recorded in the glucose-fed colonies. Nevertheless, the magnitude of the increase in the sucrose- and bee feed-fed groups was smaller compared to that in the glucose-fed groups.
In conclusion, glucose supplementation proved to be the most effective feeding strategy for enhancing 10-HDA production in Doğanşehir, and glucose was identified as the carbohydrate source that most efficiently promoted 10-HDA biosynthesis.
Sugar analysis
A chromatographic method was employed to determine the saccharide composition (glucose, fructose, sucrose, and maltose) of royal jelly samples collected from two locations and four feeding groups, and the results are summarized in Table 4. Glucose, fructose, and sucrose were detected in all feeding groups at both sites, whereas maltose was detected only in the glucose-fed colonies. The highest glucose concentrations were observed in the Doğanşehir–bee feed group (3.82%) and the Uluköy–bee feed group (3.57%), while the lowest values were found in the glucose-fed colonies at both locations.
Fructose levels were highest in the sucrose-fed groups of Doğanşehir (5.44%) and Uluköy (6.07%), and lowest in the glucose-fed groups. Across all feeding treatments, sucrose concentrations were relatively lower than those of glucose and fructose. The highest sucrose content was found in the Doğanşehir–sucrose group (0.74%) and Uluköy–bee feed group (1.22%), while the lowest values occurred in the glucose-fed groups. Maltose was detected only in glucose-fed colonies, reaching 2.26% in Doğanşehir and 2.99% in Uluköy.
Previous studies have reported that the sugar composition of royal jelly varies depending on both the dietary carbohydrate sources and the environmental conditions of the colonies35,36,37. Bee nutrition directly influences the carbohydrate profile of royal jelly. In naturally fed colonies, sugar content depends on the type of nectar collected and seasonal factors37,38. Nectar rich in sucrose may promote royal jelly production39. Conversely, colonies fed with sugar syrups containing high levels of glucose and fructose tend to produce royal jelly with elevated glucose and fructose concentrations but lower sucrose content40,41. Feeding with pollen substitutes or formulated bee feed provides a more balanced carbohydrate intake, which can result in relatively higher sucrose levels42,43. In these samples, fructose and glucose ratios may generally be higher44,45.
ND : Not detected during sugar analyses, *: Statistical analysis was not performed.
In this study, the overall glucose, fructose, and sucrose concentrations were comparable between Doğanşehir and Uluköy, but maltose content differed significantly, suggesting that location had a greater influence on maltose production than on other sugars. Sugar levels were lowest in the control groups where no supplemental feeding was provided. Glucose and maltose levels increased notably in the glucose-fed groups, while sucrose concentrations were highest in the sucrose- and bee feed-fed groups, particularly in Uluköy.
In conclusion, both location and feeding regime affected the sugar composition of royal jelly, but feeding had a more pronounced effect - especially in increasing glucose and fructose levels. However, the differences were not significant (p > 0.05).
Analysis of metabolites and enzyme activities
The analysis of metabolites and enzyme activities in royal jelly provides essential insights into its biochemical composition and potential health-promoting properties46,47. These analyses are also crucial for assessing the quality of royal jelly production and understanding underlying metabolic mechanisms. Royal jelly is particularly rich in proteins, and amino acid analysis helps determine its protein quality and biological value. Among the key biochemical parameters evaluated in royal jelly are invertase (IN), catalase (U/mL), total protein (%), proline (mg/kg), and total amino acids (mg/100 g), all of which contribute to its biological activity and nutritional value48.
Invertase plays a central role in energy production and sugar metabolism in bees49, while catalase regulates oxidative processes and protects tissues against oxidative stress50. The total amino acid content of royal jelly reflects its protein quality and functional properties51,52. Descriptive statistics for metabolite and enzyme activity analyses by location and feeding treatment are presented in Tables 5 and 6. The data indicate that environmental conditions in Doğanşehir may enhance invertase and proline concentrations.
According to the results, total amino acid content averaged 1012.0 ± 11.3 mg/100 g in Uluköy and 925.5 ± 18.0 mg/100 g in Doğanşehir. Among feeding treatments, the highest total amino acid level was recorded in the control group (981.4 ± 14.6 mg/100 g) and the lowest in the sucrose-fed group (831.4 ± 3.9 mg/100 g). Within locations, Uluköy–control samples had the highest total amino acid concentration (1012.0 ± 11.3 mg/100 g), whereas Uluköy–bee feed samples had the lowest (741.4 ± 4.9 mg/100 g). Differences among feeding groups were statistically significant (p < 0.01) (Table 6). These results suggest that environmental factors in Uluköy may enhance catalase and total amino acid production.
Proline levels were significantly higher in Doğanşehir (4364.96 ± 141.93 mg/kg; p < 0.01), indicating that this location provides favorable conditions for proline biosynthesis. Invertase activity (4.51 ± 1.34 U/mL) and catalase activity (21.78 ± 0.80 U/mL) were highest in glucose-fed bees, while the lowest values were recorded in the sucrose-fed group (0.72 ± 0.16 and 11.25 ± 2.66 U/mL, respectively; p < 0.01). These findings support the stimulating effect of glucose on invertase and catalase synthesis.
Proline levels were elevated in glucose- and sucrose-fed colonies but lower in the control and bee feed groups. The increased proline concentrations in glucose- and sucrose-fed bees may be attributed to the rapid energy supply provided by these sugars, which supports metabolic processes and enhances proline synthesis53,54. Glucose feeding resulted in lower total amino acid levels, whereas sucrose feeding led to higher concentrations (p < 0.01). Overall, glucose supplementation increased invertase and catalase activities, while sucrose feeding reduced them.
Both location and feeding regime exerted significant independent effects on royal jelly’s biochemical profile. Bees from Doğanşehir exhibited higher invertase activity than those from Uluköy, indicating that environmental factors influence digestive enzyme levels. In contrast, catalase activity was higher in Uluköy, suggesting enhanced oxidative stress protection in that region. Protein concentrations were also higher in Uluköy samples, which may be related to environmental and genetic factors affecting protein metabolism55.
Proline content averaged 3941.00 ± 35.64 mg/kg in Uluköy and 4364.96 ± 141.93 mg/kg in Doğanşehir. Among feeding groups, the highest proline concentration was detected in the glucose-fed group (4552.26 ± 109.38 mg/kg) and the lowest in the bee feed group (3898.84 ± 133.54 mg/kg). The highest mean proline content (4775.23 ± 83.11 mg/kg) was observed in royal jelly from Doğanşehir colonies fed with glucose syrup, possibly reflecting a response to local environmental stress. Previous studies reported comparable proline levels, with 2.30% in royal jelly by Jie et al.56 and 1930 mg/kg by Saito et al.57.
Higher total amino acid levels were detected in Uluköy colonies, possibly due to the availability of diverse natural pollen and nectar sources, which enhance amino acid bioavailability58. Increased invertase activity was observed in glucose-fed bees at both sites, while higher catalase activity was found in colonies fed with glucose and bee feed, indicating a protective role of glucose against oxidative stress. Furthermore, protein levels were elevated in glucose-fed bees, and proline levels were highest in Doğanşehir colonies, suggesting that glucose may enhance stress tolerance. Elevated amino acid levels in the Uluköy control group indicate that diverse floral resources and natural feeding conditions can promote amino acid synthesis and accumulation59.
Glucose feeding increased invertase and catalase activities, providing rapid energy and enhanced antioxidant protection in the hypopharyngeal glands, which likely supports elevated protein and amino acid synthesis, including 10-HDA, in royal jelly. These shifts demonstrate a direct link between nutritional input, bee physiology, and RJ biosynthetic capacity.
In summary, both environmental conditions and feeding regimes significantly influenced the biochemical composition of royal jelly. Glucose feeding stimulated invertase, catalase, and proline production, while natural feeding conditions in Uluköy enhanced total amino acid levels. These findings highlight the combined importance of environmental and nutritional factors in shaping the metabolic profile and nutritional quality of royal jelly.
Phenolic compound analysis
Phenolic compounds are organic molecules known for their potent antioxidant properties and are key indicators of royal jelly quality60. These compounds contribute to the antioxidant capacity of royal jelly by neutralizing free radicals and reducing oxidative damage61. The composition and concentration of phenolic compounds in royal jelly can vary depending on bee diet, environmental conditions, and analytical techniques62.
In this study, HPLC chromatograms of royal jelly samples (Fig. 2) and the effects of different locations and feeding regimes on individual phenolic compounds—including 2,3,4-trihydroxybenzoic acid, gallic acid, 4-hydroxybenzoic acid, ellagic acid, trans-cinnamic acid, caffeic acid, and p-coumaric acid—are presented in Table 7. Significant differences were observed between the Doğanşehir and Uluköy samples. For instance, 2,3,4-trihydroxybenzoic acid and gallic acid levels were higher in Doğanşehir, whereas 4-hydroxybenzoic acid was more abundant in Uluköy. These findings indicate that location is an important determinant of the amount and distribution of phenolic compounds in royal jelly.
Phenolic compounds enhance the antioxidant potential and overall quality of royal jelly37. Colonies fed on natural pollen and nectar generally produce royal jelly with higher phenolic content63. In the present study, feeding type (glucose, sucrose, or bee feed) significantly influenced phenolic composition. Glucose supplementation particularly increased 4-hydroxybenzoic acid and p-coumaric acid concentrations, while bee feed elevated ellagic acid content. The highest 4-hydroxybenzoic acid levels were observed in glucose-fed colonies in both Doğanşehir and Uluköy.
A significant interaction was also found between location and feeding type. For example, trans-cinnamic acid concentration was highest in the control group from Doğanşehir, but lower in bee feed-fed colonies from Uluköy. In general, phenolic compound levels tended to decrease in colonies fed with sugar syrups, whereas higher concentrations were detected in control colonies that relied solely on natural food sources64.
In conclusion, both location and feeding regime significantly affected the phenolic compound profile of royal jelly. These variations directly influence the antioxidant capacity and overall biological quality of royal jelly.

Chromatogram from HPLC analysis of royal jelly samples.
Conclusion
In this study, the 10-HDA content of royal jelly ranged from 1.40% to 2.77%, with the highest levels observed in the glucose-fed colonies from Doğanşehir. Glucose feeding proved to be the most effective strategy for optimizing 10-HDA production, significantly enhancing its concentration compared with other carbohydrate sources.
The sugar composition of royal jelly primarily consisted of glucose, fructose, sucrose, and varying levels of maltose depending on location and feeding regime. While glucose, fructose, and sucrose concentrations were similar between Doğanşehir and Uluköy, maltose content differed significantly, indicating a stronger influence of location on maltose formation. Both location and feeding regime affected sugar composition; however, feeding had a more pronounced effect, particularly in increasing glucose and fructose ratios.
Metabolite and enzyme analyses provided deeper insight into the biochemical properties of royal jelly. Glucose-fed bees exhibited lower amino acid levels but higher concentrations of invertase, catalase, total protein, proline, and 10-HDA (p < 0.01). Sucrose feeding, on the other hand, resulted in increased amino acid concentrations. These findings demonstrate that carbohydrate sources can modulate enzymatic activity and nutrient composition in royal jelly.
Environmental factors and the diversity of pollen and nectar also played key roles in shaping the biochemical composition of royal jelly. Location and feeding regime exerted significant independent effects on the metabolic parameters of bees and were critical in determining the phenolic compound profile. The predominant phenolic compounds identified were 2,3,4-trihydroxybenzoic acid, 4-hydroxybenzoic acid, p-coumaric acid, and gallic acid. Glucose feeding particularly enhanced the levels of 4-hydroxybenzoic acid and p-coumaric acid, while bee feed increased ellagic acid concentrations.
Overall, both environmental and nutritional factors significantly influenced the biochemical composition, enzyme activities, and phenolic profiles of royal jelly. Glucose supplementation emerged as a key feeding strategy to enhance royal jelly quality by promoting 10-HDA and antioxidant-related compounds, thereby improving its nutritional and functional value.
Data availability
All data that support the findings of this study are contained within the article.
References
Şahinler N, Kaftanoğlu O., The effects of season and honeybee (Apis mellifera L.) genotype on acceptance rates and Royal jelly production. Turk. J. Vet. Anim. Sci. 29 499–503. (2005).
Akyol E., Arı sütünün önemi ve üretim teknikleri. Forth International Muğla Beekeeping and Pine Honey Congress 1–4 Marmaris/Muğla. (2013).
Korkmaz A, Akyol E (2015) Arı sütü üretimi. Ceylan Ofset 1. Baskı ISBN: 978-605-65564-0-1, Samsun. (2015).
Beltekin B, Demir N., Arı sütü üretimi ve bazı Biyoaktif özellikleri. Int. J. Food Agr. Ani. Sci. 2(1), 38–46. (2022).
Boselli E, Caboni MF, Sabatini AG, Marcazzan GL, Lercker G., Determination and changes of free amino acids in Royal jelly during storage. Apidologie 34: 129–137. © INRA/DIB-AGIB/ EDP Sciences. https://doi.org/10.1051/apido:2003011 (2003).
Korkmaz A., Anlaşılabilir arıcılık. Samsun Gıda Tarım Ve Hayvancılık İl Müdürlüğü Yayını, Samsun (2013).
Buttstedt A, Moritz RFA, Erler S., Origin and function of the major Royal jelly proteins of the honeybee (Apis mellifera) as members of the yellow gene family. Biol. Rev. 89(2), 255–269. https://doi.org/10.1111/brv.12052 (2014).
Sidor E, Miłek M, Zaguła G, Bocian A, Dżugan M., Searching for differences in chemical composition and biological activity of crude drone brood and Royal jelly useful for their authentication. Foods, 10(9), 2233. https://doi.org/10.3390/foods10092233 (2021).
Anonymous., http://cografyaharita.com/haritalarim/4l_malatya_ili_haritasi.png (2025).
Anonymous., https://geohack.toolforge.org/geohack.php?pagename=tr:Uluk%C3%B6 (2025).
Anonymous., https://geohack.toolforge.org/geohack.php?pagename=tr:Do%C4%9Fan%C5%9Fehir¶ms=38.0958_N_37.8792_E_source:dewiki_region:TR-44_scale:100000_type:city(43856) (2025).
Barth OM., Botanical resources used by Apis mellifera determined by pollen analysis of Royal jelly in Minas Gerais, Brazil. J. Apic. Res. 44, 78–81. https://doi.org/10.1080/00218839.2005.11101153 (2005).
Mutlu B, Karakuş Ş., Floristic list of İnönü university Malatya main campus area. Hacettepe J. Biol. Chem. 43(2), 73–89. (2015).
Tosyagülü Çelik H, Kaya ÖF., Contribution to the flora of Sürgü (Doğanşehir/Malatya). Kafkas Univ. nsti. Nat. Appl. Sci. J. 10(1), 9–24 (2017).
Yildiz B, Bahçecioğlu Z, Arabaci T, Floristic characteristics of Beydağı (Malatya). Turk. J. Bot. 28(4), 391–419. https://journals.tubitak.gov.tr/botany (2004).
Karlıdağ, S., Köseman, A., Akyol, A., Saatçıoğlu, G., Şeker, İ., Uyumlu, A. B., Erdoğan, S. The effects of different industrial sugars on Royal jelly production. J. Hellenic Veterinary Med. Soc., 73(4), 4689–4696. (2022).
Harry H, Laidlaw JR., Production of queens and package bees. The hive and honey bee (Chap. 23), Dadant and Sons Hamilton Illinois, 989–1042. (1992).
Bogdanov S., Beeswax: uses and trade. The Beeswax Book, 1–16 (2009).
Ough CS., Rapid Determination of Proline in Grapes and Wines, First Published: J. Food Sci.. (1969).
Doi E, Shibata D, Metoba T., Modified colorimetric ninhydrin methods for peptidase assay. Anal. Biochem. 118: 173–184. https://doi.org/10.1016/0003-2697(81)90175-5 (1981).
Bradford MM., A rapid and sensitive method for the quantitation of microgram quantities of protein utilizing the principle of protein-dye binding. https://doi.org/10.1016/0003-2697(76)90527-3 (1976).
Liu JR, Yang YC, Shi LS, Peng CC., Antioxidant properties of Royal jelly associated with larval age and time of harvest. J. Agricult. Food Chem., 56(23), 11447–11452. https://doi.org/10.1021/jf802494e (2008).
Kamiloglu S, Ozkan G, Isik H, Horoz O, Van Camp J, Capanoglu E., Black Carrot pomace as a source of polyphenols for enhancing the nutritional value of cake: an in vitro digestion study with a standardized static model. LWT 77, 475–481. https://doi.org/10.1016/j.lwt.2016.12.002 (2017).
Akgül A., Tıbbi Araştırmalarda İstatistiksel Analiz Teknikleri. 3. Baskı Emek Ofset Ltd Şti, Ankara, (2005).
Özdamar K (2003). SPSS Ile Biyoistatistik. 5. Baskı, Kaan Kitabevi, Ankara
SPSS., SPSS for Windows. Standard Version Release 11,5. Copyright SPSS Inc (2002).
Yavuz İ, Gürel F., Chemical properties of the Royal jellies in Turkish markets. Mediterr. Agric. Sci. 30(3), 281–285. (2017).
Kolayli S, Sahin H, Can Z, Yildiz O, Malkoc M, Asadov A., A member of complementary medicinal food: Anatolian Royal jellies, their chemical compositions, and antioxidant properties. J. Evıdence-Based Integr. Med. 21(4):NP43-NP48. https://doi.org/10.1177/2156587215618832 (2016).
Keskin M, Özkök A, Karahalil FY, Kolaylı S., Arı sütü 10-Hidroksi-2-Dekanoik Asit (10-HDA) miktarı Ne olmalıdır? Mediterr. Agricult. Sci. 33(3), 347–350. https://doi.org/10.29136/mediterranean.698926 (2020).
Salazar Olivo LA, Paz-González V., Screening of biological activities present in honeybee (Apis mellifera) Royal jelly. Toxicol. Vitro 19:645 – 651. https://doi.org/10.1016/j.tiv.2005.03.001 (2005).
Beykaya M, Inkaya NN, Yorulmaz Onder E, Kasko Arici Y, Sahin H., Comprehensive study of the physicochemical properties of Royal jelly from various regions of Türkiye. Chem. Biodivers. https://doi.org/10.1002/cbdv.202300881 (2023).
Sabatini AG, Marcazzan GL, Caboni MF, Bogdanov S, Almeida-Muradian LB., Quality and standardisation of Royal jelly. J. ApiProd ApiMed. Sci. 1(1), 1–6. (2009).
Bloodworth BC, Harn CS, Hock CT, Boon YO., Liquid chromatographic determination of trans-10-hydroxy-2-decenoic acid content of commercial products containing Royal jelly. J. AOAC Inter. 78(4), 1019–1023. https://doi.org/10.1093/jaoac/78.4.1019(1995).
Garcıa-Amoedo LH, Almeıda-Muradİan LB., Determination of trans 10-hydroxy-2-decenoic acid (10- HDA) in Brazilian Royal jelly. Ciencia Y tecnología De Alimentos 23, 62–65. (2003).
Demir F, Sandalcıoğlu ZS, Erkan C., Arı sütü 10-Hda içeriğini Etkileyen bazı faktörler. Arı Ve Arıcılık Teknolojileri Dergisi 2(1), 18–29. (2023).
Ma C, Ahmat B, Li J., Effect of queen cell numbers on Royal jelly production and quality. Curr. Res. Food Sci. 5:1818–1825. https://doi.org/10.1016/j.crfs.2022.10.014 (2022).
Collazo, N., Carpena M, Nuñez-Estevez B, Otero P, Simal-Gandara J, Prieto MA., Health promoting properties of bee Royal jelly: food of the queens. Nutrients 13(2), 543. https://doi.org/10.3390/nu13020543 (2021).
Somerville D., Honey bee nutrition and supplementary feeding. Agnote DAI/178. NSW agriculture. ISSN 1034–6848. (2000).
Wang Y, Ma L, Wang H, Liu Z, Chi X, Xu B., Effects of sucrose feeding on the quality of Royal jelly produced by honeybee Apis mellifera L. Insects 14:742. https://doi.org/10.3390/insects14090742 (2023).
Matute AIR, Weiss M, Sammataro D, Finely J, Sanz ML., Carbohydrate composition of high-fructose corn syrups (HFCS) used for bee feeding: effect on honey composition. J. Agric. Food Chem. 58(12), 7317–7322. https://doi.org/10.1021/jf100758x (2010).
Bugarova V, Godocikova J, Bucekova M, Brodschneider R, Majtan J., Effects of the carbohydrate sources nectar, sucrose and invert sugar on antibacterial activity of honey and bee-processed syrups. Antibiotics 10(8): 985. https://doi.org/10.3390/antibiotics10080985 (2021).
Oskay D, Bayrak G., Investigation of yield and some quality features of Royal jelly harvested from honeybee colonies fed with food substitutes. J. Anim. Prod. 63 (2), 98–104. https://doi.org/10.29185/hayuretim.1185887 (2022).
Thakur M, Nanda V (2020) Composition and functionality of bee pollen: A review. Trends. Food Sci. Technol. 98, 82–106. https://doi.org/10.1016/j.tifs.2020.02.001 (2020).
Karabagias IK, Badeka AV, Kontakos S, Karabournioti S, Kontominas MG., Botanical discrimination of Greek unifloral honeys with physico-chemical and chemometric analyses. Food Chem. 165, 181–190. https://doi.org/10.1016/j.foodchem.2014.05.033 (2014).
Bayram N, Yüzer MO, Bayram S., Melissopalynology analysis, physicochemical properties, multi-element content and antimicrobial activity of honey samples collected from Bayburt, Turkey. U Arı D U Bee J. 19(2), 161–76. (2019).
Oršolić N, Jembrek MJ., Royal jelly: biological action and health benefits. Int. J. Mol. Sci. 25. 6023. https://doi.org/10.3390/ijms25116023 (2024).
Darwish AMG, Abd El-Wahed AA, Shehata MG, El-Seedi HR, Masry SHD, Khalifa SAM, Mahfouz HM, El-Sohaimy SA., Chemical profiling and nutritional evaluation of bee pollen, bee bread, and Royal jelly and their role in functional fermented dairy products. Molecules 28(1), 227. https://doi.org/10.3390/molecules28010227 (2022).
Ahmad S, Campos MG, Fratini F, Altaye SZ, Li J (2020) New insights into the biological and pharmaceutical properties of Royal jelly. Int. J. Mol. Sci. 21: 382. https://doi.org/10.3390/ijms21020382 (2020).
Fernandes KE, Frost EA, Remnant EJ, Schell KR, Cokcetin NN, Carter DA., The role of honey in the ecology of the hive: Nutrition, detoxification, longevity, and protection against hive pathogens. Front. Nutr. 9, 954170. https://doi.org/10.3389/fnut.2022.954170 (2022).
Li S, Tao L, Yu X, Zheng H, Wu J, Hu F., Royal jelly proteins and their derived peptides: Preparation, properties, and biological activities. J. Agricult. Food Chem. 69(48), 14415–14427. https://doi.org/10.1021/acs.jafc.1c05942 (2021).
Kunugi H, Amira MA., Royal jelly and its components promote healthy aging and longevity: from animal models to humans. Int. J. Mol. Sci. 20(19), 4662. https://doi.org/10.3390/ijms20194662 (2019).
Uversky VN, Albar AH, Khan RH, Redwan EM., Multifunctionality and intrinsic disorder of Royal jelly proteome. Proteomics https://doi.org/10.1002/pmic.202000237 (2021).
Vazhacharickal P. J., A review on health benefits and biological action of honey, propolis and Royal jelly. J. Med. Plants Stud. 9(5), 1–13. http://www.plantsjournal.com (2021).
Micheu S, Crailsheim K, Leonhard B., Importance of proline and other amino acids during honeybee flight: (Apis mellifera Carnica POLLMANN). Amino Acids 18, 157–175. (2000).
Tritschler M, Vollmann JJ, Yañez O Chejanovsky N, Crailsheim K, Neumann P, Protein nutrition governs within-host race of honey bee pathogens. Sci. Rep. 7(1), 14988. https://doi.org/10.1038/s41598-017-15358-w (2017).
Jie H, Li PM, Zhao GJ, Feng XL, Zeng DJ, Zhang CL, Lei MY, Yu M, Chen Q., Amino acid composition of royal jelly harvested at different times after larval transfer. Genet. Mol. Res. (2016).
Saito K, Kohama J, Sakamoto Y, Iwasaki Y, Ito R, Horie M, Nakazawa H., Determination of proline enantiomers in honey and Royal jelly by LC-UV, J. AOAC Inter. , 94(2), 482–486, https://doi.org/10.1093/jaoac/94.2.482 (2011).
Ghosh S, Chuleui J, Meyer-Rochow VB (2016) Nutritional value and chemical composition of larvae, pupae, and adults of worker honey bee, Apis mellifera ligustica as a sustainable food source. J. Asia-Pacific Entomol. 19(2):487–495. https://doi.org/10.1016/j.aspen.2016.03.008 (2016).
Bryś MS, Strachecka A., The key role of amino acids in pollen quality and honey bee Physiology—A Review. Molecules 29, 2605. https://doi.org/10.3390/molecules29112605 (2024).
El- Guendouz S, Machado AM, Aazza S, Lyoussi B, Miguel MG, Mateus MC, Figueiredo AC., Chemical characterization and biological properties of Royal jelly samples from the mediterranean area. Nat. Product. Commun. 15(2), 1–13. https://doi.org/10.1080/00218839.2020.1744241 (2020).
Kocot J, Kiełczykowska M, Luchowska-Kocot D, Kurzepa J, Musik I (2018) Antioxidant potential of propolis, bee pollen, and Royal jelly: possible medical application. Oxidative Med. Cell. Longevity 1, 7074209. https://doi.org/10.1155/2018/7074209 (2018).
Bayram NE, Çebi N, Çelik S, Gerçek YC, Bayram S, Tanuğur Samancı AE, Sağdıç O, Özkök A (2021) Turkish Royal jelly: amino acid, physicochemical, antioxidant, multi-elemental, antibacterial and fingerprint profiles by analytical techniques combined with chemometrics. J. Apicultural Res. 60(5), 751–764. https://doi.org/10.1080/00218839.2021.1889222 (2021).
Li QQ, Wang K, Marcucci MC, Sawaya ACHF, Hu L, Xue XF, Wu LM, Hu FL., Nutrient-rich bee pollen: A treasure trove of active natural metabolites. J. Funct. Foods 49, 472–484. https://doi.org/10.1016/j.jff.2018.09.008 (2018).
Liu FL, Zhang XW, Chai JP, Yang DR., Pollen phenolics and regulation of pollen foraging in honeybee colony. Behav. Ecol. Sociobiol. 59 582–588. (2006).
Acknowledgements
This study was supported by Inonu University Scientific Research Project Unit (grant number: FCD-2018-1118).
Funding
Open access funding provided by the Scientific and Technological Research Council of Türkiye (TÜBİTAK). Funding was provided by Inönü Üniversitesi (Grant No. FCD-2018-1118).
Author information
Authors and Affiliations
Contributions
SK: Conceptualization, Data curation, Funding acquisition, Project administration, Resources, Supervision, Visualization, Writing—review and editing. SB: Data curation, Resources, Validation. ZM: Data curation, Resources, Validation. ABU: Conceptualization, Data curation, Resources, Validation, Visualization. ND: Data curation, Resources, Validation. YU: Data curation, Resources, Validation. AA: Conceptualization, Data curation, Resources, Validation, Visualization. AK: Conceptualization, Data curation, Resources, Validation, Visualization. GY: Conceptualization, Data curation, Resources, Validation, Visualization, Writing—review and editing. MY: Conceptualization, Data curation, Resources, Validation, Visualization. IS: Conceptualization, Data curation, Formal analysis, Methodology, Validation, Visualization, Writing—review and editing SE: Conceptualization, Data curation, Formal analysis, Investigation, Methodology, Resources, Validation, Visualization, Writing— original draft and Writing—review and editing.
Corresponding author
Ethics declarations
Competing interests
The authors declare no competing interests.
Consent for publication
All authors agreed to the publication of the manuscript.
Additional information
Publisher’s note
Springer Nature remains neutral with regard to jurisdictional claims in published maps and institutional affiliations.
Rights and permissions
Open Access This article is licensed under a Creative Commons Attribution-NonCommercial-NoDerivatives 4.0 International License, which permits any non-commercial use, sharing, distribution and reproduction in any medium or format, as long as you give appropriate credit to the original author(s) and the source, provide a link to the Creative Commons licence, and indicate if you modified the licensed material. You do not have permission under this licence to share adapted material derived from this article or parts of it. The images or other third party material in this article are included in the article’s Creative Commons licence, unless indicated otherwise in a credit line to the material. If material is not included in the article’s Creative Commons licence and your intended use is not permitted by statutory regulation or exceeds the permitted use, you will need to obtain permission directly from the copyright holder. To view a copy of this licence, visit http://creativecommons.org/licenses/by-nc-nd/4.0/.
About this article

Cite this article
Karlıdağ, S., Basgel, S., Maraş, Z. et al. Effects of sugar type and regional variation on the biochemical composition of royal jelly (Apis mellifera L.). Sci Rep 16, 2934 (2026). https://doi.org/10.1038/s41598-025-32825-x
Received:
Accepted:
Published:
Version of record:
DOI: https://doi.org/10.1038/s41598-025-32825-x
