
Abstract
As electric vehicle adoption accelerates globally, fuel tax revenues decline, exposing government budgets without a proposed replacement tax on electric vehicles. We estimate fuel tax transition exposure across 168 countries, demonstrating that relative exposure, in percentage of total government revenues, varies substantially by income level. Our analysis finds that global public revenues from fuel taxes totalled approximately US$900 billion in 2023. Crucially, we show that lower-income countries face disproportionately high exposure, experience frequent debt crises and possess limited institutional capacity to respond, potentially necessitating international support.
Main
The world is rapidly transitioning to battery-electric vehicles (BEVs), with internal combustion engine (ICE) sales declining1. Consequently, public revenues from motor fuel taxes are falling, creating potential fiscal gaps if not replaced2. This trend has been unfolding for years due to ICE efficiency gains and the rise of hybrid vehicles, but now the transition to full BEVs amplifies the effect, and several countries already face fiscal pressures (Supplementary Table 1). While prior studies have assessed this dynamic in advanced3,4,5 and some middle-income economies6, its implications for low- and lower-middle-income countries remain underexplored7. Critics may argue that expanding electricity access should take priority in such contexts; however, the BEV transition is accelerating faster than expected8. Cost declines and design improvements, largely driven by Chinese automakers and battery manufacturers, have brought affordable BEVs to global markets9,10. China’s BEV sales are projected to surpass ICE sales in 202511, and tariffs on Chinese vehicles in the USA and Europe are pushing low-cost BEVs into developing markets. This shift is already visible across Latin America, Southeast Asia and Africa, where imports from BYD, Leapmotor and JAC Motors are rising12. This situation raises three key questions: how large is the fiscal impact of declining fuel tax revenues, how does it vary across countries and what policy options exist to address it?
To address these questions and bring evidence to the policy discourse, we assembled a new dataset of global fuel tax revenues from gasoline and diesel road vehicles by collecting data from multiple sources and performing some simple transmutations following the benchmark gap approach (Methods). This price gap approach compares local retail prices to a global benchmark price—typically international spot prices for motor fuels—where the difference reflects the presence of a tax or subsidy. While this method has important limitations, including the assumption of uniform benchmark prices and distribution costs across countries as well as consistent retail and marketing margins within countries, it remains a highly relevant and practical tool for quantifying and comparing fuel price distortions across a wide range of national contexts. The data cover 168 countries across four income levels, with the most recent year of data availability being 2023. They include tax revenues from both motor gasoline and diesel. While we recognize that a substantial portion of diesel is consumed by heavy-duty vehicles—whose electrification is progressing more slowly—this fuel remains a key component of overall road transport taxation in many countries13. We found that 137 countries implement a net tax on road vehicle fuel, whereas 31 countries provide net subsidies to road vehicle fuel (Fig. 1a). In total, we estimated that over US$920 billion (in 2024 US dollars) were collected in fuel tax revenues across the 137 taxing countries in 2023. To put this figure into comparison, in 2023 the global investment into renewable power generation was reported at US$735 billion14.

a, Fuel tax revenues are shown for taxing countries on the positive y axis (N = 137 countries) and subsidizing countries on the negative y axis (N = 31 countries). Values are calculated for the year 2023 and shown in real 2024 US dollars. Country income levels are grouped according to the World Bank classification. The definition of taxing versus subsidizing countries follows the benchmark gap approach detailed in Methods. The labels for +US$4 and –US$2 billion point to the low-income taxing and subsidizing countries, respectively, in bright pink. b, Fuel tax revenues as a percentage of total government revenues for all countries (N = 136), high-income countries (N = 51), upper-middle-income countries (N = 35), lower-middle-income countries (N = 36) and low-income countries (N = 14) for the year 2023. The lower and upper box boundaries represent the 25th and 75th percentiles, respectively. The line inside the box represents the median, and the lower and upper whiskers extend to the minimum and maximum of all the data, respectively. The black dots connected by the dashed black line represent the average within each country grouping. Note that the total number of countries in b is lower due to data availability constraints (see Methods for further explanation). See Supplementary Figs. 1 and 2, which display a sensitivity analysis of this figure with high and low benchmark assumptions (Los Angeles CARBOB and Singapore Mogas 92 RON, respectively) for refined gasoline and diesel. See also Supplementary Fig. 3, which reproduces this figure with four outlier countries (Benin, Jordan, Yemen and Venezuela) adjusted.
Beyond absolute exposure, we found that relative fuel tax revenue exposure varies greatly across countries. As a percentage of total government revenues, fuel tax revenues in most countries fall between 4% and 8%. However, when comparing relative exposure by income level, we found that low-income countries are the most affected, with over 9% average exposure, whereas upper-middle- and high-income countries face considerably lower levels, around 2–4% on average. This means that low-income countries face about three times the exposure to potential revenue loss from declining fuel taxes compared with their more affluent counterparts. For context, Organization for Economic Co-operation and Development (OECD) countries spend on average 15% of total government revenues on education, 26.5% on health and 6.5% on defence15,16.
The decarbonization of the economy has led and will be leading to changing sources of public revenues. High- to middle-income countries have begun tapping new sources of revenue, such as carbon taxes or road tolls. High-income countries can do this with a relative ease of implementation—that is, their high administrative capacity and broad-based fiscal frameworks allow for swift adjustment to recover lost revenues. Low-income countries may not be as well equipped, lacking the institutional quality or organizational structure required to design new tax schemes. In the case of the transition to BEVs, most low- to lower-middle-income countries with high percentages of total government revenues generated by fuel tax also exhibit weak institutional quality (Fig. 2).
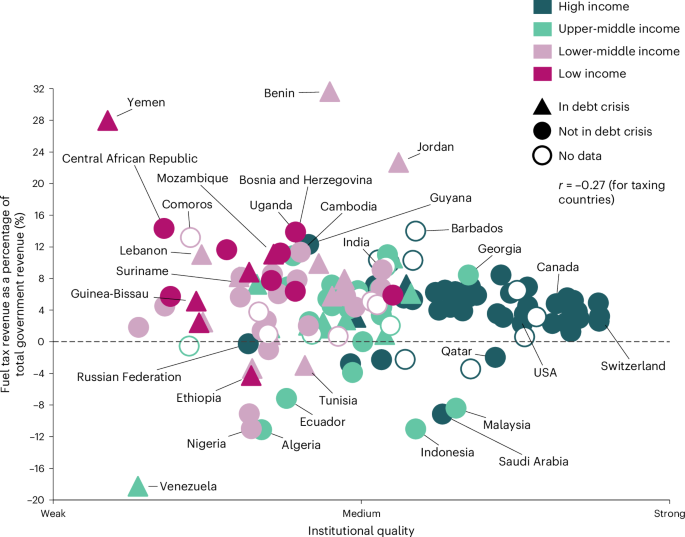
Fuel tax revenue exposure, on the y axis, is calculated as motor fuel tax revenues as a percentage of total government revenues for the year 2023. Institutional quality, on the x axis, is assessed per country on the basis of the World Governance Indicators from the World Bank Group for the year 2023. See Supplementary Note 1 for a full description of how each axis is calculated. The countries are colour-coded to indicate income level according to the World Bank classification. High-, upper-middle-, lower-middle- and low-income countries are shown in dark green, light green, light pink and dark pink, respectively. The countries are shape-coded to indicate the presence of a debt crisis according to data from the Justice Debt Portal. Countries in a debt crisis are depicted with triangles and countries not in a debt crisis with shaded circles. The 19 countries where debt crisis data are missing are depicted with hollowed circles. We found a negative correlation (Pearson coefficient r = −0.27 for 115 taxing countries) between fuel tax transition exposure and institutional quality. See Supplementary Fig. 4, which reproduces this figure with four outlier countries (Benin, Jordan, Yemen and Venezuela) adjusted.
In addition, many exposed countries are in a debt crisis, leading to a greater risk of exposure. In the aftermath of COVID-19, debt distress surged in low- and middle-income countries as governments increased borrowing to offset deficits caused by reduced economic activity and rising public health-care expenditures during lockdown17. This was further exacerbated by limited access to global financial markets and currency depreciation. Consequently, some countries in the upper-left quadrant of Fig. 2—namely, Yemen, Benin, Lebanon, Mozambique, Madagascar, Kenya and Suriname—now face a double exposure with limited headroom to react: fuel tax revenues represent a large share of government income, institutional capacity is too weak to compensate for potential revenue losses and excessive external debt burdens make revenue compensation via debt impossible. We also note that some countries, such as Nigeria, Angola and Vietnam, are major fossil fuel producers and have invested heavily in their domestic oil and gas industries. However, with the decline in oil demand for transport due to the rise of BEVs, these investments could soon become obsolete, resulting in further revenue losses. This situation requires careful consideration, as the political economy of these vested interests may complicate the transition, thus warranting a more in-depth analysis.
In this unfolding narrative, challenges are distributed unevenly. Countries with a heavy reliance on fuel tax revenues and low institutional capacity face the greatest challenges. Should the global BEV transition continue to unfold faster than anticipated, the international community may need to offer assistance for countries with this double exposure. Institutions such as the World Bank or the United Nations Development Program could take the lead in this regard, structuring new tax implementation strategies and frameworks for road vehicles, though they should be cognizant of trade-offs. Key factors include understanding how different taxation types can support or hinder the BEV transition, offer flexibility to manage negative externalities efficiently, reduce implementation barriers and prioritize fairness more readily2. Historically, low-income countries have often relied on indirect taxes (for example, import taxes) due to easier administration18. Applying these to imported BEVs would raise upfront costs and slow adoption in high-risk markets9. Alternatives such as distance-based road charges are emerging19,20, though implementing and enforcing such systems requires substantial technical capacity. Electricity taxation faces considerable implementation barriers—particularly in informal or off-grid contexts—making it an ineffective substitute for fuel taxes or road-use revenue recovery.
When implementing tax reform, it is crucial for these international organizations to collaborate with local governments to simultaneously minimize social backlash from blanket tax hikes and manage political pushback from lost revenues. Importantly, there may be an additional dynamic that exacerbates the need for international support. In view of the increasing BEV production in China and the previously discussed import hurdles in high-income countries, lower-income countries may soon face an incoming flood of cheap Chinese BEVs. This dynamic could support both the global transition to low-carbon transport and the provision of affordable mobility for the population; however, concerns over public revenue may create incentives for governments to impose trade restrictions. Mediating this situation will be easier if policymakers are prepared with taxation options at their disposal. Interestingly, complex regulations and entrenched political interests may slow tax reform in high-income countries, whereas low-income countries, lacking institutional path dependency, could move faster if supported internationally.
As with policymaking, our analysis must be interpreted in local contexts. Applying a global benchmark price can overstate exposure in high-fuel-cost regions such as Japan or California and understate it in countries with lower environmental standards, such as Nigeria or Pakistan. This uncertainty is especially relevant for oil producers and refiners, where below-benchmark retail prices may not imply a straightforward subsidy but rather an opportunity cost to the government, reflecting forgone export revenues. Subsidy estimates for these countries should therefore be interpreted with caution. Nigeria illustrates the fiscal complexity of fuel dependence: it exports crude oil yet imports refined petroleum at market prices due to limited refining capacity. Consequently, revenue outcomes depend on fuel pricing policies and BEV adoption dynamics. Strategically balancing ICE and BEV use could therefore reduce costly fuel imports. These dynamics have two implications. First, our estimates of revenue gaps for countries that both produce and refine oil are probably conservative. Second, estimated fuel tax revenue gaps in crude-oil-exporting countries warrant more nuanced interpretation. Future research could therefore focus more closely on these countries.
The aim of our analysis is not to assess current fiscal risks from BEV penetration but rather to highlight potential future exposure as countries transition their fleets to become fully electric. As such, our framing for policymakers is forward-looking, recognizing that road transport electrification is underway but still requires sustained policy support. Namely, we suggest that national policymakers continue to support the transition to BEVs, accelerating its speed. Anticipating potential tax revenue challenges and developing strategies to address them will help policymakers sustain a supportive environment for BEV adoption throughout the transition. Our analysis suggests that policymakers should assess the exposure of their country using frameworks such as the one depicted in Fig. 2. If this assessment reveals transition challenges, alternative tax options—such as distance-based charging—will require administrative capacity and investment that must be built up over time. In many non-OECD countries, this may involve seeking support from international organizations as discussed above. When implementing such alternative tax options, policymakers should be wary of equity implications—for instance, those related to the affordability of mobility or privacy concerns. Finally, assessing the exposure of individual countries is difficult given the lack of comparable data, and we suggest that international organizations undertake a systematic effort to compile and publicly share regularly updated data on fuel tax revenues across countries. Better data and anticipatory analysis can help governments sustain BEV support by preparing alternative revenue sources, thereby increasing the likelihood of rapid global transport decarbonization.
Methods
Fuel tax revenue calculations and data
There is no consolidated global database for directly sourcing public tax revenues from motor fuel consumption. While the OECD reports motor fuel tax statistics for select countries, the data are often incomplete or reported in non-standardized formats, making cross-country comparison difficult. To estimate motor fuel tax revenues across a wider range of countries, this work applies the benchmark price gap approach—a widely recognized method established by institutions such as the International Energy Agency, the International Monetary Fund, the World Bank Group and the US Federal Reserve21. We followed the specific implementation of Ross et al.22, who compared local retail prices with a global benchmark price. The difference between the country-specific retail price (International Monetary Fund data23) and the global benchmark price (US Energy Information Administration data24,25) represents a tax if the local price is higher or a subsidy if lower. For oil-importing countries, the benchmark price reflects the marginal cost of supplying gasoline to consumers; for oil producers, it represents the government’s opportunity cost, as prices below the benchmark imply foregone market revenue. Multiplying this price gap (US dollars per litre) by annual on-road fuel consumption (litres per year) yields country-level absolute fuel tax revenues (US dollars per year). Relative fuel tax revenues (%) are obtained by dividing by total annual government revenues (US dollars per year). This method is particularly useful when direct data are unavailable and has been used in several notable studies22,23,26,27. Absolute and relative country-specific fuel tax revenue data were sourced from multiple databases, with outliers spot-checked. See Supplementary Note 1 for additional details and for institutional quality and debt-crisis data calculations.
Limitations to the applied benchmark gap approach
The benchmark price gap method relies on several simplifying assumptions that warrant acknowledgment. First, we assumed a uniform distribution and a shipping margin of US$0.10 per litre across all countries, consistent with Ross et al.22, despite known variation in actual distribution costs. This simplification is necessitated by limited and inconsistent data across the 168 countries included. Second, we used a single international benchmark price—refined gasoline and ultra-low-sulfur No. 2 diesel at the New York Harbor—without adjusting for regional differences in refining standards, environmental regulation or proximity to supply hubs. While this may over- or underestimate the benchmark price in specific countries, it provides a consistent and conservative estimate of potential fuel tax exposure (Supplementary Table 2). Regional refined fuel prices generally track closely across major markets. To illustrate the sensitivity range, we recalculated absolute and relative fuel tax exposure for all countries using high and low benchmarks (Los Angeles CARBOB and Singapore Mogas 92 RON, respectively); we present the results in Supplementary Figs. 1 and 2. Third, while retail fuel prices may reflect local variation in market structure, regulation and profit margins, we assumed a competitive retail environment where profit margins are low and do not meaningfully distort the price gap. Despite these limitations, the benchmark gap approach offers a practical and broadly applicable method for cross-country comparison of fuel price distortions, particularly when detailed market data are unavailable.
Reporting summary
Further information on research design is available in the Nature Portfolio Reporting Summary linked to this article.
Data availability
A Supplementary Information document accompanies this article, which includes more details on the methodology. Accompanying formatted data to perform the analysis are available via Zenodo at https://doi.org/10.5281/zenodo.17530560 (ref. 28). Source data are provided with this paper.
References
Global EV Outlook 2024 (International Energy Agency, 2024); https://www.iea.org/reports/global-ev-outlook-2024
Noll, B., Schmidt, T. S. & Egli, F. Managing trade-offs between electric vehicle taxation and adoption. Cell Rep. Sustain. 1, 100130 (2024).
Davis, L. W. & Sallee, J. M. Should electric vehicle drivers pay a mileage tax? Environ. Energy Policy Econ. https://doi.org/10.1086/706793 (2020).
Jenn, A., Azevedo, I. L. & Fischbeck, P. How will we fund our roads? A case of decreasing revenue from electric vehicles. Transp. Res. A 74, 136–147 (2015).
Santos, G. & Cornford, C. A. Road transport electrification and motoring taxation in the UK. Energy Rep. 11, 4326–4337 (2024).
Bonilla, D., Soberon, H. A. & Galarza, O. U. Electric vehicle deployment and fossil fuel tax revenue in Mexico to 2050. Energy Policy 171, 113276 (2022).
Rajagopal, D. Implications of the energy transition for government revenues, energy imports and employment: the case of electric vehicles in India. Energy Policy 175, 113466 (2023).
Why 2025 could be the year of the electric vehicle in developing countries. United Nations Environmental Program https://www.unep.org/news-and-stories/story/why-2025-could-be-year-electric-vehicle-developing-countries (2025).
Noll, B. et al. Battery-electric passenger vehicles to become cost-effective across Africa well before 2040. Preprint at Research Square https://doi.org/10.21203/rs.3.rs-6312923/v1 (2025).
McKerracher, C. China’s electric-car push drives global battery price declines. Bloomberg https://www.bloomberg.com/news/newsletters/2024-12-10/chinese-ev-ambitions-push-down-average-battery-prices-as-catl-byd-grow (10 December 2024).
White, E. & Inagaki, K. China’s EV sales set to overtake traditional cars years ahead of west. Financial Times https://www.ft.com/content/0ebdd69f-68ea-40f2-981b-c583fb1478ef (25 December 2024).
Shepherd, C. How China pulled ahead to become the world leader in electric vehicles. Washington Post https://www.washingtonpost.com/world/2025/03/03/china-electric-vehicles-jinhua-leapmotor/(3 March 2025).
ITF. Decarbonisation and the Pricing of Road Transport: Summary and Conclusions ITF Roundtable Report No. 191 (OECD, 2023); https://doi.org/10.1787/54809337-en
World Energy Investment 2024 (International Energy Agency, 2024); https://www.iea.org/reports/world-energy-investment-2024
Government at a Glance 2023 (OECD, 2023); https://doi.org/10.1787/3d5c5d31-en
Revenue Statistics 2024: Health Taxes in OECD Countries (OECD, 2024); https://doi.org/10.1787/c87a3da5-en
Bulow, J., Reinhart, C., Rogoff, K. & Trebesch, C. The Debt Pandemic (IMF, 2020); https://www.imf.org/en/Publications/fandd/issues/2020/09/debt-pandemic-reinhart-rogoff-bulow-trebesch?utm_source=chatgpt.com
Benitez, J. C., Mansour, M., Pecho, M. & Vellutini, C. Building Tax Capacity in Developing Countries Staff Discussion Notes (IMF, 2023); https://doi.org/10.5089/9798400246098.006
Henley, P. H. NSW passes Australia’s second distance-based EV road user charge legislation. Clayton UTZ https://www.claytonutz.com/knowledge/2021/october/nsw-passes-australias-second-distance-based-ev-road-user-charge-legislation (28 October 2021).
Swiss plan tax on electric vehicles to help finance roads. Reuters https://www.reuters.com/article/swiss-tax-idINL8N2YG3JD (29 June 2022).
Plante, M. The long-run macroeconomic impacts of fuel subsidies. J. Dev. Econ. 107, 129–143 (2014).
Ross, M. L., Hazlett, C. & Mahdavi, P. Global progress and backsliding on gasoline taxes and subsidies. Nat. Energy 2, 16201 (2017).
Black, S., Liu, A. A., Parry, I. W. H. & Vernon-Lin, N. IMF Fossil Fuel Subsidies Data: 2023 Update Working Paper No. 2023/169 (IMF, 2023); https://doi.org/10.5089/9798400249006.001
Petroleum & Other Liquids—New York Harbor Conventional Gasoline Regular Spot Price FOB (US Energy Information Administration, 2025); https://www.eia.gov/dnav/pet/hist/LeafHandler.ashx?n=pet&s=eer_epmru_pf4_y35ny_dpg&f=a
Petroleum & Other Liquids—New York Harbor Ultra-Low Sulfur No 2 Diesel Spot Price (US Energy Information Administration, 2025); https://www.eia.gov/dnav/pet/hist/LeafHandler.ashx?n=PET&s=EER_EPD2DXL0_PF4_Y35NY_DPG&f=A
Fossil Fuels Consumption Subsidies 2022 (IEA, 2023); https://www.iea.org/reports/fossil-fuels-consumption-subsidies-2022
Larson, B. & Shah, A. World Fossil Fuel Subsidies and Global Carbon Emissions Policy Research World Development Report WPS 1002 (World Bank, 1992).
Noll, B. Dataset accompanying: the electric vehicle transition and vanishing fuel tax revenues. Zenodo https://doi.org/10.5281/zenodo.17530560 (2025).
Acknowledgements
We acknowledge funding from the ETH Mobility Initiative via the ESYN project (grant no. 2023-HS-110 MI-05-23) (B.N. and T.S.S.). We also thank the research efforts of F. Feitsch for contributing to data collection and organization.
Funding
Open access funding provided by Swiss Federal Institute of Technology Zurich.
Author information
Authors and Affiliations
Contributions
All authors (B.N., T.S.S. and F.E.) contributed to the conceptualization, writing and editing of the work. B.N. conducted the data collection and visualization.
Corresponding authors
Ethics declarations
Competing interests
The authors declare no competing interests.
Peer review
Peer review information
Nature Sustainability thanks David Bonilla, Aditya Ramji and the other, anonymous, reviewer(s) for their contribution to the peer review of this work.
Additional information
Publisher’s note Springer Nature remains neutral with regard to jurisdictional claims in published maps and institutional affiliations.
Supplementary information
Supplementary Information
Supplementary Notes 1 and 2, Figs. 1–4 and Tables 1 and 2.
Source data
Source Data Fig. 1
Statistical source data for Fig. 1.
Source Data Fig. 2
Statistical source data for Fig. 2.
Rights and permissions
Open Access This article is licensed under a Creative Commons Attribution 4.0 International License, which permits use, sharing, adaptation, distribution and reproduction in any medium or format, as long as you give appropriate credit to the original author(s) and the source, provide a link to the Creative Commons licence, and indicate if changes were made. The images or other third party material in this article are included in the article’s Creative Commons licence, unless indicated otherwise in a credit line to the material. If material is not included in the article’s Creative Commons licence and your intended use is not permitted by statutory regulation or exceeds the permitted use, you will need to obtain permission directly from the copyright holder. To view a copy of this licence, visit http://creativecommons.org/licenses/by/4.0/.
About this article

Cite this article
Noll, B., Schmidt, T.S. & Egli, F. The electric vehicle transition and vanishing fuel tax revenues. Nat Sustain (2026). https://doi.org/10.1038/s41893-025-01721-7
Received:
Accepted:
Published:
Version of record:
DOI: https://doi.org/10.1038/s41893-025-01721-7
