
Abstract
Exposure to nature influences urban dwellers’ well-being and happiness, thereby impacting urban sustainability. However, urban dwellers are exposed to nature in different ways: indirect exposure through window views, incidental exposure when walking along streets, and intentional exposure when visiting parks. Moreover, objective exposure does not necessarily align with how people perceive their exposure to nature. This study examines how three types of objective nature exposure—indirect, incidental, and intentional—provided by greenery and water bodies, along with perceived exposure, impact happiness in Tokyo, Japan. To measure the objective exposure, we use 3D photorealistic city information models, street view imagery, road network datasets, and remote sensing imagery. To measure happiness and perceived exposure, we use data from a national survey, focusing on the results from 10,798 residents in 801 neighborhoods in Tokyo. We first examine the associations between objective exposure and happiness using linear regression and non-linear machine learning models, and then the mediation of perceived exposure through Structural Equation Modeling. Results showed that perceived nature exposure has higher explanatory power for happiness than objective exposure. Views of greenery from windows (indirect exposure) and accessibility to parks (intentional exposure) influenced perceived nature exposure and happiness the most. The quantitative evidence suggests that urban planning align with human behavior, e.g., by prioritizing the improvement of greenery views from windows and park accessibility in Tokyo, to facilitate urban dwellers’ universal nature access for urban sustainability.
Introduction
Mental disorders affect approximately 13.9% of the global population1, and extreme cases lead to about 632,700 suicides annually worldwide2. Urban dwellers in densely populated cities, like Tokyo, are particularly vulnerable to mental disorders and suicide3,4. Observed factors include fast-paced lifestyles5,6,7 and crowded urban environments with pencil buildings, street canyons, and limited sunlight5,8,9. Exposure to nature, e.g., greenery and water bodies, has been found to significantly mitigate urban well-being issues10,11, facilitating urban sustainability12,13. Benefits of the exposure include alleviating physical and mental health issues, e.g., fatigue, stress, and depression14, enhancing productivity15, and increasing life satisfaction16. Consequently, multiple initiatives have promoted urban greening and human-nature interactions. Examples include the United Nation Sustainable Development Goal 11 Target 717 for “providing universal access to safe, inclusive, and accessible, green and public spaces” worldwide by 2030; the “3-30-300” rule18 advocating for adequate green views, nearby greenery, and park proximity; and Tokyo Green Biz19 to “enhance the value of Tokyo’s greenery” for current and future generations. Sustainable planning, design, and maintenance of green-blue infrastructures (e.g., street trees, parks, and water bodies), as nature-based solutions20,21, have been applied to address the growing urban well-being crisis22,23.
Examining the impacts of urban nature on urban dwellers’ well-being, proposing greening initiatives, and monitoring the greening progress require metrics to evaluate urban nature. Commonly assessed metrics are attributes of the urban nature, e.g., the presence and extent of greenery and water bodies14,24,25. In contrast to such landscape-focused metrics, exposure metrics measure the extent to which urban dwellers interact with nature. Exposure not only depends on urban nature settings, such as the spatial distribution of green-blue spaces, road networks, and building height and density, but also on urban dwellers’ motivation for interacting with nature. Objective exposure metrics, e.g., proximity, accessibility, and visibility of green and water spaces26, represent the potential for urban dwellers’ exposure to nature in the urban environment. By contrast, perceived exposure metrics, e.g., feelings of connection to nature27, reflect how much urban dwellers subjectively experience the urban nature.
There exist inconsistent impacts of objective and perceived nature exposure metrics on well-being and planning practices. While objective metrics, e.g., proximity, accessibility, and visibility of greenery and water bodies, generally show positive associations with physical and mental health and life satisfaction10,11,28, these associations can be moderated, weakened, or even reversed in high-crime areas and low-income areas of the Global South25,26,29. By contrast, perceived exposure—self-reported by urban dwellers—tends to associate more strongly and positively with well-being, likely reflecting their active engagement with nature27,30. However, objective metrics can be applied to examine the spatial disparity of the urban nature settings, providing quantitative evidence on urban planning practices, e.g., where to plan new parks and street trees. Differently, perceived exposure is subjective, influenced by lifestyles and personal experiences, and does not necessarily align with the proximity, accessibility, and visibility of the urban nature30. For example, a city with extensive parks but treeless streets may score well on objective exposure metrics, yet its residents, e.g., the elderly and homebodies, may have limited exposure to nature if they tend to stay at home31. Therefore, assessing both objective and perceived metrics is essential for informed planning and design of urban natural space, e.g., greenery and water bodies.
Urban dwellers’ exposure to natural elements, e.g., greenery and water bodies, has been categorized into three types: indirect, incidental, and intentional32. Indirect exposure refers to occasional glimpses of nature through windows, without requiring physical presence. Incidental exposure occurs when residents are physically present in nature but engage unintentionally, such as during street commuting. Intentional exposure involves deliberate activities, such as visiting parks. Together, these three types, viewing through windows, street encounters, and park visits, represent nearly all daily opportunities for urban dwellers to interact with nature33. However, studies combining multiple exposure metrics are limited. First, joint analysis of objective and perceived exposures is scarce due to limited data availability27,28,34. Second, systematically assessing the potential for all three types of exposure is challenging. While incidental and intentional exposures from streets and parks have been studied35,36,37, quantifying indirect exposure via windows remains difficult due to the lack of city-wide view datasets38,39. Given that most of our lives are spent indoors, neglecting indirect exposure overlooks an important aspect of human-nature interaction.
We use Tokyo, the world’s largest megacity, as a case study to examine how three types of objective nature exposure—indirect, incidental, and intentional—provided by greenery and water bodies, along with perceived exposure, impact urban dwellers’ declared well-being. We use happiness as a proxy of well-being40,41,42 since Japan has been conducting a national survey43,44 about citizens’ happiness since 2022, covering 73,358 respondents on average annually. Urban dwellers’ average ratings of happiness and perceived exposure to nature were shared at the cohort level. Figure 1a shows the average happiness ratings for 10,798 respondents, grouped into 801 cohorts across 801 neighborhoods, ranging from 0 (low) to 10 (high). In this study, each neighborhood is defined as multiple city blocks within the ZIP code in which a cohort resides. The average ratings of the perceived exposure to nature range from 1 to 5, as shown in Fig. 1b. A high value indicates that respondents in the neighborhood feel close to nature. Urban Tokyo includes 23 special wards and 26 cities. The 23 special wards collectively making up the core of Tokyo (see Fig. 1a) function similarly to the 26 cities at the western part of the Tokyo Metropolis.

The maps illustrate the spatial distribution of (a) average happiness ratings and (b) perceived exposure to nature among 10,798 respondents, grouped into 801 cohorts across 801 neighborhoods in urban Tokyo. Each circle represents a cohort, with the color gradient indicating the relative level of happiness or perceived exposure (green for high values; red for low values). The bold outline marks the boundary of the study area, and the polygons within represent neighborhoods classified by ZIP code. The inset map shows the administrative boundaries of urban Tokyo and the division of 23 special wards and 26 cities.
Using photorealistic City Information Models (CIMs), street view imagery, network datasets, and remote sensing imagery, we quantify the objective potentials of urban dwellers’ interactions with nature, i.e., the indirect, incidental, and intentional, according to the distribution and quantities of green-blue infrastructures in the neighborhoods using eight indexes. The eight objective indexes are calculated at the neighborhood level across 801 cohorts. Equations of these indices and their geo-registration to the cohort-level happiness are detailed in the Methods.
-
i.
For the indirect exposure, we calculate proportions of greenery and water bodies in CIM-generated photorealistic window views for Window Greenery View Index (WVgreen) and Window Water View Index (WVwater);
-
ii.
For the incidental exposure, we calculate proportions of greenery and water bodies in street views for Street Greenery View Index (SVgreen) and Street Water View Index (SVwater);
-
iii.
For the intentional exposure, we calculate the greenery and blue coverages in the closest park and accessible parks in the buffer zone using the 10-m European Space Agency (ESA) World Cover Map45 to achieve the Closest Park Greenery Index (CPgreen) and the Closest Park Water Index (CPwater), as well as the Average Park Greenery Index (APgreen), and the Average Park Water Index (APwater), respectively.
We also assess the amount of Undeveloped Forest (UF) and Water body (UW), referring to less accessible green-blue spaces, such as prime forests with ponds in the mountainous areas, particularly in western Tokyo, as shown in Supplementary Fig. 1. These spaces differ from parks and street trees that are cultivated for urban recreation, highlighting disparities in natural resources within local contexts. Last, Ordinary Least Squares (OLS) and non-linear machine learning models analyze the associations between three types of objective nature exposure and happiness, with Structural Equation Modeling (SEM) examining perceived exposure as a mediator. For systematic analyses, SVgreen, SVwater, APgreen, APwater, UF, and UW at the neighborhood level are calculated for residences within 500, 750, 1000, 1250, and 1500 m. Unless stated otherwise, our results are based on fully adjusted models with six indexess using the 15-min road network buffer zone (travel distance γ = 1250 m). We present the OLS regression in Results and detail the non-linear regression in Supplementary regarding the minor improvement.
This is the first study to systematically examine the impact difference between objective and perceived exposures to nature on people’s happiness for sustainable urban planning and design. The analytics offer not only a new, generally applicable methodology but quantitative evidence in Tokyo, the world’s largest megacity, to prioritize urban planning and design practices for urban dwellers’ universal access to nature in support of urban sustainability. We decompose urban nature into components by their accessibility (developed (e.g., parks and street trees) and undeveloped (e.g., prime forests with ponds in mountainous areas)), quantify the objective exposure by the types of human-nature interaction (indirect, incidental, and intentional), and collect the perceived exposure from the national survey, as shown in Fig. 2. Using happiness data of 10,798 residents of Tokyo, we revealed the importance of perceived nature exposure on urban dwellers’ happiness, as well as the impact difference of three types of objective nature exposures on perceived nature exposure and happiness. Last, we presented tailored planning and design suggestions that align with human behavior in Tokyo, e.g., prioritizing the improvement of greenery views from windows and park accessibility, for better urban sustainability.

Orange arrows represent direct effects estimated using ordinary least squares (OLS) regression.Green arrows indicate effects mediated by perceived exposure estimated through Structural Equation Modeling (SEM). Red arrows denote effects of covariates (demographic and socioeconomic profiles) controlled in both models.
Results
Spatial distribution of three types of objective exposures to nature in urban Tokyo
Figure 3 shows the spatial distribution of three types of exposures objectively provided by greenery and water bodies in 801 neighborhoods of urban Tokyo. High values of the three types of greenery exposures exist in more neighborhoods than those of the three types of water exposures. For greenery exposure, neighborhoods with high values of WVgreen existed in the southwestern part of urban Tokyo, as shown in Fig. 3a. Neighborhoods with high values of SVgreen were located in the central part, as shown in Fig. 3c. By contrast, Fig. 3e and g show high values of CPgreen and APgreen scattered across individual neighborhoods and clusters of neighborhoods surrounding large parks, respectively. For water exposure, low values of WVwater, SVwater, CPwater, and APwater existed in most neighborhoods. High values existed in neighborhoods close to the river and sea. Except for green-blue infrastructures that provide three types of exposures, Fig. 3i and j show mostly undeveloped forests and water bodies located in the western and eastern parts of Tokyo, respectively.

Indirect exposure represented by (a) WVgreen and (b) WVwater, incidental exposure represented by (c) SVgreen and (d) SVwater, intentional exposure represented by (e-h) CPgreen, CPwater, APgreen, and APwater, and undeveloped natural resources represented by (i) UF and (j) UW. Green color scales represent greenery exposure, and blue color scales represent water exposure, with darker tones indicating higher exposure levels. All variables were calculated at the neighborhood level. WVgreen, WVwater, SVgreen, SVwater, CPgreen, CPwater, APgreen, and APwater are abbreviations of Window Greenery View Index, Window Water View Index, Street Greenery View Index, Street Water View Index, Closest Park Greenery Index, Closest Park Water Index, Average Park Greenery Index, and Average Park Water Index, respectively. UF and UW represent the amount of undeveloped forest and water body, respectively.
Associations between objective exposures to nature and urban dwellers’ happiness
Table 1 shows no observable significant associations between the amount of three types of nature exposures objectively provided by neighborhood greenery and water bodies, and happiness. The insignificant associations indicated no statistically detectable direct contribution of objective nature exposure to happiness. Models OLSCP1250 and OLSAP1250 differ by applying two types of intentional nature exposure metrics, i.e., CPs and APs, respectively. The insignificant associations were also found when using buffer zones of 500, 750, 1,000, and 1,500 m (see Supplementary Table 2). By contrast, covariates, i.e., average mental status (β = 0.418, 0.417, p < 0.001), average income satisfaction (β = 0.168, 0.171, p < 0.001), and average age (β = 0.080, 0.078, p < 0.05), positively influenced respondents’ happiness. One-unit improvement of the top two important factors, i.e., mental status and income satisfaction, increased happiness by 41.8% (± 8.2%, 95% Confidence Interval (CI)) and 16.8% (± 6.9%, 95% CI), respectively.
Associations among objective and perceived nature exposures and urban dwellers’ happiness
Table 2 shows that respondents’ perceived exposure to nature was positively associated with happiness (β = 0.062, p = 0.037). Controlling for other covariates, the increase of every unit of perceived exposure improved 6.2% ( ± 5.9%, 95% CI) of happiness. Compared to the observed insignificant associations between objective exposures and happiness, the significant positive association with perceived exposure indicated that respondents tended to feel happy if they subjectively perceived nature.
Respondents’ perceived exposure mediated the impacts of objective exposures on happiness. There existed significant and positive associations between WVgreen, SVgreen, CPwater, and APgreen and perceived exposure, which in turn significantly and positively influence happiness. Specifically, indirect greenery exposure represented by WVgreen impacted most on the perceived exposure (β = 0.234, 0.280, p < 0.001) and happiness (β = 0.015, 0.017, p ≤ 0.05), whereas incidental greenery exposure represented by SVgreen showed less significant impact on the both (β = 0.115, 0.086, p ≤ 0.029; β = 0.007, p ≤ 0.092). Additionally, intentional exposures represented by CPs and APs showed varied impacts. APgreen positively influenced the perceived exposure (β = 0.156, p < 0.001) and happiness (β = 0.010, p < 0.05), whereas CPgreen showed no significant impacts. Conversely, CPwater was significant for the perceived exposure (β = 0.096, p = 0.001), whereas APwater showed no significant impacts. The inverse relationship between CP and AP for greenery and water bodies suggested that nearby water bodies, rather than greenery, had a greater influence on urban dwellers’ perceptions. Last, undeveloped natural resources like forests, rivers, and the sea (UF: β = 0.265, 0.243, p < 0.001; UW: β = 0.076, 0.086, p ≤ 0.007) also positively influenced urban dwellers’ perceived exposure, even being less viewed and visited from windows, streets, and parks.
Sensitivity of associations between objective and perceived exposures
Figure 4 shows the impact variations of indirect greenery exposure (WVgreen), incidental greenery exposure (SVgreen), intentional greenery and water exposures (APgreen, CPwater, and APwater), and undeveloped natural resources (UF and UW) across buffer zones of 500, 750, 1000, 1250, and 1500 m. Indirect and incidental water exposures (WVwater and SVwater) and CPgreen owned insignificant associations across nearly all the buffer zones, so they were not presented in Fig. 4. First, three greenery exposure indexes (WVgreen, SVgreen, and APgreen) consistently influenced perceived exposure, with window view having the strongest effect (β ≥ 0.226, p < 0.001) (see Fig. 4a #1 and 4b #2), average park accessibility the moderate (β ≥ 0.121, p < 0.001) (see Fig. 4b #3), and the street view the weakest (β ≥ 0.078, p < 0.05) (see Fig. 4b #4). By contrast, water exposure indexes showed mixed results. CPwater became significant (β ≥ 0.096, p < 0.01) beyond the 1000-m buffer (see Fig. 4a #5), while APwater was significant (β ≥ 0.069, p < 0.05) (see Fig. 4b #6) at 500, 1000, and 1500 m.

Coefficients from (a) MCP1250 and (b) MAP1250. Significance codes: ***: < 0.001; **: < 0.01; *: < 0.05. Circles and crosses indicate statistically significant and insignificant effects, respectively. Lines in seven colors represent the impact variation of the seven metrics. WVgreen, SVgreen, CPwater, APgreen, and APwater are abbreviations of Window Greenery View Index, Street Greenery View Index, Closest Park Water Index, Average Park Greenery Index, and Average Park Water Index, respectively. UF and UW represent the amount of undeveloped forest and water body, respectively.
Second, the impacts of greenery and water exposure indexes changed with the increasing sizes of buffer zones. The influences of WVgreen and SVgreen showed a decreasing trend beyond 750 m, reflecting their limited influence over longer distances. APgreen reached a peak (β = 0.168, p < 0.001) at the 1000 m buffer zone (see Fig. 4b #7), indicating an optimal range for its effect. Both the generally increasing impact of CPwater and the decreasing impact of APwater reflected the high significance of nearby water bodies.
Last, UF and UW were consistently significant but changed differently with the increasing sizes of buffer zones. UF’s impact (β ≥ 0.113, p < 0.001) (see Fig. 4a #8) increased as buffer zones expanded, while UW peaked (β ≤ 0.123, p < 0.001) (see Fig. 4a #9) at the 750 m buffer zone.
Overall, indirect greenery exposure (WVgreen) influenced perceived exposure to nature the most, whereas intentional and incidental greenery exposure (APgreen and SVgreen) showed consistently moderate and low impacts, as shown in Fig. 4. Water exposure (CPwater and APwater) had positive impacts only at specific buffer sizes. The varying changes of significance and impacts between greenery and water exposures suggested that urban dwellers’ perception of water is more distance-sensitive than greenery.
Discussion
Our findings revealed different impacts of objective and perceived exposures to nature on happiness in urban Tokyo. We found urban dwellers’ perceived exposure to nature had a direct effect on happiness, whereas the indirect effects of objective exposures on happiness were mediated by the perceived exposure. In urban Tokyo, fast-paced lifestyles may limit the ability of urban dwellers, especially employees, to directly benefit from nature exposure6,7, reducing the impact of objective measures. Other possible constraint factors include urban dwellers’ behavior changes, e.g., increasing digital media use and indoor occupation46, and urban environment issues, e.g., air pollution47, heat island48, and urban density26. Conversely, urban dwellers with higher perceived exposure to nature reported greater happiness, possibly due to their individual high motivation and efforts to access nearby green-blue infrastructures27,30, such as street trees, parks, and ponds, from windows, streets, and parks.
There exist unequal impacts of three types of objective exposures on perceived exposure to nature. Regarding the greenery exposures, there existed varied impacts of indirect (Window view), incidental (Street view), and intentional (Park accessibility) exposures on urban dwellers’ perceived exposure. Window view (WVgreen) had the strongest impact, likely due to the long-term indoor occupation of urban dwellers in Tokyo49,50. Intentional exposure showed a moderate impact. The average amount of greenery from all accessible parks (APgreen) was more impactful than that from the closest park (CPgreen), reflecting the importance of accessibility of multiple “pocket” parks and larger parks in the neighborhood. The 1,000-m buffer zone with the highest impact of APgreen suggested an optimal range for park planning to maximize perceived exposure to nature and happiness. By contrast, incidental greenery exposure (SVgreen) showed the weakest impact. Observed reasons include limited street greenery in Tokyo’s dense urban area and urban dwellers’ limited experience of street greenery due to daily commuting via public transportation, e.g., railways51. Regarding the water exposures, only intentional (accessibility to parks) water exposure showed an observed significant association with perceived exposure at specific buffer sizes. The result indicated the importance of physical visits to water bodies in parks for improvement of urban dwellers’ perceived exposure, regarding indirect and incidental viewing of water bodies from windows and streets. The nearby water bodies in parks had a high impact on urban dwellers’ perceived exposure, possibly due to their high accessibility. For instance, APwater showed the strongest impact at the 500 m buffer zone. Another evidence is the increasing impact of CPwater with the expansion of the buffer zone, as shown in Fig. 4.
The different impacts of objective and perceived exposures to nature on happiness, as well as the unequal effects of three types of objective exposures on perceived exposure, call for considerations in sustainable urban planning and management policies. How can we strategically optimize different types of nature exposure to maximize perceived exposure and happiness in cities? First, as the most impactful indicator, the exposure to greenery provided by windows needs to be enhanced. At the building level, policymakers could require proposed construction projects to conduct visual impact analyses to safeguard and enhance the visibility of greenery for surrounding buildings. Specific design strategies, such as green facades and rooftops, can also increase indirect exposure to greenery in high-rise, high-density urban areas. At the neighborhood level, strategically coordinating building attributes, such as height and window orientation, with the spatial configuration of greenery, is promising to ensure equitable access to greenery views across all buildings. The statistically significant impact of intentional exposure from parks suggests that urban planners should prioritize the availability of greenery and water bodies within multiple accessible parks and the nearby parks, respectively. For incidental exposure from streets, strategically targeting ‘hotspots’ in road networks for tree planting and maintenance has the potential to enhance exposure more efficiently. Example hotspots include roads with high pedestrian flows.
The findings from the sensitivity analysis provide quantitative evidence on radii of planning and design. The “sweet spot” of 1000 m can be used as a benchmark to assess whether buildings’ accessible greenery needs improvement, as the impact of APgreen declined beyond this distance. A 500-m buffer is recommended for evaluating water bodies in accessible parks from the building, given the high impact of nearby water bodies. Additionally, buffer distances of 1500 and 750 m are recommended for assessing the impacts of undeveloped forestss and water bodies surrounding buildings, respectively, when planning green-blue infrastructures for improving three types of objective exposures.
Systematic assessment of nature exposure plays an important role for sustainable urban planning. First, systematic case studies of nature exposure can fill the knowledge gap on how objective and perceived exposure differently affect urban dwellers’ happiness and guide policy making, especially given the limited research using two metrics in tandem due to data constraints28,34. The analytical results enhance the understanding of urban planners, designers, and other decision-makers regarding the relationship between the presence of green-blue infrastructures and the happiness of urban dwellers. For example, the findings pointed out that the high potential of objective nature exposure caused by neighborhood nature settings was not significantly associated with urban dwellers’ happiness in Tokyo. By contrast, urban dwellers with high perceived nature exposures showed a significant impact on their happiness. Regarding this bias, we argue that planners and other decision-makers shall consider public policies on promotion of urban dwellers’ active daily nature exposure, e.g., park use, rather than reshaping the urban environment only27 to better improve urban dwellers’ nature access.
Second, assessment of all potentials of urban dwellers’ objective nature exposures, e.g., the indirect, incidental, and intentional32, provides urban planners with comprehensive quantitative evidence for prioritized practices. Through our systematic assessment and multi-scale analyses, results showed that prioritizing improvement of urban dwellers’ indirect exposure through window view of greenery and intentional exposure through average park accessibility over street-level incidental exposure could be more beneficial. For greenery and water bodies, parks within 1,000 and 500 m shall be considered as planning units for urban environment improvement. The evidence guides tailored intervention to maximize urban dwellers’ nature exposure for universal nature access rather than just even spatial distribution of green-blue space for sustainable urban development in Tokyo.
Last, systematic assessment of nature exposures, e.g., the perceived and objective, emphasizes the role of urban dwellers’ active nature access for existing urban greening and nature interaction initiatives. For example, initiatives, e.g., United Nation Sustainable Development Goal 11 Target 717, “3-30-300” rules18, and Tokyo Green Biz19, are more from the side of physical urban environment change to guide urban planning practices, whereas initiatives and programs aimed at encouraging urban dwellers to engage with nature, e.g., “Green Social Prescribing”52 in UK, should also be emphasized to enhance the value of the urban green-blue infrastructures. Additionally, as the empirical initiatives may not always be practicable for any cities26, the findings from three types of objective exposures also validated the feasibility of initiatives, e.g., “3-30-300” rules, in Tokyo. For example, “3 trees from every home” related to indirect exposure (window views of greenery) shall be first prioritized, and then the “30% tree canopy in every neighborhood” regarding the impact of the intentional exposure (average greenery coverage from all accessible parks). By contrast, optimization of green areas of parks within 1000 m could be more impactful than the closest park within “300 m”, considering the consistently insignificant effects of CPgreen across all buffer sizes, as shown in Supplementary Table 5.
The contributions of this study are threefold. First, this is the first study to systematically explore how objective exposure to nature in cities influences urban dwellers’ happiness through their subjective perceptions. We classified urban nature elements, i.e., greenery and water bodies, by their accessibility (developed/undeveloped), fully quantified three types of objective exposures (indirect, incidental, and intentional), and collected the ratings of perceived exposure from the national survey. The fine-grained decomposition of urban nature enabled a systematic path model between urban nature and urban dwellers’ happiness. Second, using the happiness data of 10,798 urban dwellers in urban Tokyo, we achieved robust quantitative evidence on the mechanism of human-nature interaction for happiness. We found that perceived nature exposure had a higher explanatory power for urban dwellers’ happiness than objective nature exposure; ii) views of greenery from windows (indirect exposure) and accessibility to neighborhood parks (intentional exposure) influenced perceived nature exposure and happiness the most. Lastly, our findings argued the importance of understanding how people perceive nature to plan and design green-blue infrastructures for urban sustainability. Our findings demonstrated that greenery exposure provided by windows and accessible parks in the activity range (travel distance γ = 1000 m) need to be first enhanced to improve urban dwellers’ perceived nature exposure and happiness in urban Tokyo. Overall, the findings in the study identified the linkages among objective exposure to nature, human-perceived exposure, and people’s happiness in cities, contributing to research in environmental studies, psychology, and planning for urban sustainability.
There were also observed limitations that require further investigation. First, although the study’s findings indicated that views of greenery from windows (indirect exposure) and average accessibility to parks (intentional exposure) most significantly influenced perceived nature exposure and happiness, we did not further investigate other types of stimuli, e.g., sound or smell, from parks and windows, due to absent experimental setups and limited data. Second, due to privacy regulations, the analytical results at the neighborhood level may not capture individual-level effects, e.g., how perceived exposure affects the individuals’ happiness through psychological and physiological pathways. Additionally, the generalizability of analytical results needs to be examined in other cities with different urban morphologies and lifestyles. Lastly, the study is cross-sectional, where the analytical results may not capture changes over time. Future work could consider individual-level longitudinal analysis in multiple cities to compare the impact difference of objective and perceived exposures on urban dwellers’ happiness through multiple physical channels, e.g., the visual, auditory, and olfactory, and psychological pathways, e.g., stress reduction.
Methods
Study area
We select the urban Tokyo, i.e., 23 special wards and 26 cities, as a case study for two reasons. First, there exists a contrast between fast-paced lifestyles6,7 and active movements of both urban greening19 and well-being improvement43,44. Studying how objective and perceived nature exposures affect these areas can provide insights to guide Tokyo’s urban greening and well-being efforts and inspire other cities, particularly the high-rise, high-density cities in the Asia-Pacific region, for sustainable urban development6,53. Second, as the world’s largest megacity, Tokyo’s diversified urban morphologies (see Supplementary Fig. 1) enable a comprehensive case study of how different types of objective nature exposure, e.g., indirect (window views), incidental (street views), and intentional (park accessibility)—along with perceived exposure, influence urban dwellers’ happiness. Tokyo’s advanced urban greening and well-being initiatives also provide access to various data sources, e.g., national surveys on happiness and perceived nature exposure, supporting research in urban health, planning, and policy development.
Supplementary Fig. 1 shows the study area, urban Tokyo, with both undulating skyscrapers and low-rise buildings. There existed 20,405 buildings with heights above 30 m in 23 special wards, whereas most low-rise buildings existed in 26 cities with an average height of 7.60 m54. The maximum building density of neighborhoods exceeds 0.9054, and the population density is 6,158 persons per square kilometer. Supplementary Fig. 1 shows unevenly distributed greenery and water bodies. Undeveloped forests and large parks existed in the mountainous areas of central western and western Tokyo. On the contrary, large areas of greenery resources were scarce in central eastern and eastern Tokyo due to intense urban development. As compensation, considerable small parks were constructed in central eastern and eastern Tokyo to enhance urban dwellers' exposure to greenery. Additionally, there were low quantities of water bodies in most areas. The sea bordering eastern Tokyo and the rivers were major water bodies that provided water exposure. The diverse morphology of buildings and green-blue infrastructure results in varying levels of three types of objective nature exposures for urban dwellers.
Conceptual modeling
The study aims to examine the impacts of three types of nature exposure, objectively provided by neighborhood greenery and water bodies, and perceived nature exposure on the happiness of urban dwellers in Tokyo. To carefully examine the objective and perceived nature exposures, we first classify the greenery and water bodies into developed and undeveloped natural resources, as shown in Fig. 2. Compared to lowly accessible undeveloped natural resources, e.g., prime forests and water bodies, green-blue infrastructures, e.g., street trees and parks, are developed for the provision of nature exposure in cities. Then, we assess the amount of three types of nature exposures (indirect, incidental, and intentional) objectively provided by the neighborhood green-blue infrastructures. Last, we collected human-perceived nature exposure from the national survey. By controlling the impact of local undeveloped natural resources and the demographic and socioeconomic profiles of respondents, we try to examine:
-
i.
The significance of perceived and three types of objective nature exposures on happiness, and
-
ii.
The impact difference of three types of objective nature exposures on perceived nature exposure and happiness.
Happiness and perceived nature exposure
The dataset of happiness and perceived nature exposure used in this study covers 10,798 respondents in urban Tokyo, i.e., 23 special wards and 26 cities. The urban Tokyo’s subjective survey data were collected from a nationwide Well-Being Index Dashboard44 managed by Smart City Institute Japan and Japan Digital Agency. Tailored to the research objective, we collected two types of attributes of the respondents from the subjective survey data: i) the happiness and perceived nature exposure, and ii) the basic demographic, socioeconomic, and health profiles, e.g., age, gender, physical status, mental status, and income satisfaction. According to the privacy regulation of the Japan Digital Agency, the dataset was collected at the cohort level, while data for cohorts with fewer than five respondents were excluded. Figure 1 shows 801 available cohorts consisting of 10,798 respondents in neighborhoods covering all special wards and cities of Tokyo.
According to the official User Guide of the Well-Being Index43, the online questionnaire survey was conducted in May 2024. Respondents needed to be Japanese permanent residents aged between 18 and 89. Basic demographic, socioeconomic, and health profiles, e.g., age, gender, physical status, mental status, and income satisfaction, were recorded. Respondents grouped by the neighborhood rated their happiness together with the perceived nature exposure. According to the population of urban dwellers aged between 18 and 89 in Tokyo at 11,462,100, the survey with a sample size of 10,798 (≥ 9595) could achieve representative statistical results with confidence at 95% and a margin of error of 1%. The age composition between the samples and the population of urban Tokyo achieved a good agreement. The average age of 10,798 respondents and the urban dwellers aged between 18 and 89 in Tokyo were 50.90 and 49.87, respectively. The survey collected happiness ratings of relatively more male respondents than female respondents. The ratio between male and female respondents was 1.35:1.
Objective nature exposure metrics
We represented the indirect, incidental, and intentional nature exposures of 801 cohorts at the neighborhood level. In each neighborhood, buildings were randomly sampled with a confidence of 90% and a margin of error of 10%. The sampling size of buildings ranged from 6 to 68 for neighborhoods with varied areas and building densities. The total number of sampled buildings was 52,987. Window views were quantified from the sampled buildings to represent the average level of indirect nature exposure provided by the neighborhood greenery and water bodies, whereas greenery-water amount from street views and parks were quantified within multiple road network buffer zones of sampled buildings to represent the average levels of incidental and intentional nature exposures. We estimated three types of exposures to nature within the 15-min buffer zone with the travel distance γ at 1250 m55. To understand the sensitivity of buffer zone sizes, we further generated buffer zones for each sampled building with γ at 500, 750, 1000, and 1500 m for 6, 9, 12, and 18 min, respectively.
-
i.
Indirect exposure through window view
Window Greenery View Index (WVgreen) and Window Water View Index (WVwater) refer to the proportions of greenery and water bodies occurring in the photorealistic window view image38, respectively, as shown in Fig. 5a. We computed the WVgreen and WVwater at the neighborhood level via Eqs. 1 and 2.
$${{WV}}^{{\rm{nb}}{\rm{h}}{\rm{d}}}=({{WV}}_{1}^{{\rm{bldg}}}+\ldots +{{WV}}_{m}^{{\rm{bldg}}})/m,$$(1)$${{WV}}^{{\rm{bldg}}}=({{WV}}_{1}^{{\rm{f}}}\times {d}_{1}+\ldots +{{WV}}_{n}^{{\rm{f}}}\times {d}_{n})/({d}_{1}+\ldots +{d}_{n}),$$(2)where WVmbldg is WVgreen or WVwater of the sampled building m, and WVnbhd is the average values of WVs of m sampled buildings in the neighborhood. WVnf represents the average values of WVgreen or WVwater quantified from floors of the building facade n, as shown in Fig. 5a. n is the total number of building facades, while d is the facade width.
Figure 5a shows WVbldg quantified from Google photorealistic CIM-generated window view images. Since neighborhood windows often share similar views, we sampled window sites at varying floors of a building for a cost-effective quantification38, as shown in Fig. 5a. Referring to Li’s method38, we controlled the height gap between sampled floors ≤ 5 m. The 3D building geometries, e.g., shape and heights, were collected from the project Plateau54 launched by the Ministry of Land, Infrastructure, Transport and Tourism, Japan. Then, a virtual camera in the geo-visualization platform, Cesium (ver. 1.111), was placed at each window site to capture the outside photorealistic view, as shown in Fig. 5a. Thereafter, photorealistic window view images with the size of 900 × 900 pixels were segmented into the sky, greenery, water body, and construction using the up-to-date deep learning model, Segment of Anything (SAM)56. Finetuned on 3000 annotated photorealistic window views39, the SAM achieved a satisfactory performance with mIoU at 91.61%. The per-class IoUs for greenery and water bodies were 90.59% and 94.88%, respectively. Then, WVgreen and WVwater were quantified by counting pixels of the segmentation mask generated from SAM. The width of the building facade determined the number of neighborhood windows represented by the sampled window view on each floor20. Thus, we aggregated the values of WVfgreen and WVfwater at all building facades using the facade width d as the weight via Eq. 2. Last, WVnbhd was computed by averaging the values of WVbldg of sampled buildings via Eq. 1. We generated a total of 302,470 window view images for sampled buildings in 801 neighborhoods.
-
ii.
Incidental exposure through street view
Street Greenery View Index (SVgreen) and Street Water View Index (SVwater) refer to the proportions of greenery and water bodies occurring in the street view image, respectively, as shown in Fig. 5b. We computed SVgreen and SVwater at the neighborhood level via Eqs. 3 and 4.
$${{SV}}^{{\rm{nbhd}}}=({{SV}}_{1}^{{\rm{bldg}}}+\ldots +{{SV}}_{m}^{{\rm{bldg}}})/m,$$(3)$${{SV}}^{{\rm{bldg}}}=({{SV}}_{1}^{{\rm{bf}}}+\ldots +{{SV}}_{p}^{{\rm{bf}}})/p,$$(4)where SVmbldg is SVgreen or SVwater of the sampled building m, and SVnbhd is the average value of SVs of m buildings in the neighborhood. SVpbf represents the SVgreen or SVwater of the sampled street view p within the buffer zone. The irregular buffer zones were convex hulls covering the road network segments sprawling from the sampled building with γ at 500, 750, 1000, 1250, and 1500 m.
Figure 5b shows SVgreen and SVwater quantified from street view images. We first collected the 360-degree panoramas from Google Street View at a 50-m interval for the whole study area. We manually removed street views captured inside commercial buildings, train stations, and developed green-blue spaces, e.g., temples, gardens, and parks, for pure quantification of nature exposures on the streets. Additionally, low-quality street views, e.g., the overexposed and blurred, were excluded due to information loss. Then, the front and rear views of the street with a size of 2048 × 1024 pixels were converted from the panorama, as shown in Fig. 5b. We extracted the greenery and water bodies from the front and rear street views using the Dense Prediction Transformer (DPT)57 trained on the ADE20K dataset58. The erroneous segmentation of large-area greenery and water bodies within street views was manually improved to enhance DPT’s performance, with per-class IoUs at 83.56% and 73.89%, respectively. Thereafter, SVgreen and SVwater were aggregated in the buffer zone of each sampled building via Eq. 4. Last, the SVnbhd was computed by averaging the values of SVbldg of all sampled buildings via Eq. 3. Overall, 699,934 Google Street Views were quantified for sampled buildings of 801 neighborhoods.
-
iii.
Intentional exposure through available greenery and water bodies in parks
Fig. 5: Systematic assessment of three types of objective exposures and undeveloped natural resources. 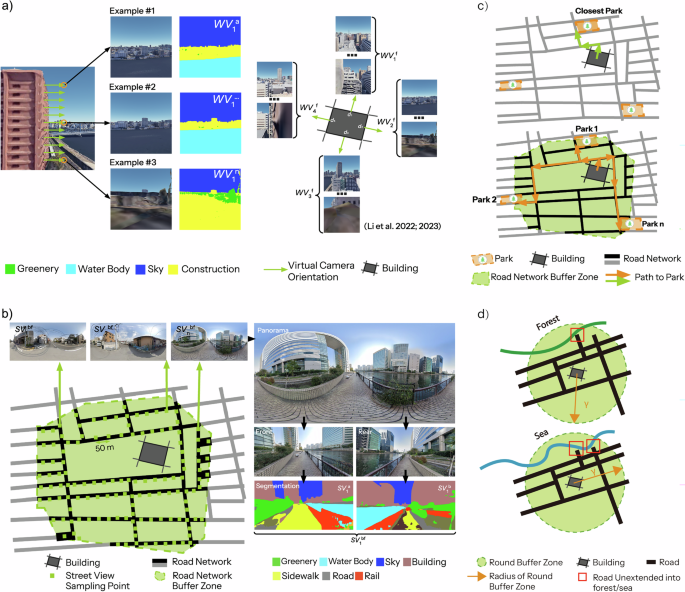
The figure presents a systematic assessment of three types of objective exposures to nature: (a) indirect exposure through window views, (b) incidental exposure through street views, and (c) intentional exposure through park accessibility. It also includes (d) undeveloped natural resources, such as greenery in prime forests and water bodies like ponds in Tokyo’s mountainous areas.
Urban dwellers’ intentional nature exposure was represented using two types of metrics, i.e., the average area of greenery and water resources of the i) closest park and ii) accessible parks within the buffer zones of the sampled building. The two types of metrics highlight individual neighborhoods and clusters of neighborhoods that benefit from high nature exposure from surrounding large parks, respectively (see Fig. 3). The corresponding indexes are the Closest Park Greenery Index (CPgreen), Closest Park Water Index (CPwater), Average Park Greenery Index (APgreen), and Average Park Water Index (APwater). In this study, the park refers to multiple types of natural spaces that provide visitable greenery and water bodies for recreation. The quantified natural spaces include the garden, playground, and temple. Particularly, we computed the CPgreen and CPwater at the neighborhood level via Eqs. 5 and 6.
$${{CP}}^{{\rm{nbhd}}}=({{CP}}_{1}^{{\rm{bldg}}}+\ldots +{{CP}}_{m}^{{\rm{bldg}}})/m,$$(5)$${{CP}}^{{\rm{bldg}}}={area}({closest}(\{{P}_{1},{P}_{2},\ldots ,{P}_{q}\})),$$(6)

where CPmbldg is the CPgreen or CPwater of the closest park from the sampled building m. CPnbhd refers to the average values of CPbldg of m sampled buildings within the neighborhood. Closest is a spatial function to identify the closest park P of the sampled building, whereas area is a function to calculate the areas of the greenery or water bodies of the closest park. Pq refers to the park q.
Additionally, we computed the APgreen and APwater at the neighborhood level via Eqs. 7 and 8.
where APmbldg is the APgreen or APwater of the sampled building m. APnbhd refers to the average values of APbldg of m sampled buildings within the neighborhood. Pkbf refers to the park k within the buffer zone.
Figure 5c shows CPgreen, CPwater, APgreen, and APwater computed from the network analysis. The network analysis was conducted based on park sets and road networks from OpenStreetMap datasets, building footprints from Plateau, and remote sensing imagery of greenery and water bodies from the ESA World Cover 10 m45 via Google Earth Engine. First, the closest park was extracted by comparing the road network distance between the sampled building and parks, as shown in Fig. 5c. Accessible parks of the sampled building were identified by spatially joining the affiliated buffer zones and the polygon vectors of parks, as shown in Fig. 5c. Then, the areas of greenery and water bodies of the closest and accessible parks were quantified from the ESA World Cover 10 m for CPgreen, CPwater, APgreen, and APwater via Eqs. 6 and 8. Last, we aggregated the four building-level indexes for CPgreen, CPwater, APgreen, and APwater via Eqs. 5 and 7. Overall, 11,931 parks were collected for the analysis of 52,987 sampled buildings in 801 neighborhoods.
Covariates
We controlled the typical demographic and socioeconomic profile attributes related to happiness within the cohorts. The five covariates include the average age, gender proportion, average physical status, average mental status, and average income satisfaction. On a five-point Likert scale, the average physical and mental statuses of the cohorts were 3.23 and 3.31, respectively. Both values above three indicated a relatively good health status. By contrast, there existed a slightly low income satisfaction, with the mean at 2.91.
We also controlled the area of undeveloped natural resources in the local context. Examples are forests on mountains and hills in western Tokyo. Different from developed green-blue infrastructures, e.g., street trees and parks, there existed large quantities of undeveloped natural resources with low accessibility for urban dwellers’ greenery and water exposure. Nevertheless, urban dwellers may also feel close to nature due to long-term local experiences, even with limited viewable and visitable greenery and water bodies from windows, streets, and accessible parks. Thus, we defined the Undeveloped Forest Index (UF) and Undeveloped Water Index (UW) as the area of undeveloped natural resources within the sampled building’s buffer zone for control purposes. We quantified UF and UW at the neighborhood level via Eqs. 9 and 10.
where Umbldg is UF or UW of the building m, and Usbf refers to the undeveloped natural resource s within the buffer zone.
Figure 5d shows the assessment of undeveloped natural resources. In this study, we regarded greenery (e.g., forests) and water bodies (e.g., sea and rivers) that were not from streets and parks as undeveloped natural resources. The UF and UW of each sampled building were computed from the ESA World Cover 10 m via Google Earth Engine. The polygon vectors of undeveloped natural resources were collected from OpenStreetMap datasets. We aggregated the area of greenery and water bodies of each vector polygon within a buffer zone of the sampled buildings. Particularly, due to urban dwellers’ low accessibility to the undeveloped natural resources through road networks, we used the round buffer zones (γ = 500, 750, 1000, 1250, and 1500 m) to compute UFbldg and UWbldg as shown in Fig. 5d. Last, the UFnbhd and UWnbhd were computed by averaging the values of UFbldg and UWbldg via Eq. 9.
Statistical analyses
We first conducted both OLS regressions and non-linear machine learning regressions to test the associations between objective exposures and happiness. Then, regarding the analytical results, we added the mediator variable, perceived nature exposure, into the relationships through Path Analysis, a subset of SEM. Carefully following the basic assumptions, we conducted regression analyses using the R programming language (ver. 4.4.1).
For OLS regression, we first confirmed all independent variables, including three types of objective exposure indexes and covariates without high correlations. Pearson and Spearman correlation analyses were conducted for independent variables according to their normality. The scatter plots between independent variables and dependent variables, between independent variables and the mediator, were examined to identify and transform the non-linear relationships. For example, all three greenery exposure indexes were transformed through a natural logarithmic function to maintain a linear relationship with human-perceived nature exposure. Then, by controlling covariates, we examined the associations between three types of objective nature exposure indexes and average ratings of happiness (see Eq. 11).
All variables were normalized and R2 was applied to assess the model performance. A high value of R2 indicates a high explainability of the observation variables and covariates. Last, we conducted a series of analyses for the regression model to confirm the validity of the statistical result. The analyses included collinearity analysis, Durbin–Watson analysis for the independence of the observation, casewise diagnostics for outlier detection, analysis of variance (ANOVA) (see Supplementary Tables 3 and 4), and Moran’s I test for spatial autocorrelation (see Supplementary Table 7). Scatter plots for predicted values and residuals, as well as scatter plots for independent variables and error terms, were examined to confirm an even distribution. Analyses through non-linear machine learning models were detailed via Supplementary Fig. 2 regarding the minor improvement of R2 (see Supplementary Table 1).
For SEM analysis, we constructed models based on the conceptual modeling as shown in Fig. 2. Due to the insignificant associations between three types of objective exposures and happiness, we turned to examine the direct effect of perceived exposure on happiness, and the indirect effects of three types of objective exposures on happiness mediated by perceived exposure (see Eqs. 12 and 13). The constructed models among three types of objective nature exposures, covariates, human-perceived nature exposure, and happiness were adjusted step-by-step to achieve a satisfactory fit performance. We added spatial error terms (u) to avoid spatial autocorrelation of residuals in the analyses (see Eq. 13 and Supplementary Table 8). The estimator, Generalized Least Squares, was used to estimate model parameters. The evaluation metrics of the model fit include Chi-Square statistic (CHISQ), CHISQ/degree of freedom (df), Goodness of Fit (GFI), Comparative Fit Index (CFI), Standardized Root Mean Square Residual (SRMR), and Root Mean Square Error of Approximation (RMSEA) as shown in Supplementary Table 6.
Data availability
The datasets generated and analyzed during the current study are not publicly available due to privacy concerns and location-identifiable information contained in the spatial data but are available from the corresponding author on reasonable request.
Code availability
The underlying code for this study is not publicly available but may be made available to qualified researchers on reasonable request from the corresponding author.
References
WHO. World Mental Health Report: Transforming Mental Health for All. https://iris.who.int/server/api/core/bitstreams/40e5a13a-fe50-4efa-b56d-6e8cf00d5bfa/content (WHO, 2022).
WHO. Suicide Worldwide in 2019: Global Health Estimates. https://iris.who.int/server/api/core/bitstreams/3bd4ac79-4347-420e-b675-948d36ab3d90/content (WHO, 2021).
Tanaka, T. & Okamoto, S. Increase in suicide following an initial decline during the COVID-19 pandemic in Japan. Nat. Hum. Behav. 5, 229–238 (2021).
Chiba, T. et al. Event-related PTSD symptoms as a high-risk factor for suicide: longitudinal observational study. Nat. Ment. Health 1, 1013–1022 (2023).
WHO. Integrating Health in Urban and Territorial Planning: A Sourcebook. https://iris.who.int/server/api/core/bitstreams/0c4c5999-7e7b-4372-b9ce-62763336de5c/content (WHO, 2020).
Yamazaki, T. et al. Use of urban green spaces in the context of lifestyle changes during the COVID-19 pandemic in Tokyo. Sustainability 13, 9817 (2021).
Otsuka, Y., Imanishi, J., Nasu, M. & Iwasaki, Y. Probabilistic inference on the factors promoting park use by machine learning using panel data from 2014 to 2020 in Tokyo, Japan. Cities 141, 104509 (2023).
Asgarzadeh, M., Lusk, A., Koga, T. & Hirate, K. Measuring oppressiveness of streetscapes. Landsc. Urban Plan. 107, 1–11 (2012).
Asgarzadeh, M., Koga, T., Hirate, K., Farvid, M. & Lusk, A. Investigating oppressiveness and spaciousness in relation to building, trees, sky and ground surface: a study in Tokyo. Landsc. Urban Plan. 131, 36–41 (2014).
Jiang, B. et al. A generalized relationship between dose of greenness and mental health response. Nat. Cities 2, 739–748 (2025).
Li, Y. et al. Acute mental health benefits of urban nature. Nat. Cities 2, 720–731 (2025).
Lin, B. B. et al. Nature experience from yards provide an important space for mental health during Covid-19. npj Urban Sustain. 3, 14 (2023).
Lee, Y. & Han, S. From greenery to community: exploring the mediating role of loneliness in social cohesion. npj Urban Sustain. 5, 6 (2025).
Maes, M. J. A. et al. Benefit of woodland and other natural environments for adolescents’ cognition and mental health. Nat. Sustain. 4, 851–858 (2021).
Van Esch, E., Minjock, R., Colarelli, S. M. & Hirsch, S. Office window views: view features trump nature in predicting employee well-being. J. Environ. Psychol. 64, 56–64 (2019).
Chen, B. et al. Beyond green environments: multi-scale difference in human exposure to greenspace in China. Environ. Int. 166, 107348 (2022).
UN. Transforming Our World: The 2030 Agenda for Sustainable Development. https://docs.un.org/en/A/RES/70/1 (UN, 2015).
Konijnendijk, C. The 3-30-300 rule for urban forestry and greener cities. Biophil. Cities J. 4, 2 (2021).
TMG. TOKYO GREEN BIZ - Green Urban Development. https://www.english.metro.tokyo.lg.jp/documents/d/english/0804_01_01a-pdf (TMG, 2023).
Li, M., Xue, F. & Yeh, A. G. O. Bi-objective analytics of 3D visual-physical nature exposures in high-rise high-density cities for landscape and urban planning. Landsc. Urban Plan. 233, 104714 (2023).
Raymond, C. M. et al. Applying multispecies justice in nature-based solutions and urban sustainability planning: Tensions and prospects. npj Urban Sustain. 5, 2 (2025).
Ordóñez, C., Labib, S. M., Chung, L. & Conway, T. M. Satisfaction with urban trees associates with tree canopy cover and tree visibility around the home. npj Urban Sustain. 3, 37 (2023).
Van Oorschot, J., Slootweg, M., Remme, R. P., Sprecher, B. & Van Der Voet, E. Optimizing green and gray infrastructure planning for sustainable urban development. npj Urban Sustain. 4, 41 (2024).
Sarkar, C., Webster, C. & Gallacher, J. Residential greenness and prevalence of major depressive disorders: a cross-sectional, observational, associational study of 94 879 adult UK Biobank participants. Lancet Planet. Health 2, e162–e173 (2018).
Berdejo-Espinola, V., Fuller, R. A. & Zahnow, R. Well-being from nature exposure depends on socio-environmental contexts in Paraguay. Nat. Cities 1, 335–345 (2024).
Syamili, M. S., Takala, T., Korrensalo, A. & Tuittila, E.-S. Happiness in urban green spaces: a systematic literature review. Urban Green. 86, 128042 (2023).
White, M. P. et al. Associations between green/blue spaces and mental health across 18 countries. Sci. Rep. 11, 8903 (2021).
Reyes-Riveros, R. et al. Linking public urban green spaces and human well-being: A systematic review. Urban Green. 61, 127105 (2021).
Ambrey, C. L. Urban greenspace, physical activity and wellbeing: the moderating role of perceptions of neighbourhood affability and incivility. Land Use Policy 57, 638–644 (2016).
Aoshima, I., Uchida, K., Ushimaru, A. & Sato, M. The influence of subjective perceptions on the valuation of green spaces in Japanese urban areas. Urban Green. 34, 166–174 (2018).
Croeser, T., Sharma, R., Weisser, W. W. & Bekessy, S. A. Acute canopy deficits in global cities exposed by the 3-30-300 benchmark for urban nature. Nat. Commun. 15, 9333 (2024).
Keniger, L., Gaston, K., Irvine, K. & Fuller, R. What are the benefits of interacting with nature? IJERPH 10, 913–935 (2013).
Cox, D. T. C., Hudson, H. L., Shanahan, D. F., Fuller, R. A. & Gaston, K. J. The rarity of direct experiences of nature in an urban population. Landsc. Urban Plan. 160, 79–84 (2017).
Papastergiou, E., Kalogeresis, A., Latinopoulos, D. & Ballas, D. The greener, the better? A comprehensive framework for studying the effect of urban green spaces on subjective well-being. Discov. Cities 2, 23 (2025).
Wang, R. et al. Dynamic greenspace exposure and residents’ mental health in Guangzhou, China: from over-head to eye-level perspective, from quantity to quality. Landsc. Urban Plan. 215, 104230 (2021).
Yue, Y., Yang, D. & Van Dyck, D. Urban greenspace and mental health in Chinese older adults: Associations across different greenspace measures and mediating effects of environmental perceptions. Health Place 76, 102856 (2022).
Mao, Y. et al. The greener the living environment, the better the health? Examining the effects of multiple green exposure metrics on physical activity and health among young students. Environ. Res. 250, 118520 (2024).
Li, M., Xue, F., Wu, Y. & Yeh, A. G. O. A room with a view: automatic assessment of window views for high-rise high-density areas using city information models and deep transfer learning. Landsc. Urban Plan. 226, 104505 (2022).
Li, M., Yeh, A. G. O. & Xue, F. CIM-WV: A 2D semantic segmentation dataset of rich window view contents in high-rise, high-density Hong Kong based on photorealistic city information models. Urban Info. 3, 12 (2024).
Kammann, R., Farry, M. & Herbison, P. The analysis and measurement of happiness as a sense of well-being. Soc. Indic. Res. 15, 91–115 (1984).
Veenhoven, R. Happiness, Also Known as ‘Life Satisfaction’ and ‘Subjective Well-Being’. in Handbook of Social Indicators and Quality of Life Research 79–98 (Springer Science & Business Media, 2011).
Medvedev, O. N. & Landhuis, C. E. Exploring constructs of well-being, happiness and quality of life. PeerJ 6, e4903 (2018).
JDA. Guidebook for Using the Well-Being Index. https://well-being.digital.go.jp/downloads/guidebook/Well-Being_guidebook_full_19Mar.pdf (JDA, 2025).
JDA. Municipality Well-Being Survey Dashboard. https://well-being.digital.go.jp/dashboard/ (JDA, 2025).
Zanaga, D. et al. ESA WorldCover 10 m 2020 v100. Zenodo https://doi.org/10.5281/ZENODO.5571936 (2021).
Edwards, R. C. & Larson, B. M. H. When screens replace backyards: strategies to connect digital-media-oriented young people to nature. Environ. Educ. Res. 26, 950–968 (2020).
Huang, G., Jiang, Y., Zhou, W., Pickett, S. T. A. & Fisher, B. The impact of air pollution on behavior changes and outdoor recreation in Chinese cities. Landsc. Urban Plan. 234, 104727 (2023).
Kumakura, E., Ashie, Y. & Ueno, T. Assessing the impact of summer heat on the movement of people in Tokyo based on mobile phone location data. Build. Environ. 265, 111952 (2024).
Althoff, T. et al. Large-scale physical activity data reveal worldwide activity inequality. Nature 547, 336–339 (2017).
Abe, R., Ikarashi, T., Takada, S. & Fukuda, D. Impact of working from home on travel behavior of rail and car commuters: a case study in the Tokyo metropolitan area. Case Stud. Transp. Policy 11, 100938 (2023).
Liang, J., Miwa, T., Wang, J. & Morikawa, T. Impact of telecommuting on Japanese Citizen’s travel, activities, and residential locations: experiences and future expectations under COVID-19 pandemic. Asian Transp. Stud. 9, 100105 (2023).
NHS. Green Social Prescribing Toolkit. https://socialprescribingacademy.org.uk/media/mona1pmt/green-social-prescribing-toolkit.pdf (2023).
Mejía Salazar, G. Green urban planning in Tokyo: managing natural spaces for sustainable development. Jpn. Soc. Cult. 7, 52882 (2025).
MLIT. Project PLATEAU | Map the New World. https://www.mlit.go.jp/en/toshi/daisei/content/Leaflet_en.pdf (MLIT, 2023).
Kolcsár, R. A., Csikós, N. & Szilassi, P. Testing the limitations of buffer zones and Urban atlas population data in urban green space provision analyses through the case study of Szeged, Hungary. Urban Green. 57, 126942 (2021).
Kirillov, A. et al. Segment Anything. in 2023 IEEE/CVF International Conference on Computer Vision (ICCV) 3992–4003, https://doi.org/10.1109/ICCV51070.2023.00371 (IEEE, 2023).
Ranftl, R., Bochkovskiy, A. & Koltun, V. Vision Transformers for Dense Prediction. in 2021 IEEE/CVF International Conference on Computer Vision (ICCV) 12159–12168, https://doi.org/10.1109/ICCV48922.2021.01196 (IEEE, 2021).
Zhou, B. et al. Scene Parsing through ADE20K Dataset. in 2017 IEEE Conference on Computer Vision and Pattern Recognition (CVPR) 5122–5130, https://doi.org/10.1109/CVPR.2017.544 (IEEE, 2017).
Acknowledgements
The work presented in this study was supported in part by the Hong Kong Science and Technology (Guangzhou) Start-up Fund(G0101000327). The authors thank all members of the MIT Senseable City Lab Consortium: FAE Technology, Dubai Future Foundation,Sondotécnica, Seoul AI Foundation, Arnold Ventures, Sidara, Toyota, Abu Dhabi’s Department of Municipal Transportation, A2A,UnipolTech, Consiglio per la Ricerca in Agricoltura e l’Analisi dell’Economia Agraria, Hospital Israelita Albert Einstein, KACST, KAIST, AMS Institute, and the municipalities of Amsterdam, Laval, and Rio de Janeiro. The authors also thank Woven by Toyota for theirvaluable support and HPC2021 computing services offered by Information Technology Services, the University of Hong Kong, for this research.
Author information
Authors and Affiliations
Contributions
M.L. and S.G. equally contributed to the study by conceiving and designing the research, collecting and analyzing the data, and writing the paper. F.D. conceived and designed the research and reviewed and edited the paper. A.K. and N.K., as local experts, supported the project and discussed the findings. F.X., W.Z., A.G.O.Y., and C.R. reviewed the paper with critical comments and suggestions. F.D. and C.R. supervised the project. All authors approved the manuscript and this submission.
Corresponding author
Ethics declarations
Competing interests
The authors declare no competing interests.
Additional information
Publisher’s note Springer Nature remains neutral with regard to jurisdictional claims in published maps and institutional affiliations.
Supplementary information
Rights and permissions
Open Access This article is licensed under a Creative Commons Attribution-NonCommercial-NoDerivatives 4.0 International License, which permits any non-commercial use, sharing, distribution and reproduction in any medium or format, as long as you give appropriate credit to the original author(s) and the source, provide a link to the Creative Commons licence, and indicate if you modified the licensed material. You do not have permission under this licence to share adapted material derived from this article or parts of it. The images or other third party material in this article are included in the article’s Creative Commons licence, unless indicated otherwise in a credit line to the material. If material is not included in the article’s Creative Commons licence and your intended use is not permitted by statutory regulation or exceeds the permitted use, you will need to obtain permission directly from the copyright holder. To view a copy of this licence, visit http://creativecommons.org/licenses/by-nc-nd/4.0/.
About this article

Cite this article
Li, M., Guo, S., Duarte, F. et al. Influence of objective and perceived exposures to urban nature on people’s happiness. npj Urban Sustain 6, 6 (2026). https://doi.org/10.1038/s42949-025-00306-9
Received:
Accepted:
Published:
Version of record:
DOI: https://doi.org/10.1038/s42949-025-00306-9
