
Abstract
Electric light-duty vehicle sales are increasing, but adoption is not uniform. Forecasting who is adopting and when is crucial to planning infrastructure, creating incentives, and ensuring equity. We identify different clusters of adopters in California, examine adoption rates within them, and forecast adoption trajectories. Clusters are classified by revealed characteristics using results from a multi-year survey of 18,921 plug-in electric vehicle (PEV) adopters. Eight clusters are identified: four each among single-vehicle and multi-vehicle households. We classify the population into these segments and simulate future PEV adoption using Bass diffusion. We compare adoption trajectories—assuming current rates of adoption, a scenario of 100% new vehicle sales by 2035, and a scenario of “net zero” by 2045. Our analysis finds large clusters with low to-date PEV adoption, encompassing 47% of the population, and results reveal some clusters are not on track to meet California sales targets and/or climate goals.
Introduction
Plug-in electric vehicles (PEVs) play a crucial role in decarbonizing transportation globally as they can reduce vehicle greenhouse gas emissions especially when powered by low-carbon electricity. PEVs, which include battery electric vehicles (BEVs) and plug-in hybrid electric vehicles (PHEVs), are a subset of zero-emission vehicles (ZEVs) that are experiencing rapid growth. As an example, in California PEVs accounted for 25.3% of new light-duty vehicle sales in 20241. Recent policies aim to ensure a full transformation of the light-duty vehicle sector to ZEVs or PEVs, with supply-side regulations including mandates. Several regions have adopted such policies, which require vehicle manufacturers to sell or produce a certain quantity of such vehicles in a given year2. Studies have shown that early PEV adopters have been more affluent than the general population, across multiple regions and prior to the 2020s—they are highly educated, have higher incomes, own homes, and possess many vehicles3,4,5. However, the expanding PEV market signals a shift towards broader accessibility, with more typical households adopting the technology.
This paper uses California as a case study to examine the potential path to full light-duty vehicle electrification, especially within different segments of the population. With a supply-side mandate, Advanced Clean Cars II (ACCII)6, California plans to electrify all new vehicle sales and eventually transform its entire vehicle fleet. ACCII is explained in further detail in “Context”. We aim to investigate heterogeneity in PEV adopters and determine rates of adoption needed to meet climate goals. Specifically, we intend to answer the following research questions:
-
What types of households adopt PEVs?
-
How quickly have different types of households adopted PEVs?
-
How quickly will different types of households need to adopt to achieve full PEV transition targets?
Our study extends the existing body of knowledge on PEV adoption by providing insights into PEV adopter heterogeneity and adoption rates relative to California climate targets. We analyze PHEVs and BEVs together, similar to many studies in the literature2,5,7,8,9, because both fuel types can plug in to electricity to refuel, which necessitates/promotes behavioral changes and because in California (the region of study) PHEVs are permitted as part of the 100% ZEV regulation. First, we identify differences in PEV adopters based on their vehicle needs. We use several observable characteristics as a proxy for measuring vehicle needs: revealed household vehicle fleet preferences (e.g., number of vehicles and vehicle body type), land use characteristics (e.g., rural or urban), and sociodemographic attributes (e.g., income and age). This diverges from the existing body of literature which focuses on heterogeneity in stated preference or examines sociodemographic and psychographic characteristics. Vehicle fleet and land use preferences must be considered when modeling future adoption because they significantly influence the purchase decision of vehicles10,11,12. Second, we estimate adoption trajectories for different clusters of the population using a Diffusion of Innovations (DOI) approach13. This allows us to estimate adoption rates for each cluster while allowing for heterogeneity in early adopters. Finally, this study estimates what adoption rates are needed to meet climate goals such as (1) ACCII targets and (2) carbon neutrality by 2045. Both scenarios forecast a future in which California ultimately achieves full PEV adoption but differ by whether the models meet specific targets in 2035 (adoption due to 100% ZEV sales) or 2045 (near full adoption) respectively. While our study provides insights into PEV adopters, we focus only on the initial PEV acquisition and not subsequent additional or replacement purchases. Parameterizing variation within PEV adopters is crucial for policymakers to design tailored incentives and identify specific obstacles faced by distinct groups.
We examine PEV adopters, performing cluster analysis to identify classes and then modeling each class’s rate of PEV adoption. Latent class analysis using revealed vehicle fleet, land use, and sociodemographic characteristics is used for clustering and Bass diffusion models are fit to each cluster to determine adoption rates. One of the reasons Bass models are suited for this analysis is because these models asymptotically approach 100% adoption, and we model full vehicle adoption, the scenario in which all vehicle-owning Californians adopt an electric vehicle. Both the clustering and diffusion models are calibrated on empirical data of actual adopters, repeated cross-sectional surveys of PEV adopters over the period from 2012 to early 2020. We estimate separate diffusion models for each cluster detected, finding each is at different points in its diffusion trajectory.
Literature review
Context
Governments worldwide aim to increase PEV sales to promote transportation decarbonization, with several aiming for a full transition to the new technology. Many countries target 100% of light-duty vehicle (LDV) sales to be PEVs or other types of ZEVs by a specific year, either through announced government targets or formal proposals14. Certain US states have gone even further by turning targets into supply-side regulation: Advanced Clean Cars II (ACCII). ACCII regulates that 100% of new vehicle sales by 2035 must be ZEVs or PEVs, which includes fully-electric BEVs and partially-electric PHEVs, in California and other US states that have adopted the rule under Section 177 of the Clean Air Act15,16. California is progressing towards this goal with ZEVs (PEVs) comprising 25% (24.8%) of new LDV sales in 20231. The state is making further strides towards decarbonization with a statewide goal to achieve carbon neutrality by 2045 across all sectors, including transportation17. The recent policies coupled with the popularity of PEVs makes it feasible that California will be a template many regions can follow to reach full PEV adoption in the coming decades.
With the rise of vehicle mandates has come a focus on equity implications. Existing literature finds early PEV adoption has been inequitable thus far. Several studies use neighborhood-aggregated data to find lower PEV ownership and rebates in neighborhoods with lower-incomes or higher environmental burdens8,18. Hennesy and Syal18 find that ZIP codes with Latino-majorities and formerly redlined neighborhoods have lower PEV ownership and California Clean Vehicle Rebate Program (CVRP) rebate amounts. Redlining was a past discriminatory lending practice in the US that resulted in racially and economically segregated neighborhoods that largely persist to this day. Guo and Kontou8 utilize Lorenz curves to find a low proportion of the CVRP rebate goes to census tracts with lower median incomes, lower PEV ownership, and higher environmental burdens and with rebates spatially concentrated in metropolitan regions. These neighborhoods with high environmental burdens, or disadvantaged communities as per CalEnviroScreen19, are areas most affected by many sources of pollution (such as air and water), with populations that are especially vulnerable to this pollution. They also find inequality has lessened over time, with Gini coefficients lowering between 2010–2018. Canepa et al. 20 investigate individual-level PEV adoption data in disadvantaged communities (DACs) in California. They find that PEV adoption is much lower in DACs than non-DACs but even PEV adopters in DACs do not reflect the sociodemographic characteristics of their neighbors. Sovacool et al. 21 also list demographic and spatial inequity as issues with PEV diffusion.
Modeling PEV adoption in the entire population is vital to ensure future adoption progresses more equitably than early adoption. We propose using clustering techniques to identify classes within PEV adopters and subsequently match these classes to the general population. We hypothesize there are minority segments within PEV adopters that comprise large portions of the general population. Clustering allows identification of minority classes, which can be overlooked in more aggregated PEV adoption studies. We then fit Bass diffusion models to each cluster, assuming within each cluster there are “innovators,” “majority adopters” and “laggards”—or those who adopt the technology earlier and those who adopt later13.
PEV adopter heterogeneity
Researchers have sought to identify potential early PEV adopters since the resurgence of the technology. Several studies examined heterogeneity within the general or potential PEV buyer population by focusing on psychographics and stated preference data22,23,24. These studies identify groups that may be receptive to PEVs by using attitudes and preferences22,24 and sociodemographic characteristics23. They use attitudes towards technology, vehicles, environment, or other psychographics to identify segments likely to adopt PEVs sooner and later, analogous to Rogers’ “innovators” and “laggards”13 but using more attitudes than just “innovativeness”.
With rapid adoption of PEVs, research has shifted to investigate current PEV adopters. Studies examining revealed preference heterogeneity among PEV owners interview small samples of PEV owners or focus on psychographics, discerning that early PEV adopters fall into different lifestyles categories25 or are motivated by different specific factors26. Axsen et al. 25 use semi-structured interviews to identify four lifestyle classes of the 17 Canadian PEV owners they survey with different levels of engagement with technology and the environment. They find two groups with lower technology-engagement and two with lower environment-engagement, challenging the assumption of homogeneity within early PEV buyers. Wei et al. 26 conduct a factor analysis on a survey of PEV adopters and potential consumers in China. They find six relevant factors promote PEV adoption, one of which is “herd mentality.”
There are many attitudes, preferences, and other factors that influence whether PEVs meet the needs of consumers and are important when considering equity in PEV adoption but are difficult to measure in large samples of actual adopters. Fortunately, current revealed data on household vehicle fleets can act as a proxy for capturing these intangible factors. The number of vehicles in a household is one such example. Studies have shown households with PEVs and additional vehicles can meet their travel needs27,28,29,30,31. Similarly, preferences for different vehicle body types influence preferences for fuel types10,11. The literature finds distinct trends for consumers who prefer pickup trucks or light-duty trucks such as Ford F-150 vehicles, hereafter called “trucks.” Higgins et al. 10 find that truck buyers may have the highest disutilities for PEVs. Mohammad et al. 11 find body type preferences correlate with different attitudes; e.g., they find truck buyers are the least likely to purchase but have favorable views of PEVs. This gap could be due to PEVs failing to meet this segment's’ vehicle needs. Additionally, research shows household location, i.e., rural or urban, is critical to vehicle choice12. Overall, preference for different vehicle body types and number of vehicles is clearly correlated with factors that would determine whether a PEV can meet the needs of individual households.
To model population-wide PEV diffusion, we use revealed household fleet data, along with sociodemographic and locational data, as a proxy for household vehicle needs and attitudes which are difficult to measure in large samples. To anticipate inequitable diffusion, we consider heterogeneity in the data: sociodemographic factors such as income, locational factors such as housing type and urban/rural status, and vehicle needs & usage such as number of vehicles and vehicle body type. This work builds upon studies of heterogeneity in sociodemographics and the purchase decisions of PEV adopters. Hardman et al. 32 separate PEV buyers into high- and low-end buyers, finding the former are older, wealthier, and more educated. Lee et al. 33 classify early PEV adopters in California, finding five main groups. This study employs similar methods as Lee et al. 33 but makes several advancements. First, the household vehicle needs are considered by including households’ current vehicle fleet characteristics in the clustering model. Second, PEV characteristics are not used to segment adopters but are studied empirically after clustering. Finally, and most significantly, this work compares adoption rates to current policy through a scenario analysis, a task not undertaken by previous work.
PEV Diffusion
Forecasting future PEV adoption is a key question for researchers. Bass modeling, a common technique in diffusion modeling, produces S-shaped cumulative adoption curves34. These curves align with Rogers’ Diffusion of Innovation (DOI) theory, where “innovators” and “early adopters” adopt first, and “laggards” adopt last13. Bass diffusion is one of the most popular formulations of Rogers’ DOI and forms the basis for many PEV adoption studies35,36,37,38.
There are criticisms of Bass diffusion modeling. The formulation relies on two assumptions not necessarily always true: a symmetrical pattern of adoption between early and late adopters and only two types of diffusion communication channels, mass media and interpersonal channels13. While modeling several consumer goods well, the Bass formulation may not technically be the best fit for California PEV adoption. Indeed, Kumar et al. 39 find that other S-shaped models such as Logistic, Gompertz, Generalized Bass may better fit the adoption pattern of PEVs in different countries.
In this study, we use Bass models to simulate diffusion within clusters identified from early adopters of PEVs. The marketing literature is clear; there is no strong evidence that a specific diffusion model consistently outperforms other diffusion models40. Researchers studying diffusion across various technologies and regions come to conflicting conclusions about whether Bass, Logistic and Gompertz models outperform each other40,41,42,43. Given that PEV adoption is nascent in most countries and regions, there is no guarantee that the models identified by Kumar et al. 39 will continue to have the best predictive power with more available data.
We opt to use Bass models for several reasons. First, this model has been extensively investigated and shown to have good predictive power for several technologies such as color televisions, durable goods, the Internet, mobile phones, and online shopping35,36,37,38,40,44,45. Second, studies argue that it predicts diffusion well even without marketing variables such as pricing and advertising40,46,47. Studies that account for market variables may use models such as the Generalized Bass model, but this is unnecessary for our analysis as we specifically aim to estimate diffusion trajectories in the absence of additional market factors. Third, it allows for differing earlier and later diffusion rates while remaining symmetric. In contrast, the Logistic model estimates a single diffusion rate and the Gompertz model has asymmetric diffusion, in which later diffusion is slowed compared to earlier diffusion. PEV adoption is nascent, and it is too early to predict whether later diffusion will be asymmetrically slower than early diffusion. Since we aim to compare scenarios, the symmetric Bass model allows us to estimate differences between scenarios.
Furthermore, S-shaped adoption patterns are appropriate to use because Rogers assumes that 100% of a population adopts a new technology and Californian regulation aims to ensure this is the case15,17. As ZEVs, specifically the subset of PEVs, take over the new car market, they will subsequently filter into the used car market. While PEVs have depreciated at higher rates than ICEVs, this trend is shifting quickly, with newer model years and larger-range vehicles retaining significantly more value48. It is too early to understand how this might affect the used PEV market, how depreciation may change in a few more years, or how quickly PEVs may enter the used market. Yet it is clear that there is already a used PEV market, it is growing, and there are policies to encourage this market such as the Federal Used Clean Vehicle Credit. This study envisions future scenarios in which consumer enthusiasm, policy, electrification of new vehicle sales, and transformation of the used vehicle market is adequate to guarantee full PEV adoption. While it is not definitive that PEVs will be the dominant ZEV technology, currently their market offerings outpace their competitors. Furthermore, recent legislation is ensuring substantial investments will be made in PEV charging infrastructure, further incentivizing PEV adoption.
Methods and data
The methods and data utilized in this paper are outlined in Fig. 1; main methods are highlighted in green, final outputs are highlighted in orange, and original datasets are underlined. First, we identify clusters within a survey of PEV adopters using latent class clustering (LCC). Next, we generalize adoption to the total population using two steps. We determine cluster membership within the population through scoring; we use cluster membership models to determine probabilities households belong to a cluster and the total size of each cluster in the general population. We also determine to-date adoption within clusters through weighting the original PEV adopter survey. Finally, we create future scenarios using the outputs of the previous two processes. We create three scenarios using Bass diffusion. The first scenario models current growth while the second scenario simulates a “net zero” future in which all clusters near full adoption by 2045. Finally, we construct a third scenario in which adoption in all clusters is constrained by the PEVs available in 2035. This final scenario relies on ACCII regulated sales targets and household vehicle data from the general population, using the National Household Travel Survey California Add-On (CA-NHTS). Our methodology is designed to mirror the current market adopters, who are predominantly influenced by consumer preferences, and to facilitate a scenario of transition to full adoption. This reflects a supply-regulated market where only Plug-in Electric Vehicles (PEVs) will be offered for sale after 2035 regardless of current consumer preference.

Inputs, intermediates, and outputs of different methods used in the analysis. Main methods are highlighted in green, final outputs are highlighted in orange, and original datasets are underlined.
Characterizing PEV adopters
The first step utilizes latent class clustering (LCC) to characterize heterogeneity within PEV adopters. Of the various clustering algorithms available, LCC was chosen because of its ability to handle different variable scales, including ordinal, nominal, and count scales, and incorporate probability distributions of variables when clustering. LCC is widely used as a method of “extracting meaningful groups” from data49 and has been used in a variety of transportation applications50,51,52.
We utilize data from multiple questionnaire surveys created by the Electric Vehicle Research Center at the University of California, Davis. The surveys were distributed between 2015–2020 and collected data from Californian households with recent PEV purchases made between 2012-early 2020. The California Air Resources Board assisted in survey recruitment by inviting California Clean Vehicle Rebate (CVRP) applicants to participate. The CVRP was a key driver of PEV adoption in California in this period and about three-quarters of PEV buyers participated in the program53. After filtering for insufficient sociodemographic data, 18,921 respondent households were identified as first-time adopters and used for clustering. In this sample, 2,896 belonged to a household with a single vehicle and 16,025 belonged to a household with multiple vehicles. Table 1 summarizes the survey data characteristics and more detailed information can be found in the report prepared by Tal et al. 54.
There are two sources of selection bias when we attempt to represent the population of PEV adopters using this survey. First, survey respondents may not accurately represent the population of CVRP applicants. Second, CVRP applicants may not accurately represent the population of PEV adopters. These biases may be further exacerbated by changing CVRP requirements over time. Income caps were instituted by the program and disqualified high-income PEV buyers from receiving a rebate starting in 201655. Consequently, high-income adopters may be underrepresented in our survey. Indeed, Guo and Kontou8 find that the share of CVRP rebates distributed to low-income groups and disadvantaged communities has increased over time, especially after the institution of income caps.
However, oversampling lower-income adopters may be a benefit for clustering, as it handles the problem of imbalanced classes. It is well known that early PEV adopters have been disproportionately higher-income households5,33, thus clusters with lower-income households are likely much smaller in size than those with higher-income households. This is an issue of imbalanced classes, where some “minority” classes have much lower populations than “majority” classes. In classification tasks with imbalanced data, there are a variety of methods to oversample minority classes56. Similarly in social surveys, various methods are used to oversample rare populations57.The income caps instituted by the CVRP program serve to oversample low-income households, and this increases the likelihood that we identify minority classes through clustering. While this is still an issue when attempting to represent the entire population of PEV owners, we present a method for overcoming this limitation in the following section.
We use household fleet and land use characteristics in addition to sociodemographic data to characterize different types of households. First, survey respondents are grouped by number of vehicles into single- and multi-vehicle households. We do this because single and multi-vehicle households play different roles in the vehicle market and will have a different impact on PEV diffusion, because single-vehicle households are sometimes overlooked, and because they may need different policy support to adopt PEVs. We chose to separate single- from multi-vehicle households, and not use any other grouping, because this isolates households that fully convert to PEVs. We hypothesize that households with two, three, or more vehicles will have similar behaviors when adopting their first PEV as they have backup ICEVs.
Second, we determine adopter clusters across the entire dataset using sociodemographic, land use, and fleet characteristics. Sociodemographic variables include household income, age, gender, education, number of drivers, household size, housing type & tenure, and land use classification. Respondent data are used for individual-level variables (age, gender, & education). Land use is modified from Salon et al. 58 and simplifies the original five categories by grouping the two lowest- and two highest-density categories, creating rural, suburban, and urban levels. Household fleet data are examined for multi-vehicle households including number of vehicles, average fleet age, presence of trucks, presence of SUVs/vans. Fleet data is restricted to multi-vehicle households because the survey is a convenience sample of PEV buyers and there has been limited PEV body type availability. Home charging infrastructure is excluded as a clustering variable because it is endogenous to the decision to purchase a PEV, but the included housing variables, such as housing type, tenure and land use, are good predictors of home charging access as Ge et al. note59.
A LCC model without covariates is summarized by Eq. (1) below, where \(x\) is a single nominal latent variable with \(K\) categories, \({y}_{{it}}\) is the response variable \(i\) for individual \(t\), and \(T\) is the total number of individuals. In this analysis, \({y}_{{it}}\) is a household’s sociodemographic or fleet characteristics and \(k\) is the class membership. The conditional probability density for \({y}_{{it}}\) given condition of the membership \(x\) is \(f\left({y}_{{it}}{|x}\right)\).
The Expectation-Maximization (EM) and the Newton-Raphson (NR) algorithms are used to estimate the LCC models. Both algorithms are iterative, maximum-likelihood approaches that are given a set of starting values and estimate parameters stepwise until a given criteria is satisfied. The EM algorithm is used until the change in likelihood is lower than a set criterion, then the NR algorithm is used to reach the set limit of convergence. While stable, both algorithms are sensitive to local maxima of the likelihood functions. To address this issue, multiple models with different sets of parameters starting values are tested. Another issue occurs when the number of parameters is greatly increased, usually by increasing the number of classes. When this occurs, it may be difficult to achieve both model identification and convergence. The following approach is used to avoid this issue and select the appropriate number of classes for the model. First, the model is estimated sequentially with an increasing number of latent classes, starting with one class and ending when the model is impossible to interpret, and classes become too small. Then, the ideal number of classes is chosen based on several probabilistic statistical measures including Bayesian Information Criterion (BIC) and Akaike Information Criterion (AIC), considering the marginal improvement of model fit between successive models. The number of clusters is chosen when model fit measures cease to decrease significantly60,61.
The final latent class membership model estimates coefficients \(\beta\) which determine the probability of respondent \(t\) belonging to class \(k\) given response variables \(i\). Equations (2) and (3) summarize the probability \(P(t\in k)\) for a model with \(K\) classes.
Generalizing to the total population
We generalize to the general Californian population using two techniques: a scoring process to match PEV adopter classes to the general population and a weighting process to determine the share of PEV sales, and thus cumulative adoption, attributed to each cluster.
We match PEV adopter clusters to the general population to project full diffusion. To represent the state’s population, we use the 2017 National Household Travel Survey California Add-On (CA-NHTS)62, which details travel behavior and sociodemographic data for 26,095 California households with appropriate weights. Additional data on housing type was imputed from the 2015–2019 American Communities Survey63.
To determine the cumulative adoption in each cluster, we apply a weighting process using the PEV adopter survey, PEV sales data, and LCC membership models similar to weighting done by Jenn et al. 9. As stated in the previous section, there are two sources of selection bias when attempting to represent the entire population of PEV adopters using the PEV adopter survey. To account for these biases, we weight the PEV adopter survey using PEV sales data from the California Energy Commission’s New ZEV Sales data1 which are derived from analysis of the state’s DMV data. This dataset contains the total PEV sales by make and fuel type by year in California and allows us to generalize the survey to the population of adopters and then to clusters. We calculate weights to represent the share of total annual PEV sales each respondent represents, then use respondents’ cluster membership probabilities to determine the total annual PEV sales by cluster.
Latent class cluster (LCC) membership models, Eqs. (2) and (3), are applied to each household in the general population, using the CA-NHTS as a representative population. The LCC membership models determine the probability a household belongs to each of the clusters. Cluster membership models were developed separately for single- and multi-vehicle households. Applying LCC models to this population allows us to determine the total size of each cluster in the general population, i.e., how many households in California fit into the eight clusters developed in the first section of this analysis.
Weighting is needed to estimate the cumulative PEV adoption by cluster across the entire California population, as there are certain limitations with the PEV adopter survey data. This step ensures that model results are more representative of the population of PEV adopters. Survey respondents are given weights based on the annual sales of the make and fuel type (either BEV or PHEV) of the PEV they purchased. The weight for a respondent who purchased a vehicle of make \(m\) and fuel type \(f\) in year \(y\) is given by dividing the total vehicles sold in the state by the number of vehicles in the survey of make \(m\) and fuel type \(f\) in year \(y\), Eq. (4). To determine adoption by cluster \(k\) each year, the household weight of each respondent \(i\) is multiplied with the probability \({p}_{k,i}\), the probability that respondent \(i\) belongs to cluster \(k\), and is summed across all respondents in the sample of first-time adopters \(S\), Eq. (5). The entire process is summarized in the equations below. We aggregate sales to make and fuel type because there is not enough data to weight by model or location as well. Sales information is gathered from the California Energy Commission’s New ZEV Sales data1.
Creating future scenarios
We construct three diffusion scenarios to illustrate the rate of PEV adoption in California until 2050: business-as-usual “BAU”, “Net Zero”, and “ACCII Targets” scenarios.
All three scenarios are modeled using past adoption data by cluster but the second and third scenarios include additional constraints. The BAU scenario only considers past rates of PEV adoption. The “Net Zero” scenario, informed by California’s net zero targets, includes specific adoption rates in 2045 as constraints to the cluster diffusion models. In contrast, the “ACCII Targets” scenario utilizes past adoption data but includes additional constraints for 2035. By using Advanced Clean Cars II vehicle sales targets and vehicle age data from households by cluster, we calculate the expected adoption in each cluster by 2035 and include them as constraints.
All three scenarios are created with Bass diffusion models and detailed descriptions of each scenario are given in the following sections. An overview of the data sources for each scenario is summarized in Table 2.
Bass models are fit using past PEV adoption by cluster developed through the weighting process along with the total size of each cluster. The fraction of each cluster that has adopted PEVs is calculated by dividing cumulative adoption for each cluster by the total size of each cluster and is computed for years between 2012 and 2019 (data from 2020 is excluded as it does not cover the entire year). Finally, we construct two Bass diffusion scenarios: one business-as-usual “BAU” case and a “Net Zero” case. Both cases fit past cumulative adoption fractions, but the Net Zero case also fits Bass curves to a pre-determined endpoint in 2045. As California is committed to carbon neutrality by 2045, we construct the scenario in which 98% of households adopt at least one PEV by 2045. Bass diffusion curves are estimated separately for each cluster and scenario, creating a total of 16 adoption trajectories. Equation (6) summarizes the Bass formulation, where \(F\left(t\right)\) is the cumulative fraction of households that have adopted the new technology by time \(t\). Adoption depends on two parameters, \(p\) and \(q\), which govern the rate of earlier and later adoption, respectively.
We construct a third scenario in which adoption in 2035 is constrained by the availability of PEVs given ACCII sales regulations. We estimate the expected value of adoption in 2035 among the eight clusters using sales targets and vehicle age data by cluster, gathered from the CA-NHTS. Then, a third set of cluster Bass diffusion models are estimated using this 2035 value along with past PEV adoption data.
First, assuming the ages of vehicles in household fleets are similar to the CA-NHTS, we calculate the probability of household PEV adoption in 2035. We assume that the probability that a specific vehicle in a household fleet is a PEV is given by Eq. (7), the fraction of PEVs in a specific model year, which is taken from ACCII targets. Furthermore, we assume that the probability of adoption is the probability at least one of a household’s vehicles is a PEV. If the number of vehicles in a household is \(v\) and adoption only occurs among the three newest vehicles in a household, vehicles \(a\), \(b\), or \(c\), the probability of adoption is given by Eq. (8) where \(A\), \(B\), and \(C\) are the events that vehicles \(a\), \(b\), or \(c\) are PEVs respectively.
Where
In this calculation, we make the additional assumption that \(A\), \(B\), and \(C\) are independent events, thus the joint probability of events occurring is given by multiplying the probabilities of the individual events, e.g., \(P\left(A\cap B\right)=P\left(A\right)P\left(B\right)\).
The expected value of adoption for cluster \(k\) is given by Eq. (9), where \({w}_{i}\) is the reported weight of respondent \(i\) in the CA-NHTS, \({p}_{k,i}\) is the previously calculated probability of respondent \(i\) belonging to cluster \(k\), and \({p}_{{adoption},i}\) is calculated by Eq. (8).
This calculation also makes the following assumptions: (1) ACCII ZEV targets will be equivalent to the percentage of PEVs sold in particular year or alternatively, the fraction of FCEVs is negligible; (2) vehicles do not flow into or out of California; (3) vehicle lifespan and scrappage is similar between ICEVs and PEVs;
We construct estimates for \(P\left({PEV|model\; year\; y}\right)\), plotted in Fig. 2, using the following sources. From 2019–2022 we use historical market share data from the California Energy Commission1. From 2026–2035, we use ACCII regulated market shares15. Finally, data is interpolated for the intermediate years, 2023–2025, while a probability of 1% is assumed for all years prior to 2019.
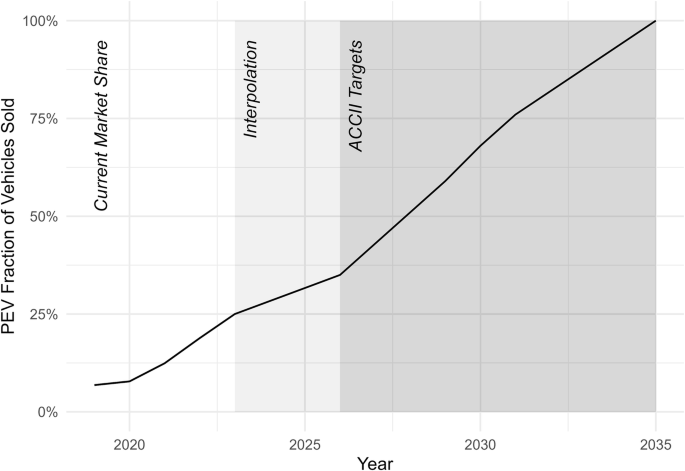
Probability a specific vehicle in a household fleet is a PEV by model year, P(PEV|model year y).
Results
Characterizing PEV adopters
Two sets of latent class cluster models were estimated testing 1–8 cluster assumptions (LatentGold version 5.0, 2016), one set each for single- and multi-vehicle households. Models with four clusters were selected for further analysis based on interpretability and model fit measure marginal improvements (BIC, AIC, AIC-3), which are summarized in Supplementary Table 1. These clusters, whose relative sizes and names are depicted in Fig. 3, were the best at capturing the heterogeneity among PEV adopters and model fit measures did not significantly improve after four clusters. Models with cluster assumptions five and greater resulted in similar clusters which diminished interpretability.

Eight adopter clusters from latent class clustering: 4 single-vehicle and 4 multi-vehicle clusters.
The single-vehicle household clusters differ significantly from typical early adopters, who tend to be high-income, male, highly educated, and homeowners, as Table 1 indicates. Two clusters consist of lower-income households with a higher proportion of female adopters. Another two clusters include a high number of renters and occupants of multi-unit dwellings (MUDs). The survey respondent, who is the main driver of the PEV, determines individual-level variables such as gender. Vehicle fleet characteristics are not included because all households have a single PEV, predominantly sedans. “Lower-income” indicates that the cluster average income is much lower than the survey average. All four clusters generally have fewer household members and drivers. Table 3 provides the averages of all variables for each cluster.
-
Lower-Income Old Families (27.1%): This cluster consists of lower-income, older homeowners, with over half the households having a female primary PEV user.
-
Lower-Income Young Renters (26.2%): These households are younger, more often renters, urban dwellers, and about 41% female.
-
High-Income Families (24.8%): Comprising higher-income, highly educated homeowners who mostly identify as male, this group most closely resembles the typical PEV adopter.
-
Mid/High-Income Young Urban Renters (21.9%): These households are younger, urban, often living in MUDs, with mid to high incomes, and a higher proportion of males.
Multi-vehicle households make up a large portion of the population, 63% in California63, and these clusters exhibit higher incomes, larger household sizes, more drivers, and a higher proportion of males compared to single-vehicle households. The clusters identified include one large cluster and three smaller ones. Table 4 details the averages of all variables for each cluster.
-
High-Income SUV Families (41.6%): This largest cluster comprises high-income, middle-aged suburban homeowners with large households. They typically own newer ICE SUVs, with two to three vehicles in total.
-
Middle-Income Young Renters (22.3%): These younger, middle-income households have smaller fleets, the lowest incomes among multi-vehicle PEV households, and are more likely to be urban renters or MUD residents.
-
Mid/High-Income Old Families (20.0%): This group consists of older families with mid to high incomes, high rates of home ownership, and slightly older vehicle fleets similar in size to the first cluster.
-
Mid/High-Income Rural Truck Families (16.1%): Predominantly mid/high-income rural households, they have the highest rates of detached home ownership and the largest household fleet sizes, often owning older ICE trucks.
The eight clusters span many types of households and are named based on prominent characteristics in relation to other clusters. Figure 4 depicts how these groups qualitatively compare for various variables including income, land use, housing type, and age. We find two lower-income clusters, multiple young renter clusters, one extremely rural cluster, and one extremely urban cluster. While all households are assigned to clusters, some household types have low representation among all the clusters. Examples include older renters, middle-aged lower-income households, and lower-income urban and rural households.

Comparing average adopter characteristics across various pairs of variables for all eight clusters.
We also examine the characteristics of adopted PEVs between different clusters, looking at body type and luxury status. Most PEVs purchased were sedans with only 4.7% of the sample purchasing SUVs and minivans. The second multi-vehicle cluster Middle-Income Young Renters had the lowest percentage of PEV SUVs/minivans at 2.1% while the third single-vehicle cluster High-Income Families had the highest percentage with 6.3% of households owning PEV SUVs/minivans. We also examine the proportion of luxury vehicles by using Tesla Model X and Model S vehicles as a proxy, as they were the most purchased, most expensive PEVs in the dataset. Across all clusters, 11.3% of households chose these vehicles, with the highest cluster at 16% (multi-vehicle Mid/High-Income Old Families) and lowest at 3.2% (single-vehicle Lower-Income Young Renters).
Adoption rates and future scenarios
The next step was determining how Californian households fit into these cluster definitions. Using the CA-NHTS, we developed a representative household population and applied latent class scoring formulas to assess each household’s likelihood of belonging to each cluster. We calculated the total population for each cluster, using separate scoring models for single- and multi-vehicle households, without considering households moving between these groups. While clusters may not represent all households precisely, such as older families in MUDs, we calculate the household probability of belonging to a cluster and the expected value for the total size of each cluster. Table 5 summarizes the averages of various characteristics across the eight clusters in the PEV sample compared to the overall population. We observe that same-cluster averages between the population and PEV sample are similar for most variables except income and housing type, likely because PEV adopters are disproportionately high-income homeowners. However, differences between clusters were consistent between the two samples.
We weigh the survey by annual PEV sales in California to determine cumulative adoption by cluster then fit Bass diffusion curves to each cluster to demonstrate future adoption paths. Figure 5 depicts the cumulative adoption as points and the business-as-usual (BAU) Bass model fit. Full Bass parameters are summarized in Supplementary Table 2.

Cumulative household PEV adoption by cluster in the BAU scenario by percent of cluster before 2020 (top) and total number of households through 2055 (bottom). PEV sales attributed to each cluster is depicted by points in the top image.
The cumulative adoption estimates by cluster reveal two key trends. First, the clusters with the lowest rates of adoption comprise a large portion of the population. Three clusters fall into this category: multi-vehicle Mid/High-Income Rural Truck Families (20.5% of California’s population), single-vehicle Lower-Income Old Families (14.3% of California’s population), and single-vehicle Lower-Income Young Renters (12.4% of California’s population). These clusters, each with <3% cumulative adoption in 2019, account for almost half of the population but comprise very different households. The latter two clusters are composed of single-vehicle households with lower incomes, small household sizes, and fewer drivers while the first cluster is composed of multi-vehicle households with higher incomes, large household sizes, and many drivers. Counterintuitively, the first two clusters have high rates of home ownership of both detached and attached single-family homes. This result highlights that adoption is slow in segments of the population despite high home ownership rates, which usually signifies access to home charging or ability to install home chargers. Factors other than home charging access could be limiting PEV diffusion in these segments such as lack of knowledge or negative sentiment towards PEVs or the unaffordability of PEVs and home charging infrastructure. Second, the clusters with the highest rates of adoption comprise a small fraction of the population. The single-vehicle High-Income Families and multi-vehicle High-Income SUV Families are 2% and 12% of the population respectively but had between 7–10% cumulative adoption in 2019. Both clusters comprise households with similar high incomes, high education levels, and high levels of homeownership who live in mostly suburban areas, but differ on number of vehicles, household size, and number of drivers.
California has targets for carbon neutrality by 2045 and regulation that will ensure all new vehicles sold in the state will be zero-emission by 2035. Because of that, we construct two further scenarios: a “Net Zero” scenario in which all clusters reach 98% first-time PEV adoption by 2045 and an “ACCII Targets” scenario in which cluster adoption is constrained by PEV availability to 2035 due to ACCII ZEV sales targets. The “ACCII Targets” scenario directly uses vehicle ages within clusters to determine the expected adoption in each cluster. Figure 6 summarizes the total and percent adoption across all three scenarios in 2035 and 2045. Supplementary Table 2 summarizes the Bass coefficients for all three scenarios.

Adoption in percent (top) and total households (bottom) for the BAU, Net Zero, and ACCII Targets scenarios in 2035 and 2045. Adoption is the probability a household owns at least one PEV.
In certain clusters, lower adoption in “ACCII Targets” than other scenarios suggests full adoption will be slowed due to a lack of older PEV availability. Households in these clusters currently own older vehicles, but there will not be enough older PEVs to support higher adoption rates such as those needed for the “BAU” or “Net Zero” scenarios if they keep similarly aged vehicles. If more households wish to adopt, they must acquire newer PEVs than they typically would or obtain older PEVs from outside the state. This situation is particularly extreme for the second single-vehicle cluster, Lower-Income Young Renters, where nearly 70% of households need or may want to adopt PEVs but only 40% may be able to in 2035 (“BAU”/“Net Zero” vs. “ACCII Targets”).
In certain other clusters, “BAU” adoption is the lowest, implying full adoption could be slow without interventions to meet net zero or ACCII targets. Households in these clusters own more, newer vehicles on average and there are sufficient PEVs under ACCII to support high adoption rates, but they are not on track to reach these numbers. Moreover, the current adoption trajectory estimates only a small fraction of households will adopt relative to what is needed for 2045 targets. This scenario is especially apparent in the fourth multi-vehicle cluster, Mid/High-Income Rural Truck Families, in which two-thirds of households could adopt but only roughly a quarter would (“ACCII Targets” vs. “BAU”). If fewer households wish to adopt, PEVs will likely collect in in these households. Probabilistically, this suggests the assumption of independence between vehicles is incorrect, e.g., if you own a PEV, you are more likely to own more PEVs and vice versa. Non-adopter households would acquire ICEVs older than they typically would or obtain newer ICEVs from outside the state.
Discussion
Decarbonization will likely require full LDV electrification in the coming decades. Rather than viewing early EV adopters as a monolith, we examine them as the first adopters across various segments within the broader population to gain valuable insights. We highlight heterogeneity in current PEV adopters to show how full PEV adoption may progress in the entire population. This study answers several questions related to PEV adoption in California. First, it examines current adoption in California, identifying several clusters that diverge from archetypal early PEV adopters. Second, it calculates rates of adoption within each cluster, finding several large clusters with low-to-date adoption. Finally, this study constructs three scenarios for future PEV adoption in the state, comparing current adoption trends, net zero decarbonization targets, and targets for new vehicle sales.
We utilize repeated cross-sectional surveys of PEV owners in California to examine heterogeneity in PEV adopters, grouping PEV adopter households into eight clusters using latent class analysis: four single- and four multi-vehicle groups. Using Bass diffusion models, we parameterize the rate of adoption within each cluster under various circumstances. This analysis is unique in that we utilize heterogeneity within a large sample of PEV adopters to develop full adoption scenarios for the entire population of California. We make this analysis even more useful by examining single-vehicle households separately from multi-vehicle ones and examining sociodemographic, land use, and household fleet information.
Clustering adopters reveals groups of PEV users who significantly differ from typical early adopters. We find multiple clusters that are lower-income, rural, or live in apartments—a larger range of clusters than are found by Lee et al. 33. This is especially relevant in the context of equity; earlier studies found that even when earlier PEV adopters were from disadvantaged communities, they tended to be more affluent and nonrepresentative members of their neighborhoods20. While classes derived from PEV adopters do not perfectly represent every Californian household, they provide a useful starting point for exploring the state’s transition to electrifying all households. We find that the corresponding population clusters have much lower incomes than the PEV clusters, yet relative differences between clusters for income, age, housing type, and land use remain consistent
While our cluster analysis implies that a wider portion of the population has access to PEVs, we also find that rates of adoption are low among several groups. Three clusters encompass 47% of the population but comprise households with varying levels of vehicle ownership, home ownership, and income among other differences. Policymakers will need to consider the specific needs of these households when developing incentives, infrastructure, and other policy interventions to help these households adopt PEVs.
The scenario analysis finds that there is misalignment between adoption in some clusters and adoption matching California sales targets and/or net zero goals.
First, some single-vehicle clusters may be hindered from adopting PEVs due to a shortage of older PEVs (>25% of Californian households). Currently, many of these households possess older conventional vehicles, either purchased new or used. By 2035, there may not be enough older PEVs for these households even if they wish to electrify. Households may keep older conventional vehicles, acquire newer PEVs than they typically would, obtain older PEVs from out-of-state, or reduce car ownership. If households choose the first option, full adoption will be pushed later.
Second, some multi-vehicle clusters have adoption rates slower than is needed to meet ACCII or net zero goals. These households tend to have newer vehicles and there will likely be enough newer PEVs to keep these households on track for 2045 adoption goals. However, they have business-as-usual adoption rates that are not sufficient to meet net zero or ACCII targets, signaling additional support may be needed to encourage adoption. If they continue to lag, available PEVs may cluster in the relatively few households eager to adopt, leading to these families purchasing their second, third, or even fourth PEV while many other households hold on to ICEVs or search to buy new ICEVs elsewhere. This study focuses on adoption of the first PEV in a household, but it may be the case that the bulk of new PEV sales end up clustered in multi-PEV households.
There are certain limitations with this study. First, the model assumes unchanging vehicle ownership patterns and stable clusters, not allowing for households to move between clusters overtime. For example, it allows households to convert vehicles to PEVs but does not consider households adding or reducing vehicles over time. Thus, this model does not allow households to move between single- and multi-vehicle clusters. The number of vehicles and households is also kept constant over time to see the effects of PEV diffusion within the population. However, both the population of households and vehicles will invariably change over time in California and have additional effects on PEV diffusion. The effects of increasing or decreasing vehicle fleets or population is outside the scope of this project but is an interesting area for future study.
Similarly, this study also does not examine discontinuance in PEV ownership. While it is suitable to model PEV adoption using Bass models since California regulation aims for full adoption, discontinuance is still an issue in the short-term64. Another limitation is that this study examines PEV owners over a period when limited vehicle body types were available on the PEV market. As new PEV trucks and SUVs enter the market, adoption could change course radically, especially in clusters with high rates of truck and SUV ownership.
This study also does not consider market forces, which could change PEV diffusion. Bass diffusion assumes symmetric diffusion between early and late adopters with only two types of diffusion communication channels: mass media and interpersonal channels13. However, resistance to PEVs, a diminished second-hand market due to continued higher depreciation rates48 or other factors could further slow PEV adoption in later years, creating the need for an asymmetric diffusion model such as the Gompertz model. On the other hand, factors could accelerate PEV diffusion, as is the case in Norway and China, two of the world’s leading PEV markets. In Norway, incentives ensuring PEV price parity, greater model selection, reduced vehicle prices, and extensive marketing have worked to hasten adoption65. PEV adoption has been similarly increased in China through a combination of financial and preferential polices66,67.
Finally, this study is limited by the biases in the dataset. First, higher-income PEV adopters are likely underrepresented in the data. This bias likely translates to underestimating diffusion rates for higher-income clusters, meaning that certain clusters such as multi-vehicle High-Income SUV Families and single-vehicle High-Income Families could be further along the adoption process than we estimate. However, these households are a small percentage of households in California overall. Additionally, certain types of households are not well represented among PEV adopters and are grouped within the most similar clusters. Examples include older renters, middle-aged lower-income households, and lower-income urban and rural households. It is possible that households in these categories are numerous but currently have low adoption rates. If the study was repeated in the future, these households may warrant additional clusters.
Conclusions and policy implications
Regulations for new light-duty vehicle sales are ensuring vehicles sold globally will be zero-emission vehicles, which largely comprise plug-in electric vehicles. Many countries have fuel or emissions standards that will result in higher ZEV sales, and several countries have gone so far as to enshrine zero-emission vehicle (ZEV) sales regulations into law. These rules require vehicle manufacturers to sell or produce a certain quantity of ZEVs in particular regions. Several countries and regions have adopted ZEV mandates, including China, Korea, several US states, and certain provinces in Canada2.
We consider the case study of California to show how current adoption may fail to reach ZEV sales targets and climate goals when considering heterogeneity in households and vehicle ownership behavior. When considering different population clusters, it is clear that there is a mismatch between adoption trajectories, ZEVs sales requirements, and net zero goals, especially for specific groups like households that own older vehicles. Our results from California have global relevance because electric vehicles will play a significant role in achieving net zero emissions. The International Energy Agency estimates that 60% of global car sales will need to be electric vehicles in 2030 to meet net zero by 205068. The method developed in this paper can be applied to other regions and the results for California have global policy implications.
Our results indicate that additional measures are needed to ensure equity in the transition to plug-in electric vehicles (PEVs). This research shows that households likely to own one vehicle or older vehicles today may not be able to electrify vehicles quickly without interventions. In the absence of additional policies, these households may keep old conventional vehicles, seek them from other regions, or be forced out of vehicle ownership altogether. Policies may be needed to disincentivize the purchase of older conventional vehicles and promote their retirement, while incentivizing the purchase of older plug-in electric vehicles. Concurrently, if more households are unable to afford private vehicle ownership, policymakers will need to support other measures that improve accessibility and mobility to households without vehicles including investing in public transport, improving active transport infrastructure, and supporting transit-oriented development.
Additional policies may be required to ensure PEV ownership is dispersed among households likely to own multiple vehicles. This research suggests there may be a segment within the Californian population that has high incomes and high rates of home ownership, but low rates of to-date PEV adoption. As these households are also likely to own large vehicles, it is unclear whether limited PEV body types or other factors are limiting adoption in this group. Policy to encourage shifts in perception of PEVs may be needed to encourage adoption if the latter is the issue. As is, high supplies of new PEVs may lead to small segments of the population adopting many PEVs while other segments avoid them altogether.
Overall, additional policy is needed to ensure the transition to lower emission vehicles is equitable and just. Clustering adopters enables us to compare PEV diffusion across various household types. Analyzing adoption at the cluster level reveals where electrification is lagging and identifies the specific challenges families encounter. This analysis can help inform policymakers which households need additional support to adopt electric vehicles and help the state achieve its decarbonization targets.
Data availability
The data generated and/or analyzed during the current study are not publicly available for legal/ethical reasons but are available from the corresponding author on reasonable request.
Code availability
The code developed for the current study is not publicly available for legal/ethical reasons but is available from the corresponding author on reasonable request. Latent class clustering was done using LatentGold version 5.0, 2016.
References
California Energy Commission. New ZEV Sales in California. https://www.energy.ca.gov/zevstats (2025).
Axsen, J., Hardman, S. & Jenn, A. What do we know about zero-emission vehicle mandates? Environ. Sci. Technol. 56, 7553–7563 (2022).
Kumar, R. R. & Alok, K. Adoption of electric vehicle: a literature review and prospects for sustainability. J. Clean. Prod. 253, 119911 (2020).
Wicki, M., Brückmann, G., Quoss, F. & Bernauer, T. What do we really know about the acceptance of battery electric vehicles?–turns out, not much. Transp. Rev. 43, 1–26 (2022).
Hardman, S., Fleming, K., Kare, E. & Ramadan, M. A perspective on equity in the transition to electric vehicle. MIT Sci. Policy Rev. 2, 46–54 (2021).
California Air Resources Board. Zero-Emission Vehicle Program. https://ww2.arb.ca.gov/our-work/programs/zero-emission-vehicle-program/about (2023).
Tal, G. et al. Emerging Technology Zero Emission Vehicle Household Travel and Refueling Behavior. https://escholarship.org/uc/item/2v0853tp (2021).
Guo, S. & Kontou, E. Disparities and equity issues in electric vehicles rebate allocation. Energy Policy 154, 112291 (2021).
Jenn, A., Lee, J. H., Hardman, S. & Tal, G. An in-depth examination of electric vehicle incentives: Consumer heterogeneity and changing response over time. Transp. Res. Part A Policy Pract. 132, 97–109 (2020).
Higgins, C. D., Mohamed, M. & Ferguson, M. R. Size matters: how vehicle body type affects consumer preferences for electric vehicles. Transp. Res. Part A Policy Pract. 100, 182–201 (2017).
Mohamed, M., Higgins, C. D., Ferguson, M. & Réquia, W. J. The influence of vehicle body type in shaping behavioural intention to acquire electric vehicles: a multi-group structural equation approach. Transp. Res. Part A Policy Pract. 116, 54–72 (2018).
Chakraborty, D., Bunch, D. S., Brownstone, D., Xu, B. & Tal, G. Plug-in electric vehicle diffusion in California: Role of exposure to new technology at home and work. Transp. Res. Part A Policy Pract. 156, 133–151 (2022).
Rogers, E. M. Diffusion of Innovations. Diffusion of Innovations (1995).
IEA. Global EV Policy Explorer. https://www.iea.org/data-and-statistics/data-tools/global-ev-policy-explorer (2024).
California Air Resources Board. Advanced Clean Cars II. https://ww2.arb.ca.gov/our-work/programs/advanced-clean-cars-program/advanced-clean-cars-ii (2023).
California Air Resources Board. Section 177 States Regulation Dashboard. https://ww2.arb.ca.gov/our-work/programs/advanced-clean-cars-program/states-have-adopted-californias-vehicle-regulations (2024).
Matouka, N. Carbon Neutrality by 2045. Governor’s Office of Planning and Research https://opr.ca.gov/climate/carbon-neutrality.html (2024).
Hennessy, E. M. & Syal, S. M. Assessing justice in California’s transition to electric vehicles. iScience 26, 106856 (2023).
California Office of Environmental Health Hazard Assessment. CalEnviroScreen 3.0. https://oehha.ca.gov/calenviroscreen/report/calenviroscreen-30 (2018).
Canepa, K., Hardman, S. & Tal, G. An early look at plug-in electric vehicle adoption in disadvantaged communities in California. Transp. Policy 78, 19–30 (2019).
Sovacool, B. K., Newell, P., Carley, S. & Fanzo, J. Equity, technological innovation and sustainable behaviour in a low-carbon future. Nat. Hum. Behav. 6, 326–337 (2022).
Morton, C., Anable, J. & Nelson, J. D. Consumer structure in the emerging market for electric vehicles: Identifying market segments using cluster analysis. Int. J. Sustain. Transp. 11, 443–459 (2017).
Axsen, J., Bailey, J. & Castro, M. A. Preference and lifestyle heterogeneity among potential plug-in electric vehicle buyers. Energy Econ. 50, 190–201 (2015).
Jaiswal, D., Deshmukh, A. K. & Thaichon, P. Who will adopt electric vehicles? Segmenting and exemplifying potential buyer heterogeneity and forthcoming research. J. Retail. Consum. Serv. 67, 102969 (2022).
Axsen, J., Cairns, J., Dusyk, N. & Goldberg, S. What drives the pioneers? applying lifestyle theory to early electric vehicle buyers in Canada. Energy Res. Soc. Sci. 44, 17–30 (2018).
Wei, W., Cao, M., Jiang, Q., Ou, S. J. & Zou, H. What influences Chinese consumers’ adoption of battery electric vehicles? a preliminary study based on factor analysis. Energies 13, 1057 (2020).
Khan, M. & Kockelman, K. M. Predicting the market potential of plug-in electric vehicles using multiday GPS data. Energy Policy 46, 225–233 (2012).
Jakobsson, N., Gnann, T., Plötz, P., Sprei, F. & Karlsson, S. Are multi-car households better suited for battery electric vehicles? - driving patterns and economics in Sweden and Germany. Transp. Res. Part C Emerg. Technol. 65, 1–15 (2016).
Karlsson, S. What are the value and implications of two-car households for the electric car? Transp. Res. Part C Emerg. Technol. 81, 1–17 (2017).
Tamor, M. A. & Milačić, M. Electric vehicles in multi-vehicle households. Transp. Res. Part C Emerg. Technol. 56, 52–60 (2015).
Davis, L. W. Electric vehicles in multi-vehicle households. Appl. Econ. Lett. 30, 1909–1912 (2023).
Hardman, S., Shiu, E. & Steinberger-Wilckens, R. Comparing high-end and low-end early adopters of battery electric vehicles. Transp. Res. Part A Policy Pract. 88, 40–57 (2016).
Lee, J. H., Hardman, S. J. & Tal, G. Who is buying electric vehicles in California? characterising early adopter heterogeneity and forecasting market diffusion. Energy Res. Soc. Sci. 55, 218–226 (2019).
Bass, F. M. A new product growth for model consumer durables. Manage. Sci. 15, 215–227 (1969).
Lee, D. H., Park, S. Y., Kim, J. W. & Lee, S. K. Analysis on the feedback effect for the diffusion of innovative technologies focusing on the green car. Technol. Forecast. Soc. Change 80, 498–509 (2013).
Massiani, J. & Gohs, A. The choice of Bass model coefficients to forecast diffusion for innovative products: An empirical investigation for new automotive technologies. Res. Transp. Econ. 50, 17–28 (2015).
Bitencourt, L., Abud, T., Santos, R. & Borba, B. Bass diffusion model adaptation considering public policies to improve electric vehicle sales—a Brazilian case study. Energies 14, 5435 (2021).
Jensen, A. F., Cherchi, E., Mabit, S. L. & De Dios Ortúzar, J. Predicting the potential market for electric vehicles. Transp. Sci. 51, 427–440 (2017).
Kumar, R. R., Guha, P. & Chakraborty, A. Comparative assessment and selection of electric vehicle diffusion models: A global outlook. Energy 238, 121932 (2022).
Bakher Naseri, M. & Elliott, G. The diffusion of online shopping in Australia: comparing the Bass, Logistic and Gompertz growth models. J. Mark. Anal. 1, 49–60 (2013).
Wu, F. S. & Chu, W. L. Diffusion models of mobile telephony. J. Bus. Res. 63, 497–501 (2010).
Michalakelis, C., Varoutas, D. & Sphicopoulos, T. Diffusion models of mobile telephony in Greece. Telecomm. Policy 32, 234–245 (2008).
Young, P. Technological growth curves. A competition of forecasting models. Technol. Forecast. Soc. Change 44, 375–389 (1993).
Fornerino, M. Internet adoption in France. Serv. Ind. J. 23, 119–135 (2003).
Dowling, G. R. Application of the Bass new product growth model to Australian television sales. Aust. J. Manag. 5, 133–140 (1980).
Bass, F. M., Krishnan, T. V. & Jain, D. C. Why the Bass model fits without decision variables. Mark. Sci. 13, 203–223 (1994).
Bottomley, P. A. & Fildes, R. The role of prices in models of innovation diffusion. J. Forecast. 17, 539–555 (1998).
Roberson, L., Pantha, S. & Helveston, J. P. Battery-powered bargains? Assessing electric vehicle resale value in the United States. Environ. Res. Lett. 19, 054053 (2024).
Magidson, J., Vermunt, J. K. & Madura, J. P. Latent class analysis. SAGE Res. Methods https://doi.org/10.4135/9781412984713.n2. (2020).
Sun, M., Sun, X. & Shan, D. Pedestrian crash analysis with latent class clustering method. Accid. Anal. Prev. 124, 50–57 (2019).
Lee, Y., Circella, G., Mokhtarian, P. L. & Guhathakurta, S. Are millennials more multimodal? A latent-class cluster analysis with attitudes and preferences among millennial and generation X commuters in California. Transportation (Amst). 47, 2505–2528 (2020).
Alonso-González, M. J., Hoogendoorn-Lanser, S., van Oort, N., Cats, O. & Hoogendoorn, S. Drivers and barriers in adopting mobility as a service (MaaS) – a latent class cluster analysis of attitudes. Transp. Res. Part A Policy Pract. 132, 378–401 (2020).
California Air Resources Board. Insights on CA Light-Duty ZEV Incentive Programs. https://www.calzevinsights.org/ (2023).
Tal, G. et al. Emerging Technology Zero Emission Vehicle Household Travel and Refueling Behavior. UC Davis: Plug-In Hybrid & Electric Vehicle Research Center https://escholarship.org/uc/item/2v0853tp (2021).
Center for Sustainable Energy. Summary of CVRP Rebate Eligibility and Funding Availability Over Time (Updated). (2019).
Gosain, A. & Sardana, S. Handling class imbalance problem using feature selection techniques: a review. Int. Conf. Adv. Comput. Commun. Informatics 2, 2 (2017).
Kalton, G. Methods for oversampling rare subpopulations in social surveys. Surv. Methodol. 35, 125–141 (2009).
Salon, D. Heterogeneity in the relationship between the built environment and driving: Focus on neighborhood type and travel purpose. Res. Transp. Econ. 52, 34–45 (2015).
Ge, Y., Simeone, C., Duvall, A. & Wood, E. There’s No Place Like Home: Residential Parking, Electrical Access, and Implications for the Future of Electric Vehicle Charging Infrastructure. https://docs.nrel.gov/docs/fy22osti/81065.pdf (2021).
McCutcheon, A. L. Basic concepts and procedures in single- and multiple-group latent class analysis. (Cambridge University Press, 2002).
Nylund, K. L., Asparouhov, T. & Muthén, B. O. Deciding on the number of classes in latent class analysis and growth mixture modeling: a Monte Carlo simulation study. Struct. Equ. Model. 14, 535–569 (2007).
National Renewable Energy Laboratory. 2017 National Household Travel Survey—California Add-On. Transportation Secure Data Center https://www.nrel.gov/transportation/secure-transportation-data/tsdc-nhts-california.html (2019).
US Census Bureau. 2015–2019 American Community Survey 5 Year Data. https://www.census.gov/data/developers/data-sets/acs-5year.html (2020).
Hardman, S. & Tal, G. Understanding discontinuance among California’s electric vehicle owners. Nat. Energy 6, 538–545 (2021).
Figenbaum, E. Perspectives on Norway’s supercharged electric vehicle policy. Environ. Innov. Soc. Transitions 25, 14–34 (2017).
Ehsan, F. et al. Assessing policy influence on electric vehicle adoption in China: an in-depth study. Energy Strateg. Rev. 54, 101471 (2024).
Liu, Y., Zhao, X., Lu, D. & Li, X. Impact of policy incentives on the adoption of electric vehicle in China. Transp. Res. Part A Policy Pract. 176, 103801 (2023).
International Energy Agency. Net Zero by 2050: A Roadmap for the Global Energy Sector. https://www.iea.org/reports/net-zero-by-2050 (2021).
Acknowledgements
The authors would like to thank the California Air Resources Board for assistance in the data collection. We also would like to thank Matthew Favetti for survey programming and Dr. Debapriya Chakraborty for guidance. Thank you to the UC Davis EVRC staff and students who supported and contributed to this project in various ways.
Author information
Authors and Affiliations
Contributions
T.R.: Writing—original draft, Visualization, Validation, Methodology, Investigation, Formal analysis, Data curation. J.H.L.: Writing—review and editing, Supervision, Conceptualization. A.W.D.: Writing—review and editing, Supervision, Conceptualization. S.H.: Writing—review and editing, Supervision, Conceptualization. G.T.: Writing—review and editing, Supervision, Conceptualization. All authors reviewed and agreed to the final version of the manuscript.
Corresponding authors
Ethics declarations
Competing interests
The authors declare no competing interests.
Additional information
Publisher’s note Springer Nature remains neutral with regard to jurisdictional claims in published maps and institutional affiliations.
Supplementary information
Rights and permissions
Open Access This article is licensed under a Creative Commons Attribution 4.0 International License, which permits use, sharing, adaptation, distribution and reproduction in any medium or format, as long as you give appropriate credit to the original author(s) and the source, provide a link to the Creative Commons licence, and indicate if changes were made. The images or other third party material in this article are included in the article’s Creative Commons licence, unless indicated otherwise in a credit line to the material. If material is not included in the article’s Creative Commons licence and your intended use is not permitted by statutory regulation or exceeds the permitted use, you will need to obtain permission directly from the copyright holder. To view a copy of this licence, visit http://creativecommons.org/licenses/by/4.0/.
About this article

Cite this article
Ramadoss, T.V., Lee, J.H., Davis, A.W. et al. Classifying electric vehicle adopters and forecasting progress to full adoption. npj. Sustain. Mobil. Transp. 2, 32 (2025). https://doi.org/10.1038/s44333-025-00049-1
Received:
Accepted:
Published:
Version of record:
DOI: https://doi.org/10.1038/s44333-025-00049-1
