
Abstract
Behavioural adaptations to environmental threats are crucial for survival1,2 and necessitate rapid deployment of energy reserves3,4,5. The amygdala coordinates behavioural adaptations to threats6, but little is known about its involvement in underpinning metabolic adaptations. Here we show that acute stress activates medial amygdala (MeA) neurons that innervate the ventromedial hypothalamus (MeAVMH neurons), which precipitates hyperglycaemia and hypophagia. The glycaemic actions of MeAVMH neurons occur independently of adrenal or pancreatic glucoregulatory hormones. Using whole-body virus tracing, we identify a polysynaptic connection from MeA to the liver that promotes the rapid synthesis of glucose by hepatic gluconeogenesis. Repeated stress exposure disrupts MeA control of blood glucose, resulting in diabetes-like dysregulation of glucose homeostasis. Our findings reveal an amygdala–liver axis that regulates rapid glycaemic adaptations to stress and links recurrent stress to metabolic dysfunction.
Main
When an animal encounters a threat in the environment or other stressful stimuli, it must rapidly mobilize energy stores to support appropriate defensive behaviours, such as escape, darting or freezing1,2. Rapid energy mobilization fuels cardiovascular and muscular responses to stress and supports the increased allocation of cognitive resources necessary to process threat-relevant contextual information3,4,5. In parallel, behavioural repertoires that could compete with defensive strategies, such as foraging and eating7, must be suppressed. Glycaemic responses to stress are correlated with fight–flight behaviours8, and glucose infusions elicit stress-like enhancements of cardiac output and blood pressure9,10, in addition to facilitating the encoding of spatial memories11,12,13. These threat-induced metabolic adaptations are highly conserved across species, suggesting that they provide a strong evolutionary advantage14. Despite their biological importance, surprisingly little is known about the brain circuits that orchestrate adaptive hyperglycaemic and hypophagic responses to acute stress15.
Here we identify a novel amygdalar–hypothalamic–liver axis that regulates rapid metabolic adaptations to acute stress via mechanisms that are independent of the classical adrenomedullary and hypothalamic–pituitary–adrenal (HPA) stress systems. We demonstrate that recurrent stress disrupts amygdala–liver circuit activity to drive stress-related metabolic abnormalities, thereby linking chronic stress to metabolic disorders such as type 2 diabetes (T2D).
Acute stress rapidly changes metabolism
To investigate the central mechanisms of stress-related metabolic adaptations, we first identified acute stressors that increased blood glucose levels and suppressed appetite in C57Bl/6 mice. Acute restraint stress rapidly increased blood glucose levels and impaired glucose tolerance in mice that were food-restricted for 6 h before testing (Fig. 1a,b, Extended Data Fig. 1a,b and Supplementary Fig. 1h). Restraint stress also raised plasma corticosterone (Fig. 1c), consistent with HPA axis activation. Plasma adrenaline, glucagon and glycerol levels were also increased by restraint stress (Extended Data Fig. 1d,e,g), consistent with activation of the adrenomedullary stress system to drive sympathetic input to the adrenal glands, pancreas and adipose tissue. By contrast, plasma insulin and noradrenaline levels were unaltered by restraint stress in these mice (Extended Data Fig. 1c,f). Food restriction is known to elicit stress-like metabolic adaptations, including lowered plasma insulin levels and elevated hepatic glucose production16. Therefore, we also assessed metabolic responses to restraint stress in fully fed mice. Acute restraint stress increased blood glucose, plasma glucagon and corticosterone levels, and reduced plasma insulin levels in the fully fed mice (Supplementary Fig. 1a–d). Restraint stress also increased hepatic expression of glucose-6-phosphatase (G6pc) without effects on phosphoenolpyruvate carboxykinase (Pck1) or liver glycogen content in fed mice (Fig. 1d and Extended Data Fig. 1h), consistent with stress-induced increases in the capacity of the liver to produce glucose. Social stress triggered by exposing mice to the odour of a conspecific male in a territorialized cage similarly increased blood glucose and impaired glucose tolerance (Extended Data Fig. 1i–k and Supplementary Fig. 1l). Territorialized cage stress increased plasma corticosterone and resulted in non-significant increases in liver G6pc and Pck1 expression and unaltered plasma adrenaline, pancreatic hormones and glycerol (Extended Data Fig. 1l–r,t). Territorialized cage stress also suppressed food intake (Extended Data Fig. 1s). Even brief (5 min) restraint or territorialized cage stress was sufficient to increase blood glucose and plasma corticosterone levels (Supplementary Fig. 1e–g,i–k), consistent with the rapid mobilization of the glucoregulatory mechanisms that drive metabolic adaptations to physical and social stressors.
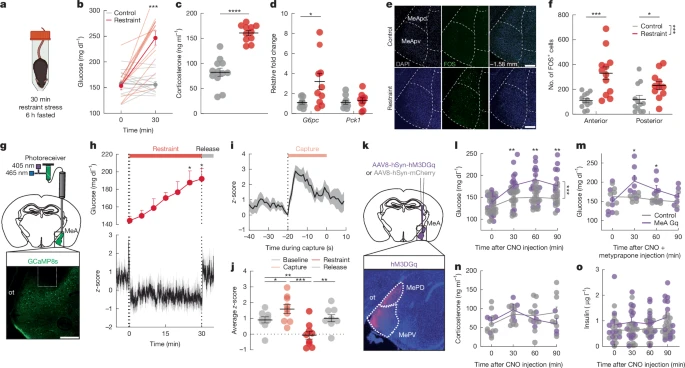
a, Schematic of the restraint stress condition. Created with BioRender (https://biorender.com/1ikn9ci). b, Blood glucose before and after no stress (control) or a 30 min restraint stress. c, Plasma corticosterone with (red) and without (grey) 30 min of restraint stress. d, Relative fold change in liver G6pc and Pck1 gene expression with (red) and without (grey) exposure to a 30 min restraint stress in sated mice. e, FOS expression in MeA at −1.58 mm from bregma in control and 30 min restrained mice. MeApd, posterior dorsal MeA; MeApv, posterior ventral MeA. Scale bar, 200 μm. f, Number of FOS+ cells in anterior (−1.06 mm to −1.34 mm from bregma) and posterior (−1.34 to −2.06 mm from bregma) MeA with (red) and without (grey) 30 min of restraint stress. g, Schematic of fibre photometry experiment (top) and image of GCaMP8s expression and fibre placement (bottom). Scale bar, 200 μm. ot, optic tract. h, z-score of GCaMP8s signal (bottom) and blood glucose (top) before, during and after 30 min of restraint stress in MeA. Bars along the top indicate capture (pink), restraint (red) and release (grey). i, GCaMP8s z-score aligned to start of the capture period. j, Mean GCaMP8s z-score for 5 min baseline, 30 s capture, 30 min restraint and 5 min release periods. k, Schematic of MeA chemogenetic activation and MeA expression of hSyn-hM3DGq-mCherry. l,m, Blood glucose in mice treated as depicted in k, with CNO (3 mg kg−1, intraperitoneal injection) and fasted for 6 h, without (l) and with (m) metyrapone pretreatment at −60 min relative to CNO injection. n,o, Plasma corticosterone (n) and insulin (o) in mice treated as depicted in k, with CNO (3 mg kg−1, intraperitoneal injection) and fasted for 6 h. Data are mean ± s.e.m. Individual data points represent individual mice. Sample size and statistical analyses in Supplementary Data Table 1.
Stress activates MeA neurons
Social stimuli are known to modify the activity of MeA neurons17, and threat-related external and internal sensory signals converge in the MeA18,19,20. MeA neurons send inputs to stress-relevant brain regions that regulate endocrine, autonomic and metabolic processes, including hypothalamic nuclei21 and the bed nucleus of the stria terminalis22 (BNST). Thus, we hypothesized that MeA neurons participate in metabolic adaptations to acute stress. Restraint stress increased the numbers of FOS immunoreactive (FOS+) cells in the anterior and posterior domains, as well as the dorsal and ventral regions, of the MeA, compared with unstressed control mice, and compared with stress-induced FOS+ cells in the adjacent basolateral amygdala (BLA) and central amygdala (CEA) nuclei (Fig. 1e,f and Extended Data Fig. 2a–c). Using photometry-based in vivo calcium imaging, we found that neural activity was rapidly increased in the MeA during the ‘capture period’, the 20-s period before restraint when the investigator was reaching to manually restrain and then place the mouse in the restraint tube for 5 min or 30 min of restraint stress (Fig. 1g–j and Supplementary Fig. 2a–c). MeA activity was suppressed during periods of immobilization in restrained mice but returned to baseline levels when mice were released from immobilization (Fig. 1g–j and Supplementary Fig. 2a–c). Exposing mice to conspecific odour in a territorialized cage for 5 min or 30 min induced a rapid increase in MeA activity with a gradual return to baseline (Extended Data Fig. 2d–f and Supplementary Fig. 2d–f). Notably, restraint and territorialized cage stress-induced increases in MeA activity occurred before increases in blood glucose levels (Fig. 1h, Extended Data Fig. 2d and Supplementary Fig. 2a,d). Similarly, MeA activity was significantly increased by a physical stressor, footshock, and a visual stressor, the approach of a ‘robobug’23, both of which significantly increased blood glucose (Supplementary Fig. 2g–l). By contrast, MeA activity was not significantly altered in a novel clean cage and was unrelated to changes in locomotor activity in unstressed conditions, suggesting that MeA neurons do not encode movement per se (Supplementary Fig. 2m–r). These data suggest that neural activity in the MeA is engaged when mice seek to evade or escape threatening stimuli and coincides with the rapid mobilization of energy reserves to support these adaptive behaviours.
MeA neurons regulate glucose and feeding
Next, we used chemogenetics to investigate MeA involvement in metabolic adaptations to stress. We delivered an adeno-associated virus expressing the excitatory hM3DGq (AAV-hSyn-hM3DGq-mCherry) DREADD (designer receptors exclusively activated by designer drugs) or a control virus (AAV-hSyn-mCherry) into the MeA of mice (Fig. 1k). Clozapine-N-oxide injection (CNO, 3 mg kg−1, intraperitoneal injection) significantly increased blood glucose levels in unstressed DREADD-expressing, but not mCherry-expressing, control mice (Fig. 1l). Analysis of sex-specific pancreatic hormone responses revealed significantly increased plasma insulin in DREADD-expressing male mice at 90 min, but not in control mice, and suppressed plasma glucagon in DREADD-expressing female mice compared with baseline (Fig. 1o and Extended Data Fig. 2l–n). Considering that MeA activity was increased by physical, social and visual stressors, we were surprised to find that DREADD-mediated stimulation of MeA neurons increased blood glucose levels without significant differences in plasma adrenaline (Extended Data Fig. 2h) or plasma corticosterone (Fig. 1n) between hM3DGq and control groups. Indeed, chemogenetic stimulation of MeA neurons significantly increased blood glucose even in the presence of the corticosterone synthesis inhibitor metyrapone (50 mg kg−1, subcutaneous injection) (Fig. 1m) at a dose sufficient to blunt restraint stress-induced increases in blood glucose and block stress-induced increases in plasma corticosterone (Supplementary Fig. 3k,l). This suggests that MeA neurons precipitated increases in blood glucose levels without recruiting stress-related glucoregulatory hormones from the adrenal cortex or pancreas controlled by the HPA and adrenomedullary stress systems. DREADD activation of MeA neurons in mice exposed to restraint or territorialized cage stress or a glucose challenge did not further enhance the glucose response (Supplementary Fig. 3c–j). In addition to increasing blood glucose levels, DREADD-mediated stimulation of the MeA induced transient stress-like suppression of food intake for the first 1 h (standard laboratory chow) in food-deprived mice that had been fasted overnight (Extended Data Fig. 2k). MeA stimulation similarly suppressed reward-driven consumption of palatable food in fully fed mice for 2 h (Supplementary Fig. 3b). By contrast, MeA activation had no effect on fear or anxiety-related defensive behaviours in an elevated plus maze, light-dark box or open field apparatus (Extended Data Fig. 2j). This suggests that MeA activation drives stress-induced changes in metabolism and energy homeostasis independent of anxiety and fear responses.
To probe the relationship between MeA neural activity and metabolic responses with greater temporal resolution, we examined the effects of optogenetic MeA stimulation on blood glucose. We injected an adeno-associated virus (AAV) expressing the excitatory opsin ChR2 (AAV-hSyn-hChR2(H134R)) or a control virus (AAV-hSyn-eGFP) into the MeA and implanted an optical fibre immediately above the injection site. Optogenetic MeA stimulation (470 nm, 20 Hz) for 5 min and 15 min significantly increased blood glucose at the end of the stimulation period compared with baseline in unstressed ChR2-expressing mice, but not in control mice (Extended Data Fig. 2o–q and Supplementary Fig. 3n,o). Optogenetic activation did not significantly increase blood glucose in stressed mice or in combination with a glucose challenge (Supplementary Fig. 3p–y). In keeping with DREADD stimulation, optogenetic MeA stimulation (15 min) also induced acute suppression of food intake in food-deprived mice during stimulation (Supplementary Fig. 3z). Together, these data suggest that MeA neurons are activated by acute stressors to drive metabolic adaptations to stress.
MeA circuit responses to stress
We next investigated the circuit-level mechanisms by which MeA neurons elevate blood glucose levels and suppress appetite. Injection of mCherry-tagged synaptophysin (a synaptically localized protein) into the MeA revealed dense mCherry-expressing axon terminals in hypothalamic regions that are known to regulate metabolism, including the medial preoptic area, lateral hypothalamus and ventromedial hypothalamus (VMH) (Fig. 2a,b). We also detected mCherry-expressing terminals in the BNST, a component of the extended amygdala that is known to regulate physiological and behavioural adaptations to stress24 (Fig. 2a,b). Since circuits involving the VMH and BNST contribute to glucose regulation25,26 and are engaged by stressful stimuli24,27, we investigated whether the MeA neurons that project to the VMH (MeAVMH neurons) and/or BNST (MeABNST neurons) regulate metabolic adaptations to stress. First, we determined whether the same populations of MeA neurons project to both VMH and BNST. We injected a retrograde-travelling AAV expressing red fluorescent protein (AAVretro-RFP) into the BNST and an AAVretro expressing green fluorescent protein (AAVretro-GFP) into the VMH (Fig. 2c). We found that less than 12% of labelled neurons co-expressed both RFP and GFP (Fig. 2d,e). This suggests that largely non-overlapping populations of MeA neurons project to VMH or BNST. Next, we used FOS immunolabelling combined with AAVretro tracing to determine whether MeAVMH or MeABNST neurons are activated by restraint stress that increases blood glucose levels. Restraint stress increased numbers of FOS+ MeAVMH neurons by around twofold without increasing numbers of FOS+ MeABNST neurons (Fig. 2f,g). This suggests that acute restraint stress preferentially increases the activity of MeAVMH neurons.
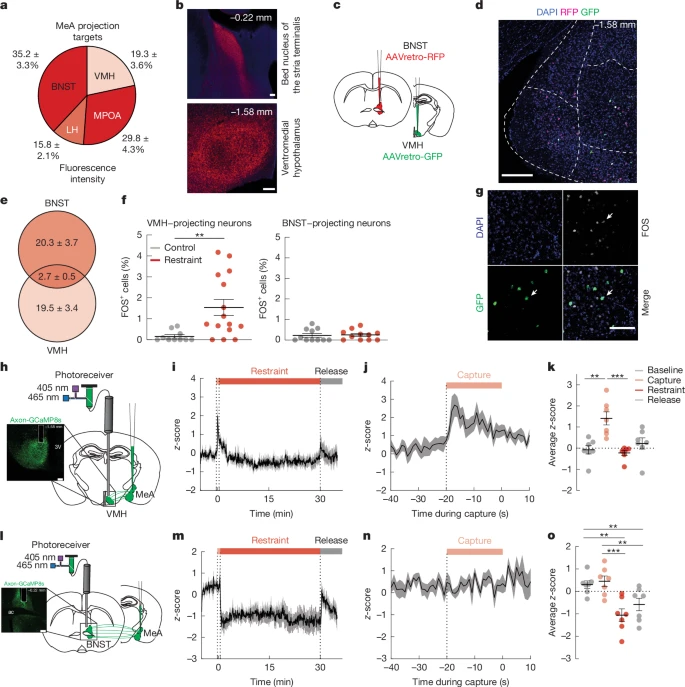
a,b, Quantification (a) and imaging (b) of mCherry-labelled synaptophysin with anterograde tracing from MeA neurons. Scale bars, 100 μm. c, Schematic of dual retrograde tracing with injection of AAVretro-RFP and AAVretro-GFP into BNST and VMH, respectively. d, RFP (BNST-projecting neurons) and GFP (VMH-projecting neurons) expression in MeA, with colocalization shown in white. Scale bar, 200 μm. e, Quantification of BNST-projecting and VMH-projecting MeA neurons. f, Number of FOS+ cells in VMH-projecting and BNST-projecting MeA neurons with and without (control) 30 min of restraint stress. g, Colocalization of FOS expression with GFP-labelled VMH-projecting MeA neurons (white arrows). Scale bar, 100 μm. h, Schematic of fibre photometry experiment (right) and axonal GCaMP8s expression and VMH fibre placement (left). 3V, third ventricle. Scale bar, 200 μm. i, GCaMP8s z-score in MeAVMH axons before, during and after 30 min of restraint. Shade bars indicate capture (pink), restraint (red) and release (grey). j, GCaMP8s z-score in MeA→VMH axons aligned to start of the capture period. k, Mean GCaMP8s z-score in MeA→VMH axons for 5 min baseline, 30 s capture, 30 min restraint and 5 min release periods. l, Schematic of fibre photometry (right) and axonal GCaMP8s expression and BNST fibre placement (left). ac, anterior commissure. Scale bar, 200 μm. m, GCaMP8s z-score in MeA→BNST axons before, during and after 30 min of restraint. Bars at the top indicate capture (pink), restraint (red) and release (grey). n, GCaMP8s z-score in MeA→BNST axons aligned to start of the capture period. o, Mean GCaMP8s z-score in MeA→BNST axons for 5 min baseline, 30 s capture, 30 min restraint and 5 min release periods. Data are mean ± s.e.m. Individual data points represent individual mice. Sample size and statistical analysis in Supplementary Data Table 1.
To extend these studies and determine the time course of neural activity in these circuits, we used fibre photometry in vivo calcium imaging in MeAVMH and MeABNST projection circuits with MeA delivery of axon-targeted GCaMP (AAV-hSyn-axon-jGCaMP8s-P2A-mRuby3) and fibre placement over the VMH (Fig. 2h) or BNST (Fig. 2l). We found that neural activity was significantly increased in MeAVMH projection neurons in the capture period immediately before 5 min and 30 min of restraint stress (Fig. 2i–k and Supplementary Fig. 4a–e). Activity in MeAVMH projection neurons also increased with 5 min and 30 min of territorialized cage stress (Extended Data Fig. 3a–d and Supplementary Fig. 4f–h), with footshock and with the robobug approach (Supplementary Fig. 4m–p), but not with exposure to a novel clean cage (Supplementary Fig. 4i–l). Stress-induced increases in MeAVMH projection neuron activity preceded increases in systemic glucose in mice with continuous glucose monitoring (Extended Data Fig. 3e,f). By contrast, while MeABNST projection neuron activity significantly increased with 5 min and 30 min territorialized cage exposure (Extended Data Fig. 3g–j and Supplementary Fig. 4v–x), activity was not significantly increased before, during or after 5 min or 30 min of restraint stress (Fig. 2m–o and Supplementary Fig. 4q–u), with footshock or with the robobug approach (Supplementary Fig. 4ac–af), or with an exposure to a novel clean cage (Supplementary Fig. 4y–ab).
Diverse MeA neurons innervate the VMH
We sought to identify the MeA neurons that project to the VMH and regulate stress-induced hyperglycaemia. We applied spatial transcriptomics (Xenium, 10X Genomics) to characterize the expression of a library of 359 genes with non-neuronal and neuronal cell-type markers, including known MeA-expressed genes28 (Supplementary Data Table 2, S1), to define the genetic phenotypes of MeAVMH neurons with single-cell resolution. Coronal slices containing the MeA (−0.7 mm to −2.06 mm from bregma) were prepared from C57Bl/6 mice with VMH injections of AAVretro-hSyn-mCherry to fluorescently tag VMH-projecting MeA neurons. We profiled a total of 21,607 cells mapping to the MeA from six biological replicates (Supplementary Data Table 2, S2 and S3). Unsupervised clustering identified 15 discrete groups of cells on the basis of their transcriptional profiles, revealing major non-neuronal and neuronal cell populations within the MeA (Fig. 3a and Extended Data Fig. 4a). Gene transcripts considered to be markers of distinct cell types showed spatially variable expression in keeping with the cellular anatomy of the MeA (Fig. 3b). We next examined the neural populations mapping to the MeA (12,512 neurons) in more detail. MeA neurons were re-clustered, yielding a set of 20 neural clusters with distinct spatial distributions (Fig. 3c, Extended Data Fig. 4h and Supplementary Data Table 2, S4). A single major population of Vgat (also known as Slc32a1)-expressing GABAergic (γ-aminobutyric acid-expressing) neurons was resolved in uniform manifold approximation and projection (UMAP) space, whereas three populations of glutamatergic neurons were resolved on the basis of exclusive expression of Vglut1 (also known as Slc17a7) or Vglut2 (also known as Slc17a6) or co-expression of both genes (Vglut1/2+) (Fig. 3d and Extended Data Fig. 4b–f). These neural populations were topographically organized in the MeA, with GABAergic neurons distributed mainly along the length of the dorsal MeA, and excitatory neuronal populations concentrated in the ventral MeA, with Vglut2 expression mainly in the anterior MeA and Vglut1 in the posterior MeA (Fig. 3e and Extended Data Fig. 4g–j). Stress-induced FOS expression was increased across both dorsal–ventral and anterior–posterior MeA axes (Fig. 1f and Extended Data Fig. 2b), suggesting that both inhibitory and excitatory MeA neural populations are activated by stress.

a, UMAP plot of all MeA cells identified by spatial transcriptomics with clusters and cell types. b, Representative brain slice (top) and MeA region of interest (bottom) with spatial locations of cells profiled by spatial transcriptomics. c, UMAP plot of MeA neurons with neural cluster assignments. d, UMAP plot of GABAergic and glutamatergic (Vglut1+, Vglut2+ and Vglut1/2+) MeA neurons. e, Representative MeA slices showing spatial distribution of glutamatergic and GABAergic MeA neurons, from anterior to posterior MeA. f, Distribution of VMH-projecting mCherry+ MeA neurons shown on the UMAP plot of all MeA neurons. g, Proportion of mCherry+ neurons in Vglut1+, Vglut2+, Vglut1/2+ and GABAergic neural populations. h, Expression of mCherry-labelled synaptophysin in the VMH with anterograde tracing from MeA glutamatergic (top) or GABAergic (bottom) neurons. Scale bar, 200 μm. i, Proportion of mCherry–synaptophysin expressing projections to indicated downstream sites after tracing from glutamatergic (Glut), GABAergic (GABA) and all MeA neurons. j, Blood glucose in CNO-treated mice with MeA expression of CamK2a-hM3DGq (red), Dlx-hM3DGq (blue) or hSyn-mCherry (control, grey). k, Left, heat map of differentially expressed genes (DEGs) in mCherry+ versus mCherry− cells for neural clusters with more than ten mCherry+ cells and at least one significant DEG. Top, DEGs in individual clusters. Bottom, DEGs by global comparison on all neurons (with cluster assignment as a covariate). Genes that were significant in both individual clusters and global comparison were omitted from the global section (full lists in Supplementary Data Table 2, S12). z-scores are computed on normalized gene expressions within each individual cluster separately and averaged for mCherry+ and mCherry− subsets. Right, heat map of scores from the Human Genetic Evidence framework for glycaemic indices for each DEG. Data are mean ± s.e.m. Individual data points represent individual mice. Sample size and statistical analysis in Supplementary Data Table 1.
We next registered the Xenium images with fluorescent microscope images of the AAVretro tagged mCherry+ neurons, identifying MeAVMH projection neurons, and nuclei (labelled with DAPI). This resolved 305 mCherry+ neurons distributed along the length of the MeA, with glutamatergic neurons accounting for 74% of these cells (Fig. 3f,g and Extended Data Fig. 4k,l). The highest proportion of mCherry+ MeA neurons were present in clusters 3 and 4 (Vglut2+), 7 (Vglut1+), 18 (Vglut1/2+) and 11 (GABAergic) (Extended Data Fig. 4l and Supplementary Data Table 2, S5). Notably, mCherry+ MeA neurons were enriched in several gene transcripts relative to mCherry− neurons (Extended Data Fig. 4m and Supplementary Data Table 2, S6 and S7). Allelic variation in many of these MeAVMH-enriched genes is associated with metabolic processes, including blood glucose, T2D and body weight, as revealed by their Human Genetic Evidence score29 (https://hugeamp.org/) (Fig. 3k). To validate these transcriptomic data, we injected Cre-dependent synaptophysin-mCherry into the MeA of Vglut2-cre and Vgat-cre mice. We detected mCherry-expressing axon terminals in the VMH region of both Vglut2-cre mice and Vgat-cre mice (Fig. 3h,i), consistent with both MeA glutamatergic and GABAergic neurons innervating the VMH. Accordingly, chemogenetic activation of MeA glutamatergic and GABAergic neurons (using AAV-CamK2a-hM3DGq-mCherry and AAV-hDlx-GqDREADD-dTomato-Fishell-4, respectively) significantly increased blood glucose compared with control mice (AAV-hSyn-mCherry) (Fig. 3j). These findings suggest that the MeAVMH circuit is composed of mixed populations of glutamatergic and GABAergic neurons, with activation of both excitatory and inhibitory circuit contributing to increases in blood glucose levels.
MeAVMH neurons regulate blood glucose
We next investigated whether manipulating MeAVMH circuit activity modified metabolic responses to acute stress. Chemogenetic silencing of MeAVMH neurons was achieved by co-injecting AAVretro-Cre into the VMH and AAV-DIO-hSyn-hM4DGi into the MeA of the same mice (Fig. 4a). Silencing MeAVMH neurons with CNO (3 mg kg−1) blunted the hyperglycaemic responses elicited by 30 min of restraint and territorialized cage stress (Fig. 4b and Extended Data Fig. 5b) and reduced the glucose increase with 5 min of restraint and territorialized cage stress (Supplementary Fig. 5g–o). By contrast, stress-induced increases in corticosterone, adrenaline and glucagon were unaltered by inactivation of MeAVMH neurons (Extended Data Fig. 5d,f,g). Plasma insulin and noradrenaline levels were not significantly different between groups (Extended Data Fig. 5e and Supplementary Fig. 5k). Silencing MeAVMH neurons did not alter plasma glucose in unstressed mice that were fasted for 6 h (Extended Data Fig. 5c and Supplementary Fig. 5f) or blood glucose responses in a glucose tolerance test (GTT) or insulin tolerance test (Supplementary Fig. 5p–r). Silencing MeAVMH neurons also had no effect on food intake in fasted mice or anxiety-like behaviour in an open field apparatus (Supplementary Fig. 5s–u). Mice expressing MeAVMH constructs exhibited stress-induced increases in glucose, corticosterone and adrenaline resembling those in mice without AAV injection (Supplementary Fig. 5c–e).

a, Schema for chemogenetic silencing of the MeA–VMH circuit. b, Blood glucose in CNO-injected mice before and after 30 min of restraint stress following MeA–VMH silencing (MeAVMH-Gi) as depicted in a. c, Schema for chemogenetic activation of the MeA–VMH circuit. d,e, Blood glucose during GTT (2 mg kg−1) in CNO-injected mice without (d) and with (e) metyrapone pretreatment (at −60 min) following MeA–VMH activation (MeAVMH-Gq) as depicted in c. f, Schematic for tracing MeA–liver circuits. Created with BioRender (https://BioRender.com/zfc1zkn). g, MeA-connected VMH neurons express Tdtom and liver-connected VMH neurons express GFP. Arrows mark colocalization. h,i, Imaging (h) and quantification (i) of FOS+ neurons among locus coeruleus TH+ neurons in CNO-injected mice treated as depicted in f. j, Schema of sympathetic circuit to liver via coeliac ganglia. Created with BioRender (https://BioRender.com/zfc1zkn). k–m, Imaging (k) and quantification of FOS+ cells (l) and TH intensity (m) in TH+ coeliac ganglia neurons in CNO-injected mice treated as depicted in j. n, Blood glucose during pyruvate tolerance testing (2 mg kg−1) in CNO-injected mice treated as depicted in j. o, Hepatic gluconeogenic gene expression in CNO-injected mice treated as depicted in j. Glut2 is also known as Slc2a2. p, Hepatic gluconeogenic protein levels in CNO-injected mice treated as depicted in j. q, Schema for optogenetic activation of the MeA–VMH circuit. r,s, Blood glucose changes with 5 min (r) or 15 min (s) optogenetic stimulation in mice transduced in MeA with hSyn-hChR2(H134R) (MeAVMH ChR2) or hSyn-eGFP (control). t, Blood glucose changes during pyruvate tolerance testing (2 mg kg−1) with 15 min optogenetic stimulation in mice transduced in MeA with hSyn-hChR2(H134R) (MeAVMH ChR2, red) or hSyn-eGFP (control, grey). u, Enriched M2 gluconeogenic metabolites during [2,3-13C]pyruvate tolerance testing with 15 min optogenetic stimulation in mice transduced in MeA with hSyn-hChR2(H134R) (MeAVMH ChR2) or hSyn-eGFP (control). Data are mean ± s.e.m. Individual data points represent individual mice. Sample size and statistical analysis in Supplementary Data Table 1. Scale bars, 100 μm.
Next, we expressed hM3DGq in MeAVMH neurons (Fig. 4c) and assessed blood glucose regulation. In mice that were fasted for 6 h, blood glucose was increased by chemogenetic stimulation of MeAVMH neurons (Extended Data Fig. 5i and Supplementary Fig. 6b). Plasma corticosterone, glucagon, adrenaline and noradrenaline levels were not altered by MeAVMH activation, although plasma insulin was increased at 90 min, possibly as a compensatory response to increased blood glucose (Extended Data Fig. 5j–m and Supplementary Fig. 6j,k). Stimulating MeAVMH neurons resulted in a persistent increase in blood glucose levels in a GTT test relative to control mice, with no significant difference in the plasma insulin responses (Fig. 4d and Supplementary Fig. 6c,h,i). This suggests that increased activity of MeAVMH neurons delays the recovery of blood glucose to homeostatic levels. Moreover, MeAVMH activation increased blood glucose during GTT in the presence of the corticosterone synthesis inhibitor metyrapone (Fig. 4e and Supplementary Fig. 6d). Hyperglycaemia induced by restraint or social stress (5 and 30 min) was not further increased by DREADD-mediated stimulation of MeAVMH neurons (Supplementary Fig. 6m–x), suggesting that stress-induced increases in MeA activity occluded any further response to their chemogenetic stimulation. Chemogenetically stimulating MeAVMH neurons did not alter insulin sensitivity but increased blood glucose levels in hypoglycaemic mice that had been treated with insulin to lower their baseline glucose levels (Supplementary Fig. 6l). This suggests that MeAVMH neurons are unlikely to be involved in regulating blood glucose homeostasis through mechanisms involving insulin and other classical glucoregulatory hormones, but instead contribute to stress-induced glycaemic adaptions through an unknown mechanism. Chemogenetic activation of MeAVMH neurons had no effect on food intake in fasted mice or anxiety-like behaviour (Supplementary Fig. 6e–g), suggesting that MeAVMH neurons are involved specifically in glycaemic responses to stressful stimuli. We next used optogenetic stimulation to assess whether short-term activity in this circuit could trigger similar changes in blood glucose to those observed with longer-term chemogenetic stimulation. Optogenetic MeAVMH stimulation for 5 min and 15 min significantly increased blood glucose in unstressed ChR2-expressing mice compared with eGFP-expressing control mice (Fig. 4q–s and Supplementary Fig. 6z,aa) and increased blood glucose after a glucose challenge (Supplementary Fig. 6ab,ac). Similar to the findings with chemogenetic-based stimulation, stress-induced increases in blood glucose were not further increased by optogenetic stimulation (Supplementary Fig. 6ad–ak).
To assess the circuit-level specificity of these findings, we characterized the effects of activating MeABNST neurons. We found that chemogenetic stimulation of MeABNST neurons had no effect on basal glucose levels or blood glucose during a GTT (Extended Data Fig. 5n–p and Supplementary Fig. 7c,d), plasma insulin, glucagon, or corticosterone levels (Extended Data Fig. 5q–t and Supplementary Fig. 7e–g), feeding behaviour in fasted mice (Supplementary Fig. 7j), or anxiety-like behaviour (Supplementary Fig. 7h,i). Similarly, optogenetic stimulation for 5 or 15 min did not significantly alter basal glucose, glucose tolerance or the glucose responses to 5 min or 30 min of restraint or territorialized cage stressors (Supplementary Fig. 7k–z). Together, these findings suggest that MeAVMH neurons regulate hyperglycaemic but not hypophagic or behavioural adaptations to stress through a mechanism independent of major adrenal and pancreatic glucoregulatory hormones.
A MeA–liver circuit regulates glucose
Previous studies support the central regulation of liver function30,31. Therefore, we postulated that MeA neurons increase blood glucose levels by ‘bypassing’ adrenal and pancreatic systems to directly stimulate hepatic glucose production. Such a mechanism would position MeA neurons to rapidly increase blood glucose levels during stressful events independent of relatively slowly acting glucoregulatory hormones. To investigate this possibility, we first explored whether MeA neurons communicate with the liver through synaptic connections. Thus, we injected AAV1 expressing Cre recombinase into the MeA of Ai14 reporter mice for the anterograde and transsynaptic fluorescent tagging of downstream neurons32. In these mice, neurons in the MeA and those that receive synaptic input from the MeA express the red fluorescent protein tdTomato (tdTom) in response to Cre-mediated recombination events. We injected pseudorabies virus (PRV) expressing GFP (PRV-GFP) into the liver of these same mice (Fig. 4f). As PRV-GFP travels retrogradely from the sites of injection along synaptically connected neurons, this enabled us to map GFP+ neurons that provide polysynaptic inputs to the liver (Fig. 4f). We detected dual-labelled cells in the VMH that co-expressed both tdTom and GFP (Fig. 4g). This suggests that MeAVMH neurons communicate with the liver via networks of polysynaptic connections. We hypothesized that MeAVMH neurons signal to the liver via sympathetic efferent neurons of the autonomic nervous system. Consistent with this possibility, DREADD-mediated activation of MeAVMH neurons increased FOS expression in tyrosine hydroxylase (TH) expressing neurons in the locus ceruleus (Fig. 4h,i) and in TH-positive neurons in the coeliac ganglia (Fig. 4j–l), which are major central and peripheral hubs, respectively, of the sympathetic efferent pathway. In addition, activation of MeAVMH neurons increased TH intensity in coeliac ganglia neurons (Fig. 4m), an indication of sympathetic neural activation33.
Sympathetic activity regulates hepatic glucose production by modulating de novo synthesis of glucose (gluconeogenesis) and the breakdown of glycogen (glycogenolysis). Gluconeogenesis relies on the conversion of pyruvate to oxaloacetate, and ultimately to glucose34. Thus, gluconeogenesis can be assessed by monitoring increases in blood glucose levels after pyruvate administration. In keeping with MeA regulation of hepatic gluconeogenesis, chemogenetic stimulation of MeAVMH neurons increased blood glucose in unstressed mice after pyruvate administration (2 g kg−1, intraperitoneal injection) as did chemogenetic or optogenetic stimulation of MeA neurons (Fig. 4n, Extended Data Fig. 6a,b and Supplementary Fig. 8a–c). Next, we assessed the effects of MeAVMH modulation on the expression of glucose-6-phosphatase (G6Pase, encoded by G6pc (also known as G6pc1)) and other stress-sensitive hepatic genes that regulate gluconeogenesis (Fig. 1d and Extended Data Fig. 1t). Activation of MeAVMH neurons in unstressed mice increased liver expression of Foxo1, a transcriptional activator of gluconeogenic genes35 and G6pc, whose product controls the final rate-limited step in hepatic gluconeogenesis36 (Fig. 4o), although we did not detect any change in protein levels of G6Pase in unstressed mice at this time point (Fig. 4p and Supplementary Fig. 8g,i–l). Stimulating MeAVMH neurons in unstressed mice increased liver glycogen content (Extended Data Fig. 6g), suggesting that stress-induced activation of MeAVMH neurons may increase the overall capacity for hepatic glucose production without net glycogen breakdown. We next assessed the effects of chemogenetically silencing MeAVMH neurons on the expression of hepatic genes that regulate gluconeogenesis in stressed mice. We found that silencing of MeAVMH neurons did not effect pyruvate tolerance but did blunt the stress-induced increase in hepatic G6pc gene expression, increase in expression of the liver insulin-responsive genes Irs2 and Igfbp1 and decrease in liver G6Pase and PCK1 protein levels, without effects on liver glycogen content (Extended Data Fig. 6c–f and Supplementary Fig. 8d,h–l).
The above findings suggest that MeAVMH neurons regulate stress-induced hyperglycaemia by a mechanism involving sympathetic regulation of hepatic gluconeogenesis. To directly test this hypothesis, we performed a modified pyruvate tolerance test using [2,3-13C]pyruvate (2 g kg−1) in mice fasted for 4 h in combination with optogenetic stimulation of MeAVMH neurons. In keeping with chemogenetic modulation studies, optogenetic stimulation of MeAVMH neurons increased blood glucose after pyruvate administration (Fig. 4t and Supplementary Fig. 8e). Mass spectrometry analysis of liver tissue collected 15 min after intraperitoneal administration of [2,3-13C]pyruvate (Supplementary Fig. 8f) confirmed that activation of MeAVMH neurons increased incorporation of 13C into the key gluconeogenic intermediates M2 citrate, M2 fumarate, M2 aspartate, M2 malic acid and M2 glutamate (Fig. 4u), as well as average 13C enrichment of these intermediates (Extended Data Fig. 6h). Labelled carbon was also incorporated into M2 glycerol-3-phosphate, which may act as a gluconeogenic substrate. Notably, optogenetic stimulation of MeAVMH neurons increased stable isotope labelling of glucose, which was assessed in the first two glucose carbons in the [1,2-13C]glucose fragment, and the last three glucose carbons in the [3–6-13C]glucose fragment (Fig. 4u and Extended Data Fig. 6i; adapted from ref. 37). Together, these data indicate that MeAVMH circuit activity enhances hepatic gluconeogenesis to increase blood glucose.
Repeated stress blunts the MeA–liver circuit
Finally, we investigated whether glycaemic regulation by the MeA was modified by repeated stress exposure. This is important because stress is known to precipitate metabolic abnormalities, including T2D and obesity38,39,40. We first examined the effects of recurrent acute territorialized cage stress on glucose homeostasis. After a baseline period in a clean cage (5 min), mice were exposed to a conspecific odour in a territorialized cage (2 min) followed by a return to the familiar clean cage (3 min), with this cycle repeated for a total of 5 territorialized cage exposures during a single testing session. A different territorialized cage was used for each stress exposure to prevent habituation to the stressor. As expected, the initial exposure to territorialized cage stress increased blood glucose; however, subsequent exposures had no effect on blood glucose levels (Fig. 5d), though a ceiling effect could prevent further increases. This blunting of stress-induced hyperglycaemia was mirrored by neural activity in the MeA, with the initial exposure robustly increasing MeA activity while subsequent exposures were much less effective (Extended Data Fig. 7a–c). Similarly, the activity of MeAVMH neurons was robustly increased during the initial exposure to territorialized cage stress, but not by subsequent exposures using the same repeated cycle (Fig. 5a–c and Extended Data Fig. 7d). MeAVMH neurons also demonstrated blunting of activity to territorialized cage stress when the interval between exposures was increased from 5 min to every 6–12 h (Extended Data Fig. 7e–h). Their activity was similarly blunted when mice were subjected to twice-daily restraint stress (30 min sessions) over 5 days, which was accompanied by attenuation of MeA FOS expression and stress-induced hyperglycaemia (Fig. 5e,f). These findings suggest that MeAVMH neurons become persistently refractory to stress after initial exposure.
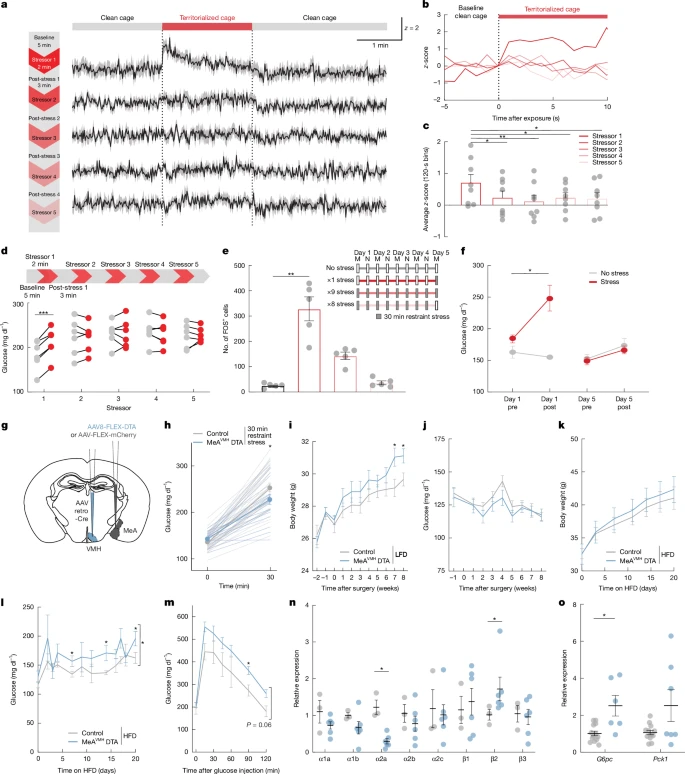
a, GCaMP8s z-scores in a MeAVMH axon before, during and after repeated 2 min territorialized cage stress (red bar). b, GCaMP8s z-scores in MeAVMH axons aligned to the start of each territorialized cage exposure. c, Mean axon GCaMP8s z-score for each exposure period. d, Blood glucose before and after each repeated 2 min territorialized cage stress. e, Quantification of MeA FOS+ cells with 1, 8 or 9 exposures to 30 min of restraint stress or unstressed mice, with timeline of the chronic stress regime. f, Blood glucose before and after the first and last 30 min restraint sessions in the chronic stress regime. g, Schema for chronic silencing of the MeA–VMH circuit. h, Blood glucose in mice treated as depicted in g with 30 min of restraint stress. i,j, Body weight (i) and fed blood glucose (j) in mice treated as depicted in g on low fat (chow) diet (LFD). k–m, Body weight (k), fed blood glucose (l) and blood glucose during GTT (m) in mice treated as depicted in g on high-fat diet (HFD). n,o, Relative expression of adrenergic receptor (n) and gluconeogenic (o) genes in mice treated as depicted in g, on a high-fat diet. Data are mean ± s.e.m. Individual data points represent individual mice. Sample size and statistical analysis in Supplementary Data Table 1.
We investigated the functional implications of the suppressant effects of repeated stress exposure on MeA activity. To this end, we bilaterally depleted MeAVMH neurons by conditionally expressing diptheria toxin subunit A (DTA) in these neurons (Fig. 5g), resulting in a 30% decrease in MeA neurons (Extended Data Fig. 8a). Insulin sensitivity, and glucose and pyruvate tolerance did not differ between MeAVMH-DTA lesioned and control mice (Supplementary Fig. 9o–q). Similarly, plasma insulin, glucagon, corticosterone, adrenaline and noradrenaline levels (Extended Data Fig. 8c–g) and behaviour in the open field test (Supplementary Fig. 9c,d) did not differ between MeAVMH-DTA lesioned and control mice. However, MeAVMH-DTA -depleted mice demonstrated blunted hyperglycaemic responses to restraint (5 min and 30 min) and territorialized cage stressors (5 min) (Fig. 5h, Extended Data Fig. 8b and Supplementary Fig. 9e–n). This is consistent with the attenuated hyperglycaemic response to stress observed in mice after DREADD-mediated acute silencing of MeAVMH neurons. As chronic stress and dietary choices are closely linked41, we examined the impact of depleted MeAVMH neurons in the context of a high-fat diet. We observed no difference in the numbers of FOS+ neurons in the locus ceruleus or coeliac ganglia of unstressed MeAVMH-DTA-depleted mice compared with control mice on a high-fat diet, suggesting that basal central and peripheral sympathetic activity was not significantly altered in the lesioned mice (Supplementary Fig. 9r,s). Sympathetic innervation of the liver acts through α2A adrenergic receptors to inhibit glucagon-induced cAMP and glucose output42 and improve glucose tolerance in obese mice43, whereas β2 adrenergic signalling increases liver glucose output44. We found that MeAVMH-DTA depleted mice had decreased α2A adrenergic receptor expression and increased β2 adrenergic receptor expression in the liver (Fig. 5n), which would be expected to increase liver glucose output. Accordingly, we found that MeAVMH-DTA lesioned mice had higher blood glucose levels and impaired glucose tolerance relative to control mice when given access to a high-fat diet (Fig. 5l,m and Supplementary Fig. 9b). Moreover, liver expression of the gluconeogenic gene G6pc was significantly increased in MeAVMH-DTA lesioned mice (Fig. 5o). MeAVMH-DTA lesioned mice with access to standard chow also had increased body weight relative to control mice, without changes to food intake or glucoregulatory hormone levels (Fig. 5i,j and Extended Data Fig. 8c,d,h–j). This effect on body weight was not further exacerbated when the mice were given access to a high-fat diet (Fig. 5k and Extended Data Fig. 8k). These findings suggest that recurrent stress-induced deficits in the activity of MeAVMH neurons may increase vulnerability to metabolic abnormalities, including weight gain and T2D-like abnormalities in blood glucose levels.
Summary
Stress elicits highly orchestrated metabolic responses that have a crucial role in supporting the behavioural adaptations to stress that are crucial for survival. The neural mechanisms that underlie stress-related metabolic plasticity are largely unknown. Our findings identify a crucial role for a population of hypothalamus-projecting MeA neurons in regulating hyperglycaemic responses to physical and social stressors. Unexpectedly, MeA neurons modulated blood glucose independent of classical adrenal and pancreatic glucoregulatory hormones. We found that MeA neurons provide polysynaptic input to the liver via the sympathetic nervous system to stimulate hepatic gluconeogenesis. Our findings provide compelling evidence that amygdalar circuits orchestrate metabolic responses to stress through the rapid recruitment of liver glucose release. Repeated exposure to stress induced adaptations in the activity of these hepato-regulatory MeA neurons, which precipitated persistently elevated blood glucose levels. If these findings extend to humans, they suggest that dysregulation of MeA signalling contributes to the increased incidence of metabolic dysfunction in individuals subjected to prolonged periods of stress.
Methods
Animals
Mice (8–40 weeks old) were housed under controlled light conditions (12 h light/12 h dark) and temperature (22 °C) and fed ad libitum on standard mouse chow. Mice were randomized to treatment group on the basis of body weight. Unless noted otherwise, all mice were male. Mice were group housed except for studies for food intake measurements. Mice used were: B6.Cg-Gt(ROSA)26Sortm14(CAG-tdTomato)Hze/J, with Cre-dependent tdTomato (Ai14; Jax 007914)45, Vglut2-IRES-cre (Slc17a6tm2(cre)Lowl/J) (Jax 016963)46; Vgat-IRES-cre (Slc32a1tm2(cre)Lowl/J) (Jax 028862)46 and C57BL/6 J (Jax 000664). All mice were housed in a temperature-controlled environment (20–22 °C, 50–60% humidity) with 12 h of light per day at the Center for Comparative Medicine and Surgery (CCMS) at Icahn School of Medicine at Mount Sinai (New York, NY, USA). Animal care and experimental procedures were performed with the approval of the Animal Care and Use Committee of Icahn School of Medicine at Mount Sinai under established guidelines.
General surgical procedures
All surgeries were performed under aseptic conditions. Mice were anaesthetized using 2% isoflurane and the top of the head was shaved then cleaned with 70% ethanol. Ophthalmic ointment was applied to the eyes and subcutaneous injections of buprenorphine (0.05 mg kg−1) were given to each mouse prior to surgery. An incision was made on the midline and small craniotomies were made using a dental drill. Thirty-three gauge syringe needles (Hamilton) were used to unilaterally or bilaterally infuse virus into the brain at a rate of 0.1 µl min−1. The following volumes and coordinates were used: MeA, 0.3–0.5 µl, 1.4 mm posterior, 2.5 mm lateral (2.55 mm if mouse body weight >25 g, 2.6 mm if mouse body weight >30 g), and 5.35 mm ventral from bregma; VMH, 0.3 µl, 1.2 mm posterior, 0.23 mm lateral, and 5.6 mm ventral from bregma; BNST, 0.3 µl, 0.2 mm anterior, 0.85 mm lateral, and 4.3 mm ventral from bregma. Viral expression was confirmed after euthanasia using a fluorescent Zeiss Axio Observer Z.1 microscope to visualize fluorophores and confirm targeting. Mice with misplaced injections or without virus expression were not included in the analysis.
Transneuronal circuit analysis was performed using PRV expressing enhanced green fluorescent protein (GFP) (PRV152). PRV-GFP was injected into the liver of Ai14 mice via a Hamilton syringe (5× 100 nl, 3.96 × 10⁹ pfu ml−1). Seven days after the PRV-GFP injections, mice were euthanized via perfusion and brains dissected and sectioned to visualize PRV-GFP expression.
Viral vectors
We used the following viruses: AAV8-hSyn-hM3D(Gq)-mCherry (gift from B. Roth, Addgene viral prep #50474-AAV8; RRID:Addgene_50474); AAV8.2-synapsin-mCherry (Virovek); AAV8.2-hEF1a-synaptophysin-mCherry (Massachusetts General Hospital Gene Delivery Technology Core, AAV-RN8, RRID:SCR_012544); AAV9-hSyn-FLEX-mGFP-2A-Synaptophysin-mRuby (Addgene viral prep #71760); AAV/retro-RFP (gift from K. Deisseroth, Addgene viral prep #114472-AAVrg, RRID:Addgene_114472); AAV/retro-GFP (gift from B. Roth, Addgene viral prep #50465-AAVrg, RRID:Addgene_50465); AAV2/retro-CAG-Cre-WPRE (Boston Children’s Hospital Viral Core); AAV8-hSyn-DIO-hM3D(Gq)-mCherry (gift from B. Roth, Addgene viral prep #44361-AAV8; RRID:Addgene_44361); AAV8-hSyn-DIO-mCherry (gift from B. Roth, Addgene viral prep #50459-AAV8; RRID:Addgene_50459); AAV8-EF1a-mCherry-flex-dtA (Canadian Neurophotonics Platform Viral Vector Core Facility, RRID:SCR_016477)47; AAV1-hSyn-Cre (gift from J. M. Wilson, Addgene viral prep #105553-AAV1, RRID:Addgene_105553); AAV9-CaMKIIa-hM3D(Gq)-mCherry (Addgene prep #50476); pAAV-hDlx-GqDREADD-dTomato-Fishell-4 (Addgene prep #83897); AAV9-syn-jGCaMP8s-WPRE (Addgene viral prep #162374); AAV9-hSynapsin1-axon-jGCaMP8s-P2A-mRuby3 (Addgene viral prep #172921); AAV9-hSyn-hChR2(H134R)-EYFP (Addgene viral prep #26973); AAV9-hSyn1-EYFP (Addgene viral prep #117382); PRV152 (gift from L. Enquist)48.
Stereotaxic injection and fibre optic implantation
Mice were anaesthetized with 2% isoflurane and placed in a stereotaxic head frame (Kopf Instruments). Ophthalmic ointment was applied to the eyes and subcutaneous injections of meloxicam (5 mg kg−1) and Enrofloxacin (5 mg kg−1) were given to each mouse prior to surgery. The scalp was shaved and scrubbed with iodine and alcohol and an incision made on the midline. A craniotomy was made using a dental drill (0.5 mm) above the MeA, VMH or BNST.
For photometry experiments, a craniotomy was made above the MeA at the following coordinates AP: −1.4 mm, ML: +2.5 mm, DV: 5.35 mm from bregma. A 0.3 µl volume of AAV9-syn-jGCaMP8s-WPRE was injected at a rate of 100 nl min−1 using a 10 µl Hamilton syringe controlled by a micro-injector. The needle remained in the injection site for 2 min following completion of delivery before being raised 0.1 mm for a further 2 min before being completely retracted. A fibreoptic cannula (MFC_400/430-0.66_6mm_MF1.25_FLT) (Doric) was implanted 0.2 mm dorsal to viral injection during the same surgery and was secured to the skull using dental cement (Pearson Dental) and three screws (Plastics One).
For axon-specific calcium imaging, a craniotomy was made above the MeA at the following coordinates AP: −1.4 mm, ML: +2.5 mm, DV: 5.35 mm. 0.3 µl of AAV9-hSynapsin1-axon-jGCaMP8s-P2A-mRuby3 was injected at a rate of 100 nl min−1 using a 10 µl Hamilton syringe controlled by a micro-injector. The needle remained in the injection site for 2 min following completion of delivery before being raised 0.1 mm for a further 2 min before being completely retracted. A second craniotomy was made using a dental drill (0.5 mm) at the following coordinates: VMH 1.2 mm posterior, 0.23 mm lateral, and 5.6 mm ventral from bregma; BNST 0.2 mm anterior, 0.85 mm lateral, and 4.3 mm ventral from bregma. A fibreoptic cannula (MFC_400/430-0.66_6mm_MF1.25_FLT) (Doric) was implanted 0.2 mm dorsal to region of interest during the same surgery and was secured to the skull using dental cement (Pearson Dental) and three screws (Plastics One).
For optogenetic stimulation of MeA cell bodies, a craniotomy was made using a dental drill (0.5 mm) at the following coordinates AP: −1.4 mm, ML: +2.5 mm, DV: 5.35 mm. 0.3 µl of pAAV9-Syn-ChR2(H134R) was injected at a rate of 100 nl min−1 using a 10 µl Hamilton syringe controlled by a micro-injector. The needle remained in the injection site for 2 min following completion of delivery before being raised 0.1 mm for a further 2 min before being completely retracted. A 1.25 µm, NA 0.66 fibreoptic (MFC_400/430-0.66_6mm_MF1.25_FLT) (Doric) was implanted unilaterally 0.2 mm dorsal to viral injection during the same surgery.
For stimulation of MeA projections, optical fibres were unilaterally implanted over MeA terminal regions at the following coordinates VMH 1.2 mm posterior, 0.23 mm lateral, and 5.6 mm ventral from bregma; BNST 0.2 mm anterior, 0.85 mm lateral, and 4.3 mm ventral from bregma. Fibreoptics were secured to the skull using dental cement (Pearson Dental) and three screws (Plastics One). Mice were allowed at least 6 weeks for recovery and to facilitate sufficient viral expression prior to any experimental procedures.
Fibre photometry
Mice were tethered to a patch cable (Doric Lenses, MFP_400/430/1100-0.57_3m_FCM-M1.25). Calcium signals were collected using the Doric Fluorescence MiniCube and fibre photometry console at a sampling frequency of 12 kHz using Synapse software (v.98, Tucker-Davis Technologies). GCaMP calcium signal (465 nm) and UV isosbestic signal (405 nm) were collected through the same fibre and equalized to record an equivalent signal:noise ratio. MATLAB (v.2022b, Mathworks) scripts provided by Tucker-Davis Technologies were used to down-sample and normalize the fluorescence signal. For projection specific calcium imaging, photobleaching was corrected using double exponential fit. The 405 isobestic fluorescence signal was filtered using a polyfit regression giving a fitted control (F405c). ΔF/F was calculated by subtracting F405c from the GCaMP fluorescence signal (F405) and then dividing by F405c(F465 – F405c)/F405. A z-score conversion was used to calculate the deviation of the resulting ΔF/F from the averaged signal of the entire recording session.
Restraint stress
Mice were tethered to the patch cable, and a 5 min baseline recording was collected. Mice were then restrained in plastic 50-ml conical tubes (Fisher Scientific) with holes that were modified to account for the patch cable tethering. Calcium transients were recorded for 5 or 30 min while the mouse remained secured. After the restraint, the mouse was released and recording continued for an additional 15 min. When noted, blood glucose was measured every minute for the duration of a 5 min restraint stress or every 5 min for the duration of a 30 min restraint stress to assess the time course of stress-induced hyperglycaemia.
Territorialized cage stress
Mice were tethered to a patch cord, placed in a clean novel cage with bedding, and recording started. A 5 min baseline was collected in the ‘clean’ novel cage before the mouse was manually picked up by the base of the tail and placed in a novel territorialized cage that was previously occupied by 5 males for 1 week. The mice remained in this cage while calcium transients were recorded for 5 or 30 min before the mouse was placed back in the previous clean cage for 5 min. To examine the effects of repeated stress, a cycle of 2 min of territorialized cage exposure, followed by 3 min of clean cage exposure was repeated for a total of 5 novel territorialized cage exposures. To examine the effects of intermediate stress, mice were exposed to a novel territorialized cage for 5 min at intervals of 0 h, 6 h, 12 h and 24 h from the initial territorialized cage exposure. When noted, blood glucose was measured every minute for the duration of a 5 min territorialized cage stress or every 5 min for the duration of a 30 min territorialized cage stress to assess the time course of stress-induced hyperglycaemia.
Footshock stress
To examine the effect of an acute physical stressor, mice were exposed to a mild footshock. Mice were tethered to a patch cord and placed into a fear conditioning chamber. A 5 min baseline was collected before a 1 s, 1 mA footshock was delivered. The calcium transients were recorded during the shock and post shock for at least 2 min. We scored the calcium response at the time of the shock.
Robobug stress
To examine the effect of an acute visual stressor, mice were tethered to a patch cord and placed into an open field arena. After 5 min, a remote-controlled spider (robobug) was introduced into the open field and began to pursue the mouse at random intervals. The calcium transients were recorded during the approach and post-approach for at least 1 min. We scored the calcium response at the time of the approach.
Continuous glucose monitoring
Continuous glucose monitoring was performed in a subset of mice during calcium imaging and stress exposure. In brief, under isoflurane anaesthesia, hair was removed from the flank of the mouse and a 2 mm incision made in the skin. The cannula of the continuous glucose monitor (Abbott Freestyle Libre 2) was inserted into the incision and the adhesive tape on the monitor firmly applied to the skin. Discontinuous sutures around the sensor attached the adhesive tape to the skin. The sensor was activated, and mice were allowed to recover for 24 h before fibre photometry and stress exposure.
Optogenetics
Photostimulation was performed with 10 ms pulses given at 20 Hz for 2 s, repeated every 2 s. The output beam from a 473 nm diode laser (Thorlabs) was controlled by a microcontroller (Uno, Arduino, IDE 2.3.1) running a pulse generation script. The laser was coupled to a 200 µm, NA 0.66 multimode optical fibre (MFC_400/430-0.66_6mm_MF1.25_FLT) (Doric) using a 1.25 mm mating sleeve (Thorlabs) that allowed delivery of the light into the brain by coupling to the implanted fibre optic. Laser power was measured using an optic power meter (Thorlabs) and set at 5 mW.
Metabolic studies
In each experiment, mice were tethered to a patch cable, placed in an open field arena, and habituated for at least 1 h to account for the handling stress. For basal glucose measurements during optogenetic modulation, mice were fasted for 6 h and tail vein samples for blood glucose were taken at 0, 5, 15 and 30 min after the initiation of stimulation. To measure tolerance to a glucose challenge, mice were fasted for 6 h and tail vein samples for blood glucose were taken at 0, 15, 30, 45 and 60 min after injection of glucose (2 mg kg−1 body weight) and the initiation of stimulation. To measure gluconeogenic capacity, mice were fasted for 4 h and tail vein samples for blood glucose were taken at 0, 15, 30, 45 and 60 min after intraperitoneal injection of pyruvate (2 g kg−1 body weight, Sigma P5280). Data are shown as the change in blood glucose from baseline (immediately before stimulation).
Stress studies
In each experiment, mice were tethered to a patch cable, placed in an open field arena, and habituated for at least 1 h to account for the handling stress. Mice were exposed to both restraint and territorialized cage stress as described above. For stressed glucose measurements during optogenetic modulation, mice were fasted for 6 h, and tail vein samples for blood glucose were taken at 0, 5, 15, 30 min. For 5 min stressors, the mice were optogenetically stimulated for 5 min, beginning at the initiation of stress. For 30 min stressors, the mice were optogenetically stimulated for 15 min, beginning at the initiation of stress.
In vivo chemogenetic behavioural testing
Mice were handled for 5–10 days before experiments. Following stereotaxic surgeries, mice were allowed to recover for 3–6 weeks before the start of testing. Where applicable, CNO (Sigma, NIH) was dissolved in 10% DMSO in saline and delivered at a dose of 3 mg kg−1, intraperitoneal injection. Investigators were blinded to treatment groups.
Restraint stress
Mice were fasted for 6 h and then either briefly handled and returned to home cage (controls) or restrained in a 50-ml falcon tube with a hole cut for air at the conical end for 5 or 30 min. For 5 min restraint experiments, blood glucose was measured before the initiation of stress, after the 5 min restraint, and 30 min after the initiation of the stress. For 30 min restrain experiments, blood glucose was measured before and after the 30 min restraint period. To measure the hormonal or gene expression responses to stress, mice were rapidly anaesthetized with 3% isoflurane at the end of the restraint period and blood or tissue collected. To measure FOS in the MeA after restraint stress, mice were anaesthetized with 3% isoflurane and perfused transcardially with 0.1 M phosphate buffered saline (PBS) followed by 10% formalin, and the brain was removed 2 h after the start of the restraint. For DREADD modulation studies, CNO was administered 30 min before restraint.
Repeated restraint stress
To determine the effects of chronic repeated restraint stress on blood glucose, blood glucose was measured before and after a 30 min restraint stress at 12 h intervals for a total of 9 restraint sessions. To measure FOS in the MeA after chronic restraint stress, mice were anaesthetized with 3% isoflurane and perfused transcardially with PBS followed by 10% formalin, and the brain was removed 2 h after the start of the restraint.
Territorialized cage stress
Mice were placed in a dirty cage previously occupied by five male mice for one week. Blood glucose or food intake was measured before and after the 5 or 30 min period of territorialized cage exposure. For blood glucose measurement, mice were fasted for 6 h. To measure food intake, mice were food-deprived overnight before being placed in the territorialized cage. For DREADD modulation studies, CNO was administered immediately before the test.
Food intake studies
Mice were food-deprived overnight or food-deprived for 6 h in the light phase or allowed to eat ad libitum. Food, either in the form of standard rodent chow or palatable food (peanut butter) was then provided in excess, and consumption of food was measured every hour. For DREADD modulation studies, CNO was administered immediately before food was provided.
Metabolic studies
For baseline glucose measurements after DREADD modulation, mice were fasted for 6 h, and tail vein samples for blood glucose were taken at 0, 30, 60 and 90 min after intraperitoneal injection of CNO. To measure tolerance to a glucose challenge, mice were fasted for 6 h and tail vein samples for blood glucose were taken at 0, 10, 20, 30, 45, 60, 90 and 120 min after injection of glucose (2 mg kg−1 body weight). When noted, additional blood was collected at 0, 10, 30, 60 and 90 min after glucose injection to measure plasma insulin and glucagon. To measure insulin sensitivity and tolerance to an insulin challenge, mice were fasted for 4 h and tail vein samples for blood glucose were taken at 0, 30, 60, 90 and 105 min after injection of insulin (0.4–0.6 U kg−1 body weight, Humulin R HI-210). To measure gluconeogenic capacity, mice were fasted for 4 h and tail vein samples for blood glucose were taken at 0, 30, 45, 60, 90 and 105 min after intraperitoneal injection of pyruvate (2 g kg−1 body weight, Sigma P5280). For all metabolic challenges, CNO was injected 30 min before the challenge (timepoint 0).
Open field activity
Locomotion and anxiety-like behaviour were measured in either a clear plexiglass 40 × 40 × 30 cm open field arena using Fusion Software (v5.0) (Omnitech Electronics) or a white acrylic 18 × 18 × 18 in arena using Ethovision XT (version xt13, Noldus Information Technology) to quantify behaviour. Distance travelled and time spent in the center of the open field arena were measured. Open field testing lasted 10 min. For DREADD modulation studies, CNO was administered 60 min before the start of the test.
Elevated plus maze and light-dark box
The light-dark box test was performed in a 40 × 40 × 30 cm arena with a black box placed on half of the arena to shield it from light. The mice were placed in the light portion and tracked using Fusion Software. For the elevated plus maze, the mice were placed on an open arm of an elevated four-arm maze in which two arms are open and two are enclosed. They were tracked using Ethovision software and total time spent in the open arm was measured. Elevated plus maze and light-dark box testing lasted 10 min.For DREADD modulation studies, CNO was administered 60 min before the start of the test.
High-fat diet
Mice with MeAVMH expression of DTA or mCherry were fed a high-fat diet (Research Diets, D12492; 60% fat). Food intake, body weight and blood glucose were measured every 3–7 days for 20 days.
Metyrapone studies
To pharmacologically block corticosterone production, mice were injected with metyrapone (50 mg kg−1, subcutaneous injection, dissolved in 5% Tween 80, Tocris Bioscience) or vehicle 60 min before the initiation of restraint stress, basal glucose measurements, or glucose administration during GTT. For DREADD modulation studies, CNO was administered 30 min before the start of the test.
Neuronal tracing
To trace MeA projection circuits, an injection of AAV8.2-hEF1a-synaptophysin-mCherry was unilaterally injected into the MeA. After 4–6 weeks to allow viral expression, brains were collected and prepared for imaging as described in the Immunohistochemistry section. Sections from the whole brain were imaged to allow unbiased selection of MeA projection targets. After mCherry-labelled regions were identified, fluorescence intensity was quantified.
To determine axonal projection overlap in the MeA, mice were injected with AAVretro-GFP into the VMH and AAVretro-RFP into the BNST to differentially label MeA neurons that project to the VMH and MeA neurons that project to the BNST. Expression of GFP and of RFP in the MeA was quantified to determine axonal projection overlap.
To determine MeA projection circuit specificity, mice were injected with a AAVretro-GFP into the VMH and AAVretro-RFP into the BNST to differentially label MeA neurons that project to the VMH from MeA neurons that project to the BNST. These mice were exposed to a 30 min restraint stress. To measure FOS in the MeA after restraint stress, mice were anaesthetized with 3% isoflurane and perfused transcardially with PBS followed by 10% formalin, and the brain was removed 2 h after the start of the restraint. Co-expression of the projection specific GFP or RFP and of FOS in the MeA was quantified to determine the response to stress in the MeA→VMH projection and in the MeA→BNST projection.
For polysynaptic circuit tracing of MeAVMH to peripheral organs, Ai14 mice were injected with AAV1-Cre into the MeA. After 4-weeks to allow viral expression, mice were injected with PRV152-GFP into the liver. Seven days after the injection of the PRV-GFP, these mice were perfused, and the brains were collected. Co-expression of monosynpatic anterograde RFP expression from the MeA and of polysynaptic retrograde GFP expression from the liver was quantified in the VMH to determine the overlap of neurons that project from the MeA to the VMH and have a polysynaptic connection to the liver.
Vglut2-cre or Vgat-cre mice were injected with a AAV9-hSyn-FLE-mGFP-2A-Synaptophysin-mRuby to determine cell-type specificity of MeA neurons that project to its downstream regions. Expression of mRuby in Vglut2-cre mice was used to determine the proportion of glutamateric neurons that project from the MeA to the VMH, BNST, lateral hypothalamus and medial preoptic area. Expression of mRuby in Vgat-cre mice was used to determine the proportion of GABAergic neurons that project from the MeA to the VMH, BNST, lateral hypothalamus and medial preoptic area.
Cell-type-specific chemogenetic activation
Mice were injected with a AAV9-CaMKIIa-hM3D(Gq)-mCherry, a AAV9-hDlx-GqDREADD-dTomato-Fishell-4, or a AAV9-hSyn-mCherry into the MeA. Mice were allowed 6 weeks for viral expression. For baseline glucose measurements after DREADD modulation, mice were fasted for 6 h, and tail vein samples for blood glucose were taken at 0, 30, 60, 90 min after intraperitoneal injection of CNO (3 mg kg−1). The response to DREADD activation driven by the CAMKIIa promoter or driven by the Dlx promoter was compared to mCherry-expressing control mice to determine the contribution of excitatory or GABAergic neurons to changes in blood glucose.
Tissue processing
Blood glucose was determined using a Contour or Contour Next EZ glucometer (Bayer).
Blood for plasma hormones was collected in an EDTA-coated tube (Sarstedt Microvette CB 300 K2E 16.444.100), spun for 10 min at 2,000 rpm, 4 °C, and plasma was separated and stored at −80 °C until assay. Plasma levels of insulin (Mercodia 10-1247-01), glucagon (Crystal Chem 81518), corticosterone (Crystal Chem 80556), adrenaline and noradrenaline (Abnova KA1877) were determined by ELISA. Liver glycogen was determined by colorimetric assay (Abcam ab169558). Circulating glycerol and triglyceride levels were measured by enzymatic assay (Sigma-Aldrich TR0100). SpectraMax i3x, (Molecular Devices) with SoftMax Pro (v.7.1.2) were used for ELISA detection.
To examine protein levels or gene expression, liver was collected immediately after 30 min restraint or territorialized cage stress. For DREADD modulation studies, CNO was administered 60 min before the collection of liver tissue. MeAVMH hM3DGq-expressing and corresponding control mice were unstressed. MeAVMH hM4DGi and corresponding control mice were 4 h fasted and exposed to a 30 min restraint stress with liver tissue collected immediately after the restraint stress. Liver tissue was flash frozen in liquid nitrogen for gene expression analysis, glycogen and protein analyses, aliquoted and stored at −80 °C until processing.
Western blot
Liver tissue (~20 mg) was lysed in 600 µl buffer (20 mM Tris, pH 7.4, 150 mM NaCl, 2% Nonidet P-40, 1 mM EDTA, pH 8.0, 10% glycerol, 0.5% sodium deoxycholate, 0.2% semi-dehydroascorbate) supplemented with halt protease and phosphatase inhibitor (Cell Signaling). Livers were first homogenized using Beadbug (Benchmark) and lysates were further sonicated in ice-cold water for 5 min. After centrifuging at 14,000 rpm at 4 °C for 10 min, the protein supernatants were transferred to a new tube and protein concentration was determined by BCA protein assay kit (Pierce). Thirty micrograms of protein was mixed with 6× SDS sample buffer (BP-11R, Boston BioProducts) and boiled for 5 min before loading on SDS–PAGE. The Bio-Rad wet transfer system was used to transfer proteins for western blotting. PVDF membranes were blocked with 5% dry milk in TBST (TBS + 0.05% Tween 20) and further incubated with primary antibodies (dilute in TBST with 3% BSA + 0.05% NaN3) at 4 °C overnight. PCK1 (ab70358), PGC1a (ab54481), FoxO1 (ab39670), GAPDH (ab9485) antibodies were from Abcam. G6PC (NBP1-80533) was from Novus Biologicals. All primary antibodies were used at 1:1,000 dilution. The membrane was washed 4 times in TBST with shaking for 10 min prior to incubation with secondary antibodies (HRP Goat anti-rabbit IgG (Thermofisher, 31460, 1: 10,000) and HRP Goat anti-mouse IgG (Thermofisher, 31430,1: 10,000 in TBST)) for an additional 2 h at room temperature. Immune complexes were washed 4 times in TBST with shaking for 10 min at room temperature. Membranes were further reacted with Pierce ECL western blotting substrate and imaged with iBright CL1500 (Thermofisher). Western blots were quantified by Image J (v.1.53k).
Quantitative PCR
Total RNA was extracted from tissue by homogenization in Trizol (Invitrogen) followed by chloroform (Sigma) extraction and isolation using the RNeasy Plus Mini (Qiagen) kit according to manufacturer’s instructions. Complimentary DNA was prepared by reverse transcription of 500 ng total RNA using qScript cDNA SuperMix (Quantabio). The resulting cDNAs were diluted 1:10 then amplified by real-time PCR using the SYBR green system (Applied Biosystems) according to the manufacturer’s protocols. Data were analysed with Quantstudio Design and Analysis software (v.1.5.2). All mRNA expression data were normalized to Rpl23 expression in the corresponding sample. Fold change in mRNA expression was calculated using the delta-delta Ct method49. The follow primers were used: Pck1 forward GCGAGTCTGTCAGTTCAATACC, reverse GGATGTCGGAAGAGGACTTTG; G6Pc forward GGAGGCTGGCATTGTAGATG, reverse TCTACCTTGCTGCTCACTTTC; Rpl23 forward ACTTCCTTTCTGACCCTTTCC, reverse TTAGCTCCTGTGTTGTCTGC; Pgc1a forward TGAGGACCGCTAGCAAGTTT, reverse TGTAGCGACCAATCGGAAAT; FoxO1 forward GCGTGCCCTACTTCAAGGATAA, reverse TCCAGTTCCTTCATTCTGCACT; Glut2 forward GTTGGAAGAGGAAGTCAGGGCA, reverse ATCACGGAGACCTTCTGCTCAG; Irs2 forward CCAGTAAACGGAGGTGGCTACA, reverse CCATAGACAGCTTGGAGCCACA; Igfbp1 forward GCCCAACAGAAAGCAGGAGATG, reverse GTAGACACACCAGCAGAGTCCA; Adra1a forward CTAAGGCCATTCTACTTGGGGT, reverse CGAGTGCAGATGCCGATGA; Adra1b forward GTCGGAATGTTCATCTTATGTTGG, reverse CAGCCAGAACACTACCTTGA; Adra2a forward CCTGCTTTGACATTTCCTGAC, reverse TCATTTCCTTCTGCCTTGGTC, Adra2b forward AGACCTCATCCTCAGACACC, reverse TCCAAGCTACCCTTCCTGAA; Adra2c forward GCTGACTTCCTATGACCTGAA, reverse TTGGCTGTCATTGTATTTGGC, Adrb1 forward CTCATCGTGGTGGGTAACGTG, reverse ACACACAGCACATCTACCGAA; Adrb2 forward TCGCTATGTTGCTATCACATCG, reverse GCCAGATACAATCCATACCATCA; Adrb3 forward GGCCCTCTCTAGTTCCCAG, reverse TAGCCATCAAACCTGTTGAGC.
Stable flux isotope analysis
Optogenetic mice that either expressed AAV9-hSyn-hChR2(H134R)-EYFP or AAV9-hSyn1-EYFP were tethered to a patch cable and habituated to an open field arena for at least 1 h. The mice were pre-stimulated for 15 min, administered with a 2 g kg−1 intraperitoneal injection of labelled [2,3-13C]pyruvate (Sigma 490717), and stimulated for 15 min. Immediately following the period of stimulation, the liver was collected and flash frozen.
Liver tissue was collected to determine the flux through the gluconeogenic metabolic pathway by measuring how the stable isotope is incorporated into metabolites. Liver cells were isolated and incorporated into a media, collected to a screw vial, and snap frozen in liquid nitrogen. Following thawing on ice, 200 μl of the media was added to 800 μl of methanol. After a brief vortex, the media was centrifuged at 13,100g for 10 min at 4 °C. The supernatant was transferred to a glass vial and dried under gentle nitrogen flow. The samples were then subjected to a 2-step derivatization with 50 μl of methoxyamine hydrochloride (MOA, 15 mg ml−1 in pyridine) at 30 °C for 90 min, and then incubated with 50 μl of N,O-bis(trimethylsilyl)trifluoroacetamide (BSTFA, containing 1% TMCS) at 70 °C for 60 min. The samples were analysed by gas chromatography–mass spectrometry (GC (8890)-MS (5977B), Agilent). The data was first processed with MassHunter software (v.10.2, Agilent). The mass-to-charge ratio used for the metabolites are 245 for fumarate, 465 for citrate, 335 for malate, 334 for aspartate, 445 for glycerol-3-phosphate, 160 for the glucose fragment of carbon position 1 and 2, and 319 for the glucose fragment of carbon 3 to carbon 6. Isotope enrichment calculation (background correction) was performed as described50.
Isotope enrichment calculations were performed, including correction of measured mass isotopomer distributions for contributions from natural isotope abundances51. Glucose mass isotopomers in glucose, and glucose metabolites (glycolytic and TCA cycle intermediates) are reported as molar fractions of M0, M1, M2, etc., according to the number of labelled carbons in the molecule52. The sum of all isotopomers of the molecules, mi for 1 to n (n = 3, 5 or 6 for pyruvate, citrate or glucose, respectively), equal to 1 or 100%. The labelled isotopomer fractions consist of a distribution not affected by the dilution with unlabelled compounds, reported as mi/ Smi, as a percentage. The enrichment sigma Mn, (SMn) is the weighted sum of the labelled species (SMn = 1M1 + 2M2 + 3M3 + 4M4 + 5M5 + 6M6) = average number of 13C carbons per molecule = 6 for U13C glucose (SMn with only M6 nonzero, and equal to 1) as previously reported52,53.
Immunohistochemistry
Brains
Mice were anaesthetized with 3% isoflurane and perfused transcardially with PBS followed by 10% formalin. The brains were post-fixed in 10% formalin at 4 °C overnight, then washed in PBS at 4 °C overnight. 50 μm coronal slices were cut by vibratome (Leica VT1000). For FOS staining, slices were incubated in blocking solution overnight at 4 °C (3% normal donkey serum (NDS, Sigma) in 0.01% Triton X-100 in 0.01 M PBS (PBT)) and then in primary antibody in blocking solution at 4 °C. The following primary antibodies, concentrations, and incubation periods were used: Cell Signaling rabbit monoclonal anti-FOS (2250), 1:500 for 72 h; abcam chicken polyclonal anti-mCherry (ab205402), 1:1,000 overnight or with Abcam chicken polyclonal to tyrosine hydroxylase (ab76442), 1:500 for 72 h. The slices were then washed in 0.01 M PBS (3× 1 h), incubated in secondary antibody in blocking solution for 2 h at room temperature, and washed in PBS (2× 1 h), with a final wash overnight at 4 °C. The following secondary antibodies and concentrations were used: Jackson Alexa Fluor 647 AffiniPure donkey anti-rabbit (711-605-152), 1:250; Jackson Alexa Fluor 594 AffiniPure donkey anti-chicken (703-585-155), 1:2,000.
For RFP or mCherry staining to enhance endogenous fluorescence of AAV/retro-RFP, AAV8-hSyn-DIO-hM3D(Gq)-mCherry and AAV8.2-hEF1a-synaptophysin-mCherry, slices were washed in 0.01 M PBS (3× 10 min), incubated in blocking solution (3% NDS in 0.01% PBT) for 1 h at room temperature, incubated in primary antibody (Rockland rabbit polyclonal anti-RFP (600-401-379), 1:1,000) overnight at 4 °C, washed in 0.01% PBT (3× 10 min), incubated in secondary antibody (Invitrogen donkey anti-rabbit Alexa Fluor 594 (A-21207), 1:500), and washed in PBS (3× 10 min). For GFP staining to enhance endogenous fluorescence of AAV/retro-GFP or PRV-GFP, slices were washed in 0.01 M PBS (3× 10 min), incubated in blocking solution (3% NDS in 0.01% PBT) for 1 h at room temperature, incubated in primary antibody (Abcam goat polyclonal anti-GFP (ab5450), 1:1,000) overnight at 4 °C, washed in 0.01% PBT (3× 10 min), incubated in secondary antibody (Invitrogen donkey anti-goat Alexa Fluor 488 A-11055, 1:500) and washed in PBS (3 ×10 min).
Locus ceruleus
Brainstems were sectioned from MeA→VMHhM3DGq or mCherry control mice euthanized 2 h after CNO administration. The sections were stained as described above for the expression of tyrosine hydroxylase and for the expression of FOS.
Coeliac ganglia
The coeliac ganglia were dissected from MeA→VMHhM3DGq or mCherry control mice euthanized 2 h after CNO administration. The tissue was post-fixed in 10% formalin at 4 °C overnight, cryo-protected in 30% sucrose (Sigma-Aldrich, 50389) in PBS, embedded in O.C.T. Compound (Thermofisher Scientific, Watham, MA; 23-730-572), frozen at −80 °C, and sectioned at 10 µm thickness. Slides were washed in 0.03% PBT (3× 5 min), incubated in blocking solution overnight at 4 °C (2% normal donkey serum, 3% bovine serum albumin in 0.03% PBT), incubated in primary antibodies for 48 h at 4 °C (Cell Signaling anti-FOS, 1:100; abcam chicken polyclonal to tyrosine hydroxylase (ab76442), 1:500), washed in 0.03% PBT (3× 5 min), incubated in secondary antibodies for 2 h at room temperature (Jackson AF-647 donkey anti-rabbit, 1:250; Jackson AF-594 donkey anti-chicken, 1:500), and washed in 0.03% PBT (3× 5 min). After staining, tissue sections were mounted with DAPI counterstain (Fluoromount).
Verification of viral expression and fibre placement
Mice were transcardially perfused with PBS followed by 10% formalin. Brains were removed and post-fixed overnight in formalin at 4 °C and then washed overnight in PBS at 4 °C. Coronal brain sections were cut (50-μm sections) on a vibratome. The brain sections were stained according to the above protocol. Confocal images were taken using Zeiss LSM 780 confocal microscope using Zen software (Zen 2012 SP5) to verify fibre placements and viral expression.
Image quantification
All confocal images were taken at 20× and tiled. All image analyses were performed using Image J (v.1.53k) or Fiji (v.2.14.0) with JaCOP plugin. Investigators were blinded to treatment groups for FOS analyses.
Synaptophysin-mCherry
4 weeks after stereotactic surgery, mice were perfused, and brains were sliced and stained to enhance mCherry staining. Confocal images were then taken using a Zeiss LSM 780 confocal microscope. Regions of interest (ROI) were drawn on the basis of DAPI staining and the Allen mouse brain atlas54 (https://mouse.brain-map.org/static/atlas) and Franklin and Paxinos mouse brain atlas55 (https://labs.gaidi.ca/mouse-brain-atlas/). The same selection was used for each brain region to normalize for area analysed and fluorescence intensity was measured within the ROI. Values are reported as median pixel intensity ± standard error of the median.
FOS in the brain
z-stack confocal images were taken using an upright LSM 900 (restraint versus control). To measure FOS expression after stress, an ROI was drawn around the MeA complex, including the dorsal, ventral, and basomedial subregions. Images were made binary and cell quantification was performed using the ‘analyze particle’ function. The JaCOP plugin56 was used to measure total expression of FOS after restraint stress or control, overlap of FOS with AAV/retro-RFP (BNST-projecting neurons) and AAV/retro-GFP (VMH-projecting neurons) and overlap of FOS with tyrosine hydroxylase in the locus ceruleus.
FOS in the locus ceruleus and in the coeliac ganglia
z-stack confocal images were taken using a Zeiss LSM 900 using Zen software (Zen 2012 SP5). Tyrosine hydroxylase (TH) expression was used as a mask to select an ROI of only neurons. Then overlap of FOS and DAPI was measured using the JaCOP plugin. Data is reported as number of FOS+ DAPI particles.
Spatial transcriptomics
Spatial transcriptomics was performed using the Xenium assay (10X Genomics). Mice were injected with a AAVretro-mCherry into the VMH. After 4 weeks to allow viral expression, the mice were perfused, and brains were collected. Brains were post-fixed overnight and then paraffin-embedded. In brief, formalin-fixed, paraffin-embedded blocks with coronal embedded mouse brains were sectioned at 5 μm (Leica Histocore biocut), placing 3 brain sections per Xenium slide; serial sections were cut onto on standard charged slides and used for Immunofluorescence Control Slides. Xenium slides were baked for 3 h at 42 °C for section adherence and stored in desiccator until use (no more than 4 weeks). Xenium Slides were deparaffinized and decrosslinked, then processed according to the manufacturer’s V1 protocol using the Mouse Brain panel modified with 100 custom gene targets (Supplementary Data Table 2, S1), hybridized for 20 h, and run on the Xenium instrument.
Post-Xenium slides were stored in 1,000 µl PBS-T (0.05%) for one day at 4 °C. In parallel, immunofluorescence control slides were deparaffinized and decrosslinked using the same conditions and reagents as previously described for Xenium slides. PBS-T was removed, and slides were washed with 500 µl of PBS-T for a total of three washes, 1 min each. Blocking Buffer was prepared as a solution consisting of 1× PBS pH 7.4, 0.1% of Tween- 20, 10% heat-inactivated FBS, and 10 mg ml−1 dextran sulfate and slides were blocked for 1 h at room temperature. Slides were incubated with Rabbit anti-mCherry primary (Rockland 600-401-379 s, 1:500) in blocking buffer overnight at 4 °C. Slides were washed 3× 10 min in PBS-T and then incubated with Donkey anti-rabbit AlexFluor 694 (Jackson AF-647 donkey anti-rabbit) secondary antibody for 2 h at room temperature (1:250). Slides were washed 3 times for 10 min each in PBS-T and mounted in Fluoromount-G (ThermoFisher Scientific 00-4958-02) followed by imaging with a EVOS S1000 imager with EVOS S1000 Spatial Imaging Software (v.1.0, ThermoFisher Scientific).
Sample processing and cell classification using Xenium spatial data
The starting gene by cell raw count matrices and cell segmentation polygons for the 12 spatial transcriptomic samples were generated by Xenium Onboard Analysis. This data was further analysed in R (v.4.4.2), using the Giotto Suite (v.4.2.1)57. Cells with fewer than ten unique genes present were removed. In each sample, the cells corresponding to the two MeA regions were manually selected using the plotInteractivePolygons tool in Giotto. The 24 ROIs contained a total of 21,607 cells. Gene expression normalization was performed using the default Giotto parameters. Cell-type annotation was achieved by Leiden clustering (resolution = 0.25) followed by cell-type-specific marker enrichment analysis (Supplementary Data Table 2, S3). As a result, the initial 15 clusters were merged into 7 cell types with 8 cell clusters annotated as neurons. One cluster that had more than one cell-type signature enriched was annotated as “Other”. The neuronal subset was further subclustered (resolution = 0.5), and a subset of 141 cells (3 smallest clusters) with mixed cell-type signature were removed and relabelled as ‘Other’, leading to a total of 12,512 cells being classified as neurons, distributed across 20 neuronal clusters. Cluster marker genes were identified using scran58 method in Giotto (false discovery rate (FDR) ≤ 0.0001 and log2(fold change) ≥ 0.378). Neuronal subtypes were annotated on the basis of the expression levels of known glutamatergic (Vglut1 and Vglut2) and GABAergic (Vgat) neuronal markers.
mCherry signal analysis and DEGs from Xenium spatial data
Post-Xenium DAPI images were aligned with the spatial transcriptomic sample coordinates using 10X Xenium Explorer software (v.3.2.0). The coordinate-transformed mCherry immunofluorescence images were used as input to the Giotto calculate OverlapPolygonImages method to extract pixel intensities corresponding to the area occupied by each cell. Pixel intensities range was [0,255]. The background pixel intensities for each cell were extracted from a square region 60 mm across (±30 mm from cell centroid position) but excluding the cell itself. The cell mCherry signal enrichment score (RES) was computed as
The RES values were further converted to z-scores followed by thresholding, with mCherry+ cells determined by z ≥ 2 and mCherry− cells determined by z < 0.5. The mCherry+ set contained 401 cells (305 neurons) and the mCherry− set contained 19,042 cells (10753 neurons). Genes that were differentially expressed between mCherry+ and mCherry− cells within each neuronal cluster were identified using the scran method (FDR ≤ 0.1, and log2(fold change) ≥ 0.5). Global mCherry+ versus mCherry− differential genes were identified via the Nebula59 R package on all neurons simultaneously, by using the neuronal cluster assignment as a covariate in the model. Significant DEGs were selected as FDR < = 0.01 and log2(fold change mCherry) ≥ 0.3.
Quantification and statistical analysis
All data are presented as mean ± s.e.m. unless otherwise indicated. No statistical methods were used to pre-determine sample sizes, but our sample sizes are similar to those reported in previous publications23,60. Where possible, in vivo data were collected and analysed by an investigator blinded to the treatment group, but this was not always possible given the familiarity with the subjects. Determining whether injection sites were valid for inclusion or exclusion was determined by an investigator blinded to the results for that mouse. For histology, hormone, protein and RNA and metabolomic analyses, investigators were blinded to the group or treatment until data processing for group comparisons.
Injection sites were visualized and verified following behavioural experiments. Mice were excluded for virus expression outside of the MeA or for insufficient virus expression within the MeA. All mice in the Cre-independent DREADD activation experiment (Fig. 1k–o, Extended Data Fig. 2g–n and Supplementary Fig. 3a–j) showed viral spread into the lateral hypothalamus; data shown are from DREADD mice with >60% virus expression in the MeA.
Analyses were performed in RStudio or with Prism (v.10.3.1, Graphpad). Analyses in R were performed with R 3.6 using the lme4, lmerTest, emmeans, and car packages61,62. If the total number of data points for an experiment was less than 30, the data were tested for normality using the Shapiro–Wilk test. If the data were normally distributed or n > 30, data were analysed using Student’s unpaired two-tailed t-test for comparison between 2 groups, and one-way ANOVA with Tukey’s post hoc honest significant difference for comparison between multiple groups. Repeated studies were examined using a generalized linear mixed model with mouse identity as a random effect to account for repeated sampling across time or two-way repeated measures ANOVA. Cohort was included as a fixed variable where applicable. P values were adjusted using post hoc testing (for example, Tukey or Sidak’s testing) for multiple comparisons. If the data were not normally distributed, they were analysed with the Mann–Whitney U test or Kruskall–Wallis rank sum test with Dunn’s post hoc tests. Outliers were defined as values two standard deviations above or below the mean per group per time point (where applicable) and removed from analyses. P values below 0.05 were considered to be significant.
Figure panels were generated with Biorender (https://app.biorender.com/) and in Adobe Illustrator (v.2020).
Reporting summary
Further information on research design is available in the Nature Portfolio Reporting Summary linked to this article.
Data availability
The main data supporting the results in this study are available within the paper, the Supplementary Information and source data files. The raw fibre photometry data sets are available for research purposes from the corresponding authors on reasonable request. The spatial transcriptomics data are available from Gene Expression Omnibus (GEO) under accession GSE295730.
References
Gruene, T. M., Flick, K., Stefano, A., Shea, S. D. & Shansky, R. M. Sexually divergent expression of active and passive conditioned fear responses in rats. eLife 4, e11352 (2015).
Krishnan, V. et al. Molecular adaptations underlying susceptibility and resistance to social defeat in brain reward regions. Cell 131, 391–404 (2007).
Mészáros, K., Lang, C. H., Bagby, G. J. & Spitzer, J. J. In vivo glucose utilization by individual tissues during nonlethal hypermetabolic sepsis. FASEB J. 2, 3083–3086 (1988).
Lang, C. H. & Dobrescu, C. Sepsis-induced increases in glucose uptake by macrophage-rich tissues persist during hypoglycemia. Metabolism 40, 585–593 (1991).
van der Zwaluw, N. L., van de Rest, O., Kessels, R. P. & de Groot, L. C. Short-term effects of glucose and sucrose on cognitive performance and mood in elderly people. J. Clin. Exp. Neuropsychol. 36, 517–527 (2014).
Fox, A. S. & Shackman, A. J. The central extended amygdala in fear and anxiety: closing the gap between mechanistic and neuroimaging research. Neurosci. Lett. 693, 58–67 (2019).
Francois, M., Canal Delgado, I., Shargorodsky, N., Leu, C. S. & Zeltser, L. Assessing the effects of stress on feeding behaviors in laboratory mice. eLife 11, e70271 (2022).
Meehan, W. P., Leedom, L. J., Nagayama, T. & Zeidler, A. Hyperglycemia and fight-flight behavior in nondiabetic and diabetic mice. Physiol. Behav. 41, 397–403 (1987).
McNamara, J. J., Molot, M. D., Dunn, R. A. & Stremple, J. F. Effect of hypertonic glucose in hypovolemic shock in man. Ann. Surg. 176, 247–250 (1972).
Pearce, F. J. & Drucker, W. R. Glucose infusion arrests the decompensatory phase of hemorrhagic shock. J. Trauma 27, 1213–1220 (1987).
Oomura, Y., Sasaki, K. & Li, A. J. Memory facilitation educed by food intake. Physiol. Behav. 54, 493–498 (1993).
Stollery, B. & Christian, L. Glucose improves object-location binding in visual-spatial working memory. Psychopharmacology 233, 529–547 (2016).
Dash, P. K., Orsi, S. A. & Moore, A. N. Spatial memory formation and memory-enhancing effect of glucose involves activation of the tuberous sclerosis complex-Mammalian target of rapamycin pathway. J. Neurosci. 26, 8048–8056 (2006).
Finfer, S. et al. Hypoglycemia and risk of death in critically ill patients. New Engl. J. Med. 367, 1108–1118 (2012).
Maniscalco, J. W. & Rinaman, L. Interoceptive modulation of neuroendocrine, emotional, and hypophagic responses to stress. Physiol. Behav. 176, 195–206 (2017).
Ashmore, J., Hastings, A. B. & Nesbett, F. B. The effect of diabetes and fasting on liver glucose-6-phosphatase. Proc. Natl Acad. Sci. USA 40, 673–678 (1954).
Weathington, J. M., Strahan, J. A. & Cooke, B. M. Social experience induces sex-specific fos expression in the amygdala of the juvenile rat. Horm. Behav. 62, 154–161 (2012).
Park, S. K. et al. Ultrastructure and synaptic connectivity of main and accessory olfactory bulb efferent projections terminating in the rat anterior piriform cortex and medial amygdala. Brain Struct. Funct. 219, 1603–1613 (2014).
Cadiz-Moretti, B., Otero-Garcia, M., Martinez-Garcia, F. & Lanuza, E. Afferent projections to the different medial amygdala subdivisions: a retrograde tracing study in the mouse. Brain Struct. Funct. 221, 1033–1065 (2016).
McDonald, A. J., Shammah-Lagnado, S. J., Shi, C. & Davis, M. Cortical afferents to the extended amygdala. Ann. N. Y. Acad. Sci. 877, 309–338 (1999).
Pardo-Bellver, C., Cadiz-Moretti, B., Novejarque, A., Martinez-Garcia, F. & Lanuza, E. Differential efferent projections of the anterior, posteroventral, and posterodorsal subdivisions of the medial amygdala in mice. Front. Neuroanat. 6, 33 (2012).
Bienkowski, M. S., Wendel, E. S. & Rinaman, L. Organization of multisynaptic circuits within and between the medial and the central extended amygdala. J. Comp. Neurol. 521, 3406–3431 (2013).
Azevedo, E. P. et al. A limbic circuit selectively links active escape to food suppression. eLife 9, e58894 (2020).
Sparta, D. R., Jennings, J. H., Ung, R. L. & Stuber, G. D. Optogenetic strategies to investigate neural circuitry engaged by stress. Behav. Brain Res. 255, 19–25 (2013).
Stanley, S. A. et al. Bidirectional electromagnetic control of the hypothalamus regulates feeding and metabolism. Nature 531, 647–650 (2016).
Faber, C. L. et al. Distinct neuronal projections from the hypothalamic ventromedial nucleus mediate glycemic and behavioral effects. Diabetes 67, 2518–2529 (2018).
Shao, J. et al. Cav3.1-driven bursting firing in ventromedial hypothalamic neurons exerts dual control of anxiety-like behavior and energy expenditure. Mol. Psychiatry 27, 2901–2913 (2022).
Wu, Y. E., Pan, L., Zuo, Y., Li, X. & Hong, W. Detecting activated cell populations using single-cell RNA-seq. Neuron 96, 313–329.e316 (2017).
Dornbos, P. et al. Evaluating human genetic support for hypothesized metabolic disease genes. Cell Metab. 34, 661–666 (2022).
Liu, L. et al. Hypothalamus–sympathetic–liver axis mediates the early phase of stress-induced hyperglycemia in the male mice. Nat. Commun. 15, 8632 (2024).
Pocai, A., Obici, S., Schwartz, G. J. & Rossetti, L. A brain-liver circuit regulates glucose homeostasis. Cell Metab. 1, 53–61 (2005).
Zingg, B., Dong, H. W., Tao, H. W. & Zhang, L. I. Application of AAV1 for anterograde transsynaptic circuit mapping and input-dependent neuronal cataloging. Curr. Protoc. 2, e339 (2022).
Lewis-Tuffin, L. J., Quinn, P. G. & Chikaraishi, D. M. Tyrosine hydroxylase transcription depends primarily on cAMP response element activity, regardless of the type of inducing stimulus. Mole. Cell. Neurosci. 25, 536–547 (2004).
Han, H.-S., Kang, G., Kim, J. S., Choi, B. H. & Koo, S.-H. Regulation of glucose metabolism from a liver-centric perspective. Exp. Mol. Med. 48, e218 (2016).
Gross, D. N., Wan, M. & Birnbaum, M. J. The role of FOXO in the regulation of metabolism. Curr. Diab. Rep. 9, 208–214 (2009).
Yabaluri, N. & Bashyam, M. D. Hormonal regulation of gluconeogenic gene transcription in the liver. J. Biosci. 35, 473–484 (2010).
McGuinness, O. P. in Harper’s Illustrated Biochemistry 32nd edn (eds Kennelly, P. J. et al.) (McGraw Hill Education, 2023).
Frick, J. M. et al. High-fat/high-sucrose diet worsens metabolic outcomes and widespread hypersensitivity following early-life stress exposure in female mice. Am. J. Physiol. 324, r353–r367 (2023).
Sanghez, V. et al. Psychosocial stress induces hyperphagia and exacerbates diet-induced insulin resistance and the manifestations of the metabolic syndrome. Psychoneuroendocrinology 38, 2933–2942 (2013).
Tryon, M. S., Carter, C. S., Decant, R. & Laugero, K. D. Chronic stress exposure may affect the brain’s response to high calorie food cues and predispose to obesogenic eating habits. Physiol. Behav. 120, 233–242 (2013).
Vidal, E. J. et al. Perceived stress and high fat intake: a study in a sample of undergraduate students. PLoS ONE 13, e0192827 (2018).
Ogihara, M. Expression of α2-receptor-mediated responses by insulin in primary culture of rat hepatocytes. Jpn. J. Pharmacol. 68, 11–18 (1995).
Tao, L. et al. Dexmedetomidine ameliorates high-fat diet-induced nonalcoholic fatty liver disease by targeting SCD1 in obesity mice. Pharmacol. Res. Perspect. 9, e00700 (2021).
Morgan, N. G., Blackmore, P. F. & Exton, J. H. Age-related changes in the control of hepatic cyclic AMP levels by α1- and β2-adrenergic receptors in male rats. J. Biol. Chem. 258, 5103–5109 (1983).
Madisen, L. et al. Transgenic mice for intersectional targeting of neural sensors and effectors with high specificity and performance. Neuron 85, 942–958 (2015).
Vong, L. et al. Leptin action on GABAergic neurons prevents obesity and reduces inhibitory tone to POMC neurons. Neuron 71, 142–154 (2011).
Wu, Z., Autry, A. E., Bergan, J. F., Watabe-Uchida, M. & Dulac, C. G. Galanin neurons in the medial preoptic area govern parental behaviour. Nature 509, 325–330 (2014).
Smith, B. N. et al. Pseudorabies virus expressing enhanced green fluorescent protein: a tool for in vitro electrophysiological analysis of transsynaptically labeled neurons in identified central nervous system circuits. Proc. Natl Acad. Sci. USA 97, 9264–9269 (2000).
Livak, K. J. & Schmittgen, T. D. Analysis of relative gene expression data using real-time quantitative PCR and the 2(−ΔΔCT) method. Methods 25, 402–408 (2001).
Jennings, M. E. 2nd & Matthews, D. E. Determination of complex isotopomer patterns in isotopically labeled compounds by mass spectrometry. Anal. Chem. 77, 6435–6444 (2005).
Fernandez, C. A., Des Rosiers, C., Previs, S. F., David, F. & Brunengraber, H. Correction of 13C mass isotopomer distributions for natural stable isotope abundance. J. Mass Spectrom. 31, 255–262 (1996).
Kurland, I. J., Alcivar, A., Bassilian, S. & Lee, W. N. Loss of [13C]glycerol carbon via the pentose cycle. Implications for gluconeogenesis measurement by mass isotoper distribution analysis. J. Biol. Chem. 275, 36787–36793 (2000).
Okada, J. et al. Spatial hepatocyte plasticity of gluconeogenesis during the metabolic transitions between fed, fasted and starvation states. Nat. Metab. 7, 1073–1091 (2025).
Allen Mouse Brain Atlas. Allen Institute for Brain Science https://atlas.brain-map.org/ (2011).
Paxinos, G. & Franklin, K. B. J. Paxinos and Franklin's the Mouse Brain in Stereotaxic Coordinates 5th edn (Academic Press, 2019).
Bolte, S. & Cordelières, F. P. A guided tour into subcellular colocalization analysis in light microscopy. J. Microsc. 224, 213–232 (2006).
Chen, J. G. et al. Giotto Suite: a multi-scale and technology-agnostic spatial multi-omics analysis ecosystem. Preprint at bioRxiv https://doi.org/10.1101/2023.11.26.568752 (2023).
Lun, A. T. L., McCarthy, D. J. & Marioni, J. C. A step-by-step workflow for low-level analysis of single-cell RNA-seq data with Bioconductor. F1000Research 5, 2122 (2016).
He, L. et al. NEBULA is a fast negative binomial mixed model for differential or co-expression analysis of large-scale multi-subject single-cell data. Commun. Biol. 4, 629 (2021).
Miller, S. M., Marcotulli, D., Shen, A. & Zweifel, L. S. Divergent medial amygdala projections regulate approach-avoidance conflict behavior. Nat. Neurosci. 22, 565–575 (2019).
Kuznetsova, A., Brockhoff, P. B. & Christensen, R. H. B. lmerTest package: tests in linear mixed effects models. J. Stat. Softw. 82, 1–26 (2017).
Searle, S. R., Speed, F. M. & Milliken, G. A. Population marginal means in the linear model: an alternative to least squares means. Am. Stat. 34, 216–221 (1980).
Acknowledgements
J.R.E.C. is supported in part by NIH grant T32AG049688. K.D. was supported in part by the American Heart Association (grant 18PRE33960254). D.E. is supported in part by the American Heart Association (25PRE1373198). M.J.G. is supported in part by a pilot and feasibility award from the NIDDK-supported Einstein-Sinai Diabetes Research Center (DRC) (P-30 DK020541). A.A. was supported by a senior postdoctoral fellowship from the Charles H. Revson Foundation (grant no. 18-25) and a postdoctoral scholarship from Swedish Society for Medical Research (SSMF). R.F.H. is supported by NIH grant F31DK129016. K.C. was supported by an American Heart Association, Founders Affiliate Undergraduate Student Fellowship. I.K. was supported by NIH DK020541, and I.K. and Y.Q. were also supported by the Stable Isotope and Metabolomics Core Facility of the Diabetes Research and Training Center (DRTC) of the Albert Einstein College of Medicine (NIH P60DK020541). This work was supported by the American Diabetes Association Pathway to Stop Diabetes grant ADA 1-17-ACE-31, and in part by grants from the National Institutes of Health (R01DK124461to S.A.S., R01DA053629 and R01MH112168 to P.J.K., 1RF1MH128970 and 1R01MH133703 to G.C.Y.) and Department of Defense (W81XWH-20-1-0345 and Discovery Award to M.J.-G. W81XWH-20-1-0156). Microscopy and image analysis were performed at the Microscopy core at the Icahn School of Medicine at Mount Sinai. The authors thank the NIDDK-supported Einstein-Sinai Diabetes Research Center (DRC) (P-30 DK020541) and G. Schwartz for helpful discussions.
Author information
Authors and Affiliations
Contributions
J.R.E.C., K.D., R.M.O., D.E. and A.K. performed experiments, analysed data and contributed to the writing of the manuscript. A.R. provided training with footshock equipment. M.J.-G., A.A., R.F.H., R.L., Y.Q., S.P., A.S., K.C., M.B., D.G., J.M., V.L., A.A., R.M.O., R.F.H., L.W., I.K. and G.C.Y. performed experiments and reviewed the manuscript. P.J.K. analysed data and wrote the manuscript. S.A.S. performed experiments, analysed data and wrote the manuscript. J.R.E.C., K.D., R.M.O., K.B., P.K. and S.A.S. designed the studies. All authors discussed the results and edited the manuscript.
Corresponding author
Ethics declarations
Competing interests
S.A.S. is a named inventor of patents granted by the United States Patent and Trademark Office: ‘Compositions and Methods to Modulate Cell Activity’ (US 9,399,063 and US 10,064,941) and ‘Ferritin nanoparticle compositions and methods to modulate cell activity’ (US 10,786,570). P.J.K. is a co-founder of Eolas Therapeutics, which is developing novel treatments for substance use disorders. P.J.K. is a consultant for EpiVario.
Peer review
Peer review information
Nature thanks Kay Tye and the other, anonymous, reviewer(s) for their contribution to the peer review of this work.
Additional information
Publisher’s note Springer Nature remains neutral with regard to jurisdictional claims in published maps and institutional affiliations.
Extended data figures and tables
Extended Data Fig. 1 Metabolic effects of acute stressors.
a, Schematic of restraint stress. Created with BioRender (https://biorender.com/1ikn9ci). b, Blood glucose during glucose tolerance testing (2mgkg−1) with (red) and without (grey) 30 min restraint stress in 6 h fasted mice. c-f, Plasma insulin (c), glucagon (d), adrenaline (e), noradrenaline (f), and glycerol (g) with (red) and without (grey) 30 min restraint stress in 6 h fasted mice. h, Liver glycogen content with (red) and without 30 min restraint stress (grey) in 6 h fasted mice. i, Schematic of territorialized cage exposure stress. j, Blood glucose with clean cage (grey) or territorialized cage exposure (red) in 6 h fasted mice. k, Blood glucose during glucose tolerance testing (2mgkg−1) with (red) and without (grey) 30 min territorialized cage exposure in 6 h fasted mice. l-q, Plasma corticosterone (l), insulin (m), glucagon (n), adrenaline (o), noradrenaline (p), and glycerol (q) with (red) and without (grey) 30 min territorialized cage exposure in 6 h fasted mice. r, Liver glycogen content with (red) and without (grey) 30 min territorialized cage exposure in 6 h fasted mice. s, Mean food intake during exposure to clean cage (grey) or territorialized cage (red) for 30 min. t, Relative fold change in liver glucose-6-phosphatase (G6pc) and phosphoenolpyruvate carboxykinase 1 (Pck1) gene expression with (red) and without (grey) 30 min territorialized cage exposure in sated mice. Values are means ± s.e.m. Individual data points represent individual mice. Sample size and statistical analysis in Supplementary Data Table 1.
Extended Data Fig. 2 Medial amygdala activation by stressors to increase glucose.
a, Total MeA cFos+ cell number with (red) and without (grey) 30 min restraint stress. b, CFos+ cell number in ventral and dorsal MeA with (red) and without (grey) 30 min restraint stress. c, CFos+ cell number in the medial amygdala (MeA), the basolateral amygdala (BLA), and the central amygdala (CEA) with (red) and without (grey) 30 min restraint stress. d, MeA GCaMP8s Z score (lower) before, during, and after with corresponding blood glucose (upper) during, 30 min territorialized cage exposure. Shade bar indicates territorialized cage (red). e, MeA GCaMP8s Z score aligned to placement in territorialized cage. f, Mean MeA GCaMP8s Z score for 20 s before and after territorialized cage exposure. g–i, Plasma glucagon (g), adrenaline (h), and noradrenaline (i) in CNO-treated, 6 h fasted MeA hSyn-hM3DGq-mCherry (MeA-Gq, purple) and hSyn-mCherry mice (control, grey). j, Time in elevated plus maze open arms (EPM), light arena of light-dark box (LD), or center time in open field test (OFT) in CNO-treated MeA hSyn-hM3DGq-mCherry (purple) and hSyn-mCherry mice (grey). k, Hourly (left axis) and cumulative (right axis) chow intake in CNO-treated, overnight fasted MeA hSyn-hM3DGq-mCherry (MeA-Gq, purple) and hSyn-mCherry mice (control, grey). l-n, Blood glucose (l), plasma insulin (m), and plasma glucagon (n) in CNO-treated, 6 h fasted male and female MeA hSyn-hM3DGq-mCherry (MeA-Gq, purple) and hSyn-mCherry mice (control, grey). o, Schematic of optogenetic activation of MeA neurons. p,q, Change in blood glucose with 5 (p) or 15 min (q) of optogenetic stimulation in 6 h fasted MeA hSyn-hChR2(H134R) (MeA ChR2, purple) or hSyn-eGFP (control, grey) mice. Values are means ± s.e.m. Individual data points represent individual mice. Sample size and statistical analysis in Supplementary Data Table 1.
Extended Data Fig. 3 Acute territorialized cage stress activates MeA → VMH and MeA → BNST neurons.
a, Schematic of fiber photometry for VMH-projecting MeA neurons. b, MeA-VMH axon-GCaMP8s Z score in clean cage, during 30 min territorialized cage exposure (red bar), and return to a clean cage. c, MeA-VMH axon-GCaMP8s Z score aligned to placement in territorialized cage. d, Mean MeA-VMH axon-GCaMP8s Z score for 20 s before and after territorialized cage exposure. e, MeA-VMH GCaMP8s Z score (lower) with continuous glucose monitoring (upper) for 5 min baseline, 30 s capture (pink bar), 5 min restraint (red bar), and 5 min release (grey bar) periods. f, MeA-VMH GCaMP8s Z score (lower) with continuous glucose monitoring (upper) for 5 min baseline, 5 territorialized cage exposure (red bar), and 5 min baseline clean cage periods. g, Schematic of fiber photometry for BNST-projecting MeA neurons. h, MeA-BNST axon-GCaMP8s Z score in clean cage, during 30 min exposure to territorialized cage (red bar), and return to a clean cage. i, MeA-BNST axon-GCaMP8s Z score aligned to placement in territorialized cage. j, Mean MeA-BNST axon-GCaMP8s Z score for 20 s before and after territorialized cage exposure. Values are means ± s.e.m. Individual data points represent individual mice. Sample size and statistical analysis in Supplementary Data Table 1.
Extended Data Fig. 4 Spatial distribution of MeA gene expression.
a, UMAP plot of all MeA cells identified by spatial transcriptomics, showing cell cluster assignments. b-f, Expression levels of Slc17a6 (b), Slc17a7 (c), Slc32a1 (d), Gad1 (e) and Gad2 (f) shown on UMAP plots of MeA neurons. g, Schema of MeA sections used for spatial transcriptomic analysis, organized from anterior to posterior, with the MeA shape and associated bregma coordinate. h, Spatial positions of neurons belonging to different neural clusters in a representative MeA region of interest. i-j, Spatial positions (i) and proportion (j) of neurons expressing glutamatergic subtypes (vGlut1, vGlut2, and vGlut1+ vGlut2) and GABAergic neurons from anterior to posterior MeA position. In spatial plot the 24 ROIs were arranged to reflect the anterior-posterior position of each ROI from left (anterior) to right (posterior), while preserving the relative positions of cells within individual ROIs. k-l, Plot of MeA Cherry+ neuron spatial positions (k) from anterior to most posterior MeA position and proportion of neural subtypes among mCherry+ neurons (l). m, Heatmap of gene expression levels of select cluster gene markers in each neural cluster in the MeA. Z scores are computed on normalized gene expressions across all neurons and averaged in each cluster. Values are means ± s.e.m. Individual data points represent individual mice. Sample size and statistical analysis in Supplementary Data Table 1.
Extended Data Fig. 5 MeA → VMH but not MeA → BNST neurons regulate glucose responses to stress.
a, Schema for MeA-VMH circuit chemogenetic silencing. b-c, Blood glucose in CNO-injected MeA-VMH hSyn-FLEX-hM4DGi-mCherry (MeAVMH-Gi, blue) or hSyn-FLEX-mCherry (grey) mice with 30-minute territorialized cage exposure stress (b) and without stress (c). d-g, Plasma corticosterone (d), insulin (e), glucagon (f), and adrenaline (g) in CNO-injected MeA-VMH hSyn-FLEX-hM4DGi-mCherry (blue) or hSyn-FLEX-mCherry (grey) mice. h, Schema for MeA-VMH circuit chemogenetic activation. i, Blood glucose in CNO-injected MeA-VMH hSyn-FLEX-hM3DGq-mCherry (MeAVMH-Gq, red) or hSyn-FLEX-mCherry (grey) mice without stress. j-m, Plasma corticosterone (j), adrenaline (k), time course of insulin response (l), and time course of glucagon response (m) in CNO-injected MeA-VMH hSyn-FLEX-hM3DGq-mCherry (red) or hSyn-FLEX-mCherry (grey) mice without stress. n, Schema for MeA-BNST circuit chemogenetic activation. o, Blood glucose in CNO-injected MeA-BNST hSyn-FLEX-hM3DGq-mCherry (MeABNST-Gq, black) or hSyn-FLEX-mCherry (grey) mice without stress. p, Blood glucose during glucose tolerance testing (2 mg kg−1) in CNO-injected MeA-BNST hSyn-FLEX-hM3DGq-mCherry (MeABNST-Gq, black) or hSyn-FLEX-mCherry (grey) mice. q-t, Mean plasma corticosterone (q), glucagon (r), insulin (s), and adrenaline (t) in CNO-injected MeA-BNST hSyn-FLEX-hM3DGq-mCherry (MeABNST-Gq, black) or hSyn-FLEX-mCherry (grey) mice without stress. Values are means±s.e.m. Individual data points represent individual mice. Sample size and statistical analysis in Supplementary Data Table 1.
Extended Data Fig. 6 MeA → VMH regulation of hepatic glucose production.
a, Blood glucose during pyruvate tolerance test (2 mg kg−1) in CNO-injected hSyn-hM3DGq-mCherry (MeA-Gq, purple) and hSyn-mCherry mice (control, grey). b, Blood glucose during pyruvate tolerance test with 15 min of optogenetic stimulation MeA hSyn-hChR2(H134R) (MeA ChR2, purple) or hSyn-eGFP mice (control, grey). c, Blood glucose during pyruvate tolerance test (2 mg kg−1) in CNO-injected, MeA-VMH hSyn-hM4DGi-mCherry (MeAVMH-Gi, blue) and hSyn-mCherry mice (grey) with 30 min restraint stress. d, Hepatic gluconeogenic gene expression in CNO-injected MeA-VMH hSyn-hM4DGi-mCherry (blue) or hSyn-FLEX-mCherry (grey) mice. e, Hepatic gluconeogenic protein levels in CNO-injected MeA-VMH hSyn-FLEX-hM4DGi-mCherry (blue) or hSyn-FLEX-mCherry (grey) mice with 30 min restraint stress. f, Liver glycogen content in CNO-injected MeA-VMH hSyn-FLEX-hM4DGi-mCherry (blue) or hSyn-FLEX-mCherry (grey) mice with 30 min restraint stress. g, Liver glycogen content in unstressed CNO-injected MeA-VMH hSyn-FLEX-hM3DGq-mCherry (red) or hSyn-FLEX-mCherry (grey) mice. h, Average 13C enrichment per gluconeogenic metabolite as measured by 13C metabolic profiling during [2,3- 13C] pyruvate tolerance testing in unstressed mice expressing ChR2 (red, n = 7) in MeA-VMH neurons compared to those expressing eGFP (grey). i, Schematic of the gluconeogenic pathway with enriched 13C gluconeogenic metabolites, adapted from Kennelly et al.37. Values are means±s.e.m. Individual data points represent individual mice. Sample size and statistical analysis in Supplementary Data Table 1.
Extended Data Fig. 7 Repeated stress blunts MeA and MeA → VMH neural activity.
a, MeA GCaMP6m Z score before, during, and after repeated 2 min exposures to territorialized cage stress (red bars). b, MeA GCaMP6m Z score aligned to start of each territorialized cage exposure period. c, Mean MeA GCaMP6m Z score for each exposure period. d, MeA-VMH axon-GCaMP8s Z score before, during, and after repeated 2 min exposures to territorialized cage stress (red bars). e, Blood glucose before and after each 5-minute territorialized cage exposure stress at 0 h, 6 h, 12 h, 24 h. f, MeA-VMH axon-GCaMP8s Z score before, during, and after repeated 5 min territorialized cage exposure stress (red bars) at 0 h, 6 h, 12 h, 24 h. g, MeA-VMH axon-GCaMP8s Z score aligned to start of each territorialized cage exposure period at 0 h, 6 h, 12 h, 24 h. h, Mean MeA-VMH axon-GCaMP8s Z score for each exposure period. Values are means±s.e.m. Individual data points represent individual mice. Sample size and statistical analysis in Supplementary Data Table 1.
Extended Data Fig. 8 Effects of chronic silencing of MeA → VMH circuit activity.
a, DAPI+ area in MeA-VMH hSyn-FLEX-DTA (MeAVMH-DTA, blue) or hSyn-FLEX-mCherry (control, grey) mice. b, Blood glucose in chow-fed MeA-VMH hSyn-FLEX-DTA (MeAVMH-DTA, blue) or hSyn-FLEX-mCherry (grey) mice with 30-minute territorialized cage exposure stress. c-d, Mean plasma insulin (c) and glucagon (d) in chow-fed MeA-VMH hSyn-FLEX-DTA (MeAVMH-DTA, blue) or hSyn-FLEX-mCherry (grey) mice with 30-minute restraint stress. e-g, Mean plasma corticosterone (e), adrenaline (f), and noradrenaline (g) without (left) or with 30-minute restraint stress (right) in chow-fed MeA-VMH hSyn-FLEX-DTA (MeAVMH-DTA, blue) or hSyn-FLEX-mCherry (grey) mice. h-i, Cumulative (h) and average daily intake (i) in chow-fed MeA-VMH hSyn-FLEX-DTA (MeAVMH-DTA, blue) or hSyn-FLEX-mCherry (grey) mice. j, Hepatic gluconeogenic gene expression in chow-fed MeA-VMH hSyn-FLEX-DTA (MeAVMH-DTA, blue) or hSyn-FLEX-mCherry (grey) mice. k, Cumulative intake in high fat diet-fed MeA-VMH hSyn-FLEX-DTA (MeAVMH-DTA, blue) or hSyn-FLEX-mCherry (grey) mice. Values are means±s.e.m. Individual data points represent individual mice. Sample size and statistical analysis in Supplementary Data Table 1.
Supplementary information
Supplementary Information (download DOCX )
Supplementary Figs. 1–9.
Supplementary Data Table 1 (download XLSX )
Sample size and statistical analyses for Figs. 1–5 and Extended Data Figs. 1–8.
Supplementary Data Table 2 (Source Data Fig. 3 and Extended Data Fig. 4) (download XLSX )
Genes included in Xenium panel, marker genes for spatial clustering, and differential gene expression analysis.
Source data
Rights and permissions
Open Access This article is licensed under a Creative Commons Attribution-NonCommercial-NoDerivatives 4.0 International License, which permits any non-commercial use, sharing, distribution and reproduction in any medium or format, as long as you give appropriate credit to the original author(s) and the source, provide a link to the Creative Commons licence, and indicate if you modified the licensed material. You do not have permission under this licence to share adapted material derived from this article or parts of it. The images or other third party material in this article are included in the article’s Creative Commons licence, unless indicated otherwise in a credit line to the material. If material is not included in the article’s Creative Commons licence and your intended use is not permitted by statutory regulation or exceeds the permitted use, you will need to obtain permission directly from the copyright holder. To view a copy of this licence, visit http://creativecommons.org/licenses/by-nc-nd/4.0/.
About this article

Cite this article
Carty, J.R.E., Devarakonda, K., O’Connor, R.M. et al. Amygdala–liver signalling orchestrates glycaemic responses to stress. Nature 646, 697–706 (2025). https://doi.org/10.1038/s41586-025-09420-1
Received:
Accepted:
Published:
Version of record:
Issue date:
DOI: https://doi.org/10.1038/s41586-025-09420-1
This article is cited by
-
Region-resolved proteomic map of the human brain: functional interconnections and neurological implications
Signal Transduction and Targeted Therapy (2026)
