
Abstract
Dengue is a vector-borne disease transmitted to humans by vectors of genus Aedes causing a global threat to health, social, and economic sectors in many of the tropical countries including Sri Lanka. In Sri Lanka, the tropical climate, marked by seasonal weather primarily influenced by monsoons, fosters optimal conditions for the virus to spread efficiently. This heightened transmission results in increased per-capita vector density. In this work, we investigate the dynamic influence of environmental conditions on dengue emergence in Colombo district − the geographical region with the highest recorded dengue threat in Sri Lanka. An iterative approach is employed to dynamically estimate dengue cases leveraging the Markov chain Monte Carlo simulations, utilizing the dynamics of four seasons per year influenced by monsoon weather patterns governing in the region. The developed algorithm allows to estimate the risk of dengue outbreaks in 2017 and 2019 with high precision, facilitating accurate forecasts of upcoming disease emergence patterns for better preparedness. The uncertainty quantification not only validated the accuracy of outbreak estimates but also showcased the model’s capacity to capture extreme cases and revealed undisclosed external factors such as human mobility and environmental pollution that might affect dengue transmission in the Colombo district of Sri Lanka.
Introduction
Dengue fever is an infectious disease caused by the vector-borne virus (serotypes DENV-1 to DENV-4) transmitted by the mosquitoes of the species Aedes1. It is a global health issue, with an estimated occurrence of 100 million cases annually across the globe. The dengue cases have increased in recent years, 30-fold over the past 50 years with a 50% increase in the past decade alone, with a growing number of countries reporting outbreaks2,3,4,5. In 2020 alone, over 2.5 million cases of dengue were reported worldwide with 1,018 (0.04%) deaths6. The World Health Organization (WHO) has declared dengue fever an endemic in over 100 countries, most of which are in tropical and subtropical regions of the world, including Southeast Asia, South America, and parts of Africa. The dengue threat is highest in Asia and the Americas, with Southeast Asia and the Western Pacific region accounting for over \(70\%\) of the global dengue statistics. In Sri Lanka, dengue threat is the highest in the Western province reporting frequent outbreaks7. The most recent outbreaks were reported in 2017 and 2019. There were over 51,000 cases, with over 90 deaths (0.17%) reported during the 2017 outbreak and 186,101 cases with over 440 (0.23%) deaths were reported during 2019 outbreak according to the Epidemiology unit, Ministry of Health, Sri Lanka. In both of these instances, the Sri Lankan health system collapsed due to unpreparedness and lack of optimum resource allocations. The Sri Lankan government has implemented various health and social measures to prevent and control the spread of the disease by conducting public awareness campaigns, clean-up programs to remove mosquito breeding sites, insecticide fumigation and increasing the use of mosquito repellents7,8. However, similar to other tropical countries, Sri Lanka too has failed to completely wipe-out or successfully control the disease emergence. Given the heightened risk of infectious diseases in the future as a consequence of climate change, it’s essential to anticipate forthcoming dengue threats. This enables adequate time for bolstering preparedness and strengthening the healthcare system.
The infected human and vector population densities are intricately linked to the intensity of virus transmission9. The Aedes vectors thrive in warm and humid environments commonly found in tropical and subtropical regions. In particular, Aedes mosquitoes have multiple stages in their life cycle - egg, larva, pupa, and adult. Mosquitoes lay their eggs in stagnant clean water sources such as uncovered containers, discarded tires, and water-filled areas. With an abundant supply of breeding sites and favorable climatic conditions, the vector population can grow rapidly. Consequently, this high vector population density can amplify the likelihood of dengue transmission for several reasons such as (1) a larger vector population means a greater chance of female vectors being infected with the dengue virus, (2) more mosquitoes increase the probability of contact between infected vectors and susceptible individuals enabling the virus to be transmitted more rapidly10. Therefore, the vector population significantly impact the dengue transmission within human populations. Environmental conditions directly impact the mosquito population density and therefore can create high sensitivity in dengue transmission7,11,12,13,14,15,19. The warmer and humid environments, typically between 26−30 °C (77−86 °CF) of temperatures and above 60% of humidity levels provide a highly favorable environment for the Aedes mosquitoes causing rapid transmission16,17,18. Sri Lanka experiences an average temperature between 26−30 °C, with coastal regions being slightly warmer than inland areas. The humidity level remains consistently above 70% throughout the year reaching nearly 90% during the monsoon season in June. Monsoon rainfalls in Sri Lanka directly impact the dengue emergence patterns, as these rains create ideal breeding conditions for Aedes mosquitoes19 given the favorability of the other environmental conditions20,21,22. Specifically, Sri Lanka falls within the highest-risk category for epidemic potential according to the projected climate change11. Apart from favorable and consistent temperature and humidity conditions throughout the year, rainfall from the two monsoons experienced by Sri Lanka adds an additional level of favorability, generating high risk of dengue23,24,25. In addition to the influence of rainfall, the increased density of hosts and vectors, along with their mobility, contributes to the heightened transmission rate.
Given the severity of the disease, timely forecasting its future risk is critically important to alleviate the stress on the Sri Lankan health system. Moreover, the control measures such as early detection of rapid development, diagnostics and surveillance measures are vital for better handling the dengue threat26. Due to the influence of external factors on vector populations and disease transmission, disease control strategies may not be universally applicable. Tailoring approaches based on specific geographic locations and timeframes will be crucial for achieving effective and efficient outcomes19. Numerous studies have delved into modeling and validating intricate relationships between weather patterns and the emergence of dengue, employing various methodologies. Particularly models developed connecting information of weather and dengue in Sri Lanka are concentrated to establishing the correlation between these variables followed by regression or time-series models27,28,29,30,31,32. Additionally, the intricate dynamics of disease transmission between vectors and humans are extensively explored through compartmental models. These models depict the vector-host relationship by ordinary differential equations to characterize the population dynamics of both entities33,34,35,36,37. Typically, the human population is compartmentalized into three categories: susceptible (\(S_h\)), infected (\(I_h\)), and recovered (\(R_h\)), while the vector population is often divided into susceptible (\(S_v\)) and infected (\(I_v\)). Of these models, disparity in population dynamics between vectors and humans as time progresses was notable. While human populations may exhibit relatively gradual changes, vector populations can undergo drastic fluctuations within short time intervals due to environmental conditions when combined with their short life span. However, these models assume the infection dynamics progress more rapidly for humans than for the vector, achieved by mathematically approximating the system of equations at its quasi-equilibrium of vectors (i.e., \(\dot{I_v}=0\)). While this simplification results in a more straightforward model, it overlooks the potential impact, if any, of changes in the vector population on the infection dynamics of humans38,39. Consequently, vector population variations in response to external factors, particularly weather data, are often overlooked. This oversight of the models can lead to significant limitations in the estimations and simulation processes, as they fail to capture the comprehensive picture of the epidemic. The neglected variations in vector populations with respect to weather data results in a gap in understanding the full impact of environmental factors on disease transmission dynamics. As a result, the insights gained from these models may not accurately reflect the complexities inherent in the epidemic. To address the existing gap in estimating dengue risk based on fluctuating vector populations in the Colombo district, our study aims to establish a quantitative relationship between vector density and a key environmental factor specific to the study region. Specifically, we do not assume a constant vector population in the ordinary differential equation system. Instead, we introduce an indirect optimization approach to estimate vector density in the Colombo district. This method provides a more targeted and accurate estimation of vector populations, leading to improved predictive capabilities.
While several experimental studies have investigated vector populations across different regions of Sri Lanka, the findings from these studies are not universally applicable due to the varying environmental conditions, socio-economic factors, and unique characteristics of each region. As a result, these experimental data, although valuable, are highly case-sensitive and cannot be generalized across the country. Moreover, conducting such experimental studies is often costly and time-consuming, limiting their feasibility on a broader scale. However, our study seeks to develop a method which will indirectly estimate vector densities by correlating to rainfall, offering a more efficient and indirect approach. Accordingly, our study aims to close these gaps related to vector population by establishing a measurable link between weather patterns and the dynamics of vector populations, thereby improving our comprehension of the factors influencing the emergence of dengue. As outlined in literature models for Sri Lanka, rainfall significantly influences the occurrence of dengue cases. When examining the impacts of minimum temperature, maximum temperature, humidity, and rainfall on dengue, principal component regression analysis has demonstrated rainfall accounts for over 95% of the influence on dengue cases in Colombo district. In existing literature, environmental variables are typically used directly to estimate vector populations through regression-type functions. However, we introduce a novel approach that utilizes optimization via Markov chain Monte Carlo (MCMC) to infer vector populations by optimizing the impact of rainfall, leveraging existing data on human infection incidences. In particular, we developed a model based on a probabilistic and dynamical approach connecting rainfall to estimating the per-capita vector density in a SIR-SI (Susceptible, Infected, Recovered for human - Susceptible, Infected for vector) model of differential equations. Moreover, given the compelling evidence of rainfall’s impact on dengue, estimations are performed within identified seasons to align with the monsoon-induced rainfall patterns. Therefore, the estimation is demonstrated in an iterative process for each season in a feedback loop. This estimation algorithm based on Bayesian methods enabled uncertainty quantification using credible intervals for each season. Conducted in the hotspot of dengue emergence, which reports the highest number of dengue cases in Sri Lanka, this study provides critical insights for health authorities to enhance prevention and mitigation strategies.
Method and analysis
The highly densed population in the Colombo district continuously accounts for the highest number of reported dengue cases in the country. Within this district, Colombo Municipal Council (CMC) area stands out for its highest population density, with 24,857 residents per \(km^2\), making it the most densed region in the Colombo district40,41. Monsoons, southwest monsoon from May to September with average total rainfall 2500-4000 mm and the northeast monsoon from December to February with average total rainfall 1000−2000 mm, are one of the major origins of the rainfall patterns in Sri Lanka20,42. The Colombo district, situated in an agricultural wet zone, experiences greater benefits from the southwest monsoon compared to the northeast, primarily because of its geographical positioning (see Fig. 1(b)). Dengue incidences in Sri Lanka is found to be governed by the seasonal rainfall variations experienced throughout the year (see Fig. 1). Based on these rainfall variations, dengue emergence seasons can also be identified by calculating the periodicities of the reported dengue incidences. These periodicities of dengue and rainfall are quantified with Fast Fourier Transform (FFT). Fig. 2 depicting FFT amplitudes indicates both rainfall and dengue exhibit their peak levels at 6-month cycles (see Supplementary Material for numerical results). With these results of 6-month periodicities, a year is divided into 4 segments, which are referred to as seasons throughout the paper. The time span of a season was identified based on the increasing and decreasing trends in the reported rainfall fluctuations and a total of \(s=54\) rainfall seasons were identified during the period of 2009 January and 2022 December. Consequently, the number of weeks comprising each season may differ resulting in distinct durations. Moreover, the impact of rainfall on dengue emergence is studied through wavelet analysis25,46,47. In particular, a \(10 -\)week time lag has been identified between rainfall and dengue emergence in the CMC area.

Variations of dengue infections and rainfall. Variation of weekly (a) dengue infected human population (confirmed dengue infected patient count obtained from the National Dengue Control Unit (NDCU), Ministry of Health, Sri Lanka) and (b) rainfall in the CMC area from 2009−2022 (data obtained from the NASA power data access viewer48).

Periodicity of dengue and rainfall variations. Amplitudes are highest for 26 weeks in both (a) dengue (amplitude is 8133.34) and (b) rainfall (amplitude is 33192.65).
This study uses a SIR- SI compartmental model where human population has three epidemiological states - susceptible (\(S_h\)), infected (\(I_h\)), recovered (\(R_h\)), and vector population has two such states - susceptible (\(S_v\)) and infected (\(I_v\)) (see Fig. 3). Vectors have no recovery state since they do not survive long enough to undergo recovery from the disease. It is assumed the compartments respectively belonging to human and vector preserve a closed system, i.e. the populations are constant (\(N_h={S}_h+{I}_h+{R}_h\) and \(N_v={S}_v+{I}_v\)). One of the limitations of this study is the lack of data availability on distributions of Aedes species and their serotypes. As a result, to setup our model we assumed a homogeneous distribution for both serotype and species. The ordinary differential equations (ODE) system of five state variables is given in Supplementary Material. This five state variable model is reduced to three state variables \({I}_h, {R}_h, \text { and }{I}_v\) (\(3-D\)) using the assumption of closed populations (see Appendix 1 in Supplementary Material). Further, this \(3-D\) population model is converted to \(3-D\) density model by normalizing the state variables, i.e. \({I}={{I}_h}/{N_h}\), \({R}={{R}_h}/N_h\), \({V}={{{I}_v}}/{N_v}\). The reduced ODE system of I, R, and V is given in model (1). The definitions of model (1) parameters are given in Table 1.
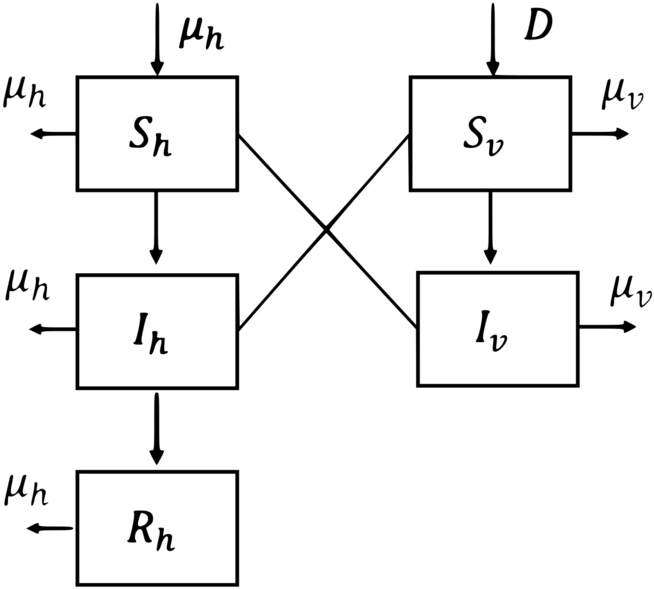
Schematic diagram of transmission of the dengue virus between human (host) and mosquito (vector) populations. \(S_h\), \(I_h\), and \(R_h\) are the susceptible, infected, and recovered host populations respectively. \(S_v\) and \(I_v\) are the susceptible and infected vector populations respectively.
Of the parameters in model (1), the ratio \({N_v}/{N_h}\) is defined as the per-capita vector density (z), which denotes the total number of vectores available per human. z is highly dependent on abundant vector breeding sites after rainfall21,22,25. Hence, we assume the vector population is directly proportional to the rainfall patterns (see Eq.(2)), since other environmental variables such as temperature and humidity are favorable to vector breeding throughout the year19,21,22. In this context, we presume a linear relationship due to the absence of evidence warranting the introduction of complexities inherent in a nonlinear model. Given the rainfall seasonality originated from monsoons we establish the relation in Eq.(2) seasonally. From this point onward, the bold symbols such as \(\textbf{E}\) represent vectors and non-bold symbols represent scalars. These vectors may vary in length for each season (see Supplementary Material).
where, for the \(i^{th}\) season, \(\textbf{E}_i\) is the reported weekly total rainfall, \(a_i\) is the rainfall coefficient, and \(\textbf{z}_i\) is the per-capita vector density. The simulation of model (1) for a season requires estimating \(\textbf{z}\) using rainfall, which in turn demands estimating a. We infer this parameter a for each season in an iterative process. The estimation procedure in Bayesian framework yields,
where \(\theta\) and x respectively denote the parameters and data. Here K is the normalization constant of the posterior probability distribution. In this problem, parameters (unknowns to be estimated) and data (observed information) are identified in Table 2. In parameter estimation, the actual dengue density data (\(\mathbf {I_{obs}}\)) are compared against the solutions of the ODE system (\(\hat{\textbf{I}}\)) in Eq.(1). Weekly reported dengue cases in the CMC area were obtained from the National Dengue Control Unit (NDCU) of Sri Lanka. We acknowledge that reported dengue incidences may not present the full spectrum of total infections. However, the consistency and rigor with which these reports are compiled by the NDCU provide a strong foundation for our analysis. The rainfall data required for this study were extracted from48. The remaining parameters in the model (\(\textbf{P}\)) were borrowed from the literature and assumed constant for every season49,50 (see Table 2). The borrowed parameter values for the simulation are provided in the Supplementary Material.We borrowed values from the literature due to the absence of experimental data specific to the Colombo district. Furthermore, we have assumed there is no significant change in these values during the study period, allowing us to utilize fixed values throughout the analysis.
Next we demonstrate the parameter estimation setup for a season and for brevity we eliminated the subscript i, which denotes seasons. The parameters and data applied to the model in (3) yields,
where \(\mathscr {I}\) denotes any background information according to the standard Bayesian setup. The error variance \(\sigma\) is sampled, independently from the Bayesian setup, using inverse gamma distribution and it is explained in the next section. There is no existing knowledge for the rainfall coefficient or the rainfall and thus we assume uniform priors for \(p\left( a|\textbf{E}, \mathscr {I}\right)\) and \(P(\textbf{E}|\sigma ,\mathscr {I})\). The log likelihood function, assuming errors in observed data follows Gaussian distribution yields,
where \(||.||^2\) denotes the L2 norm of the errors and \(\hat{\textbf{I}}=\displaystyle \int \dfrac{d\textbf{I}}{dt}dt\). Finally the log posterior distribution yields,
We then encapsulated this Bayesian posterior simulation process into the Alg. 1 showcasing the iterative procedure of parameter estimation for s number of seasons. The optimization problem is a \(\text {Min}_{a\in \mathbb {R}} \log p\left( a | \mathbf {I_{obs}},\textbf{E}, \textbf{P},\mathbf {Y_0},\sigma , \mathscr {I}\right)\).

Estimating rainfall coefficients, \(a_i,\quad i=1,\cdots ,s.\)
The marginal posterior distributions obtained for each seasonal rainfall coefficient parameter enable us to calculate the 95% credible intervals. These intervals provide a statistical range for each parameter, reflecting the uncertainty in our dengue incidence estimates. The sensitivity of rainfall coefficient estimates to the dengue incidence estimates are given by the credible intervals calculated from the uncertainties of rainfall coefficients and estimated dengue densities from the ODE model (1). Sensitivity of the parameters allow us to better understand the variability and reliability of our seasonal estimations and predictions. The model validation can be captured via estimates of dengue incidences during specific seasons, for example outbreak periods or festive seasons.
Results and discussion
The posterior distribution in Eq. (6) was simulated using MCMC toolbox of Delayed Rejection Adaptive Metropolis (DRAM) in MATLAB 2024a51,52. The MCMC algorithm systematically explores sample values for the rainfall coefficient \(a_i\), from a chosen probability distribution, which resulted in a series of random samples. For each of these sampled values of \(a_i\), the algorithm computes the corresponding output for \(\mathbf {\hat{I}}\) and compares it to the observed dengue incidences (\(\mathbf {I_{obs}}\)). We then choose the optimum parameter value from the sampled \(a_i\) values resulting the least error between \(\mathbf {\hat{I}}\) and \(\mathbf {I_{obs}}\) out of the sampled \(a_i\) values. This optimum \(a_i\) is then used to obtain the simulated \(\mathbf {\hat{I}}\). In the simulations of model (1), the initial values of \(\mathbf {Y_0}\) were chosen respectively to be [\(I_0,0,V_0, 10\)]. Here \(V_0\) is calculated assuming the vector population is at its quasi-equilibrium. \(I_0\) is the initial value in reported dengue infected human population density. The extracted values for \(\textbf{P}\) were \(\beta _h= 0.75, \mu _h= \frac{1}{75\hspace{0.1cm} \text {years}}, \beta _v=0.375, \gamma _h = \frac{1}{2\hspace{0.1cm} \text {weeks}}\) and \(\mu _v = \frac{1}{6 \hspace{0.1cm}\text {weeks}}\)49,50. The MCMC toolbox, DRAM, samples error variance values \(\sigma\) using an inverse gamma distribution (r, q) for each season (via update sigma \(=1\)51),
where \(r=(1+N)/2, q=2/(sd+SSE)\) with N, SSE respectively represent the sample size and the \(\Vert {\mathbf {I_{obs}} - \mathbf {\hat{I}}}\Vert ^2\). Starting from the second season, the initial values, \(I_0,R_0,V_0\), were extracted from the estimated solutions of the preceding season. Thus, the iterative estimations for all 54 seasons were performed solving the optimization problem in Alg. 1 using the MCMC simulations. For each season \(N_d=5\times 10^4\) simulations were sufficient to observe the convergence of the samples. With these obtained convergent samples \(30\%\) of initial samples were discarded for accuracy purposes and the marginal probability distributions were obtained for each seasonal parameter. Marginal distributions obtained for seasons 32, 50, 22, and 27 are depicted in Fig. 4. The best point estimate of \(a_i\) is taken as the mean of the marginal distribution,

Marginal distribution simulations of rainfall coefficients. Histograms of the marginal distribution obtained for 4 seasons(a) 2017 January-April (b) 2021 April-July, (c) 2009 July-October, (d) 2017 April-July are given. The red vertical lines indicate the means of marginal distributions. The black dashed lines indicate the 95% credible intervals of each marginal distribution.

Dengue infection density estimates of first two seasons in (a) \(s_1\) and (b) \(s_2\). The black circles indicate the reported dengue infected human population density and the red line indicates the estimated line. The fitted curve in (a) is obtained by taking the actual initial values at the beginning of the time period. The parameter value, \(a_1\) obtained for season 1 is 10.79. The fitted curve in (b) is obtained by taking the final values of the fitted curve in (a) as the initial values for season in (b). The parameter value, \(a_2\) obtained for season 2 is 2.13.
Figure 5 shows the solution curves of \(\mathbf {\hat{I}}\) against observed data (\(\mathbf {I_{obs}}\)) for the first two seasons. The uncertainties of these estimates were obtained by calculating the credible intervals at 95% level from the simulated marginal distributions of rainfall coefficients (\(a_i\)) (see Fig. 4). The estimates of rainfall coefficient (\(a_i\)) for all seasons are provided in Supplementary Material. The uncertainties of the rainfall coefficient allowed to obtain the uncertainties of the dengue densities, acknowledging the potential impact of undisclosed external variables. Figure 6 depicts the inferred infected population density (\(\mathbf {\hat{I}}\)) (red line) with their uncertainties (gray shades) for the whole study period. The results accurately captured the dengue outbreaks took place during 2017 (seasons \(32-35\)) and 2019 (seasons \(40-43\)) (see Fig. 6). In outbreak years the uncertainties are minimal, underscoring the precision of the estimates and the model’s ability to capture extreme cases when supported by evidence. These relatively narrow uncertainties in outbreak seasons compared to other seasons suggest rainfall is likely one of the primary factors contributing to these outbreaks. Our results effectively capture both the trends and seasonality in dengue incidences, revealing a strong correlation between dengue incidence patterns, fluctuations in vector density, and rainfall patterns. This highlights the significant impact of monsoon rainfall and its seasonality on the spread of dengue in the Colombo district. Consequently, seasonal variations in monsoon rainfall are likely to forecast corresponding seasonal variations in dengue incidences.
However, the estimated results show large uncertainties in specific seasons requiring further investigation. The highest uncertainties (width of the credible interval \(>10\)) are observed in season 21 (month April) and season 31 (month December). The marginal distributions of these seasons show the possible existence of mix Gaussian distribution suggesting the impact of some external factors possibly overpowering the impact of rainfall (Fig. 4(c)). Especially during the festive seasons in April and December, disease transmission elevates due to the increasing human mobility and population gatherings. The moderately high uncertainties are observed in seasons \(7,8,11,12,14-16,22,24,28,32,36,38,42,45,47,48\), and 53 (width of the credible interval between 3 and 6). In addition, unexpected above-average rainfall incidences also may have an impact in the differences shown in the marginal distributions. Utilizing initial values, per-capita vector density, and rainfall data specific to a particular season, the algorithm consistently forecasted dengue cases.
By utilizing these parameters, one can forecast upcoming dengue emergence using the rainfall data. Thus in this study, an out-of-sample forecast was employed where dengue emergence is forecasted for a period of 10 upcoming weeks using rainfall data. The uncertainty of forecast is inferred in two ways (Fig. 6 green box): the initial values \(\mathbf {Y_0}\) for the algorithm are chosen (a) as the point estimates from the last season (the inner shaded area in Fig. 6) and (b) as the credible interval (lower and upper bound values) of the last season (the outer shaded area in Fig. 6).

Estimated dengue infected human population density in the CMC area. The red line shows the estimated results (\(\mathbf {\hat{I}}\)) (see Supplementary Material). The gray circles show the reported infected human population density values calculated from the reported patient count data obtained from the NDCU (\(\mathbf {I_{obs}}\)). Uncertainties of results at 95% level are shown by the shaded gray color bands. Forecast of dengue emergence for one upcoming season is given in the green box. The forecast was obtained in two different ways. The inner band (solid line) in the forecast shows the uncertainty of the forecast based on the end point of the estimated dengue density in the previous season. The outer band (dash line) shows the uncertainty of the forecast based on the end points of the uncertainties (lower and upper) of the dengue estimates in the previous season.
Given the ongoing challenges in dengue eradication, particularly due to the absence of a cure or widely available vaccine, understanding the emergence patterns and timing of dengue outbreaks becomes a cornerstone of effective control and prevention strategies. The insights gained from this study in understanding the dengue emergence patterns are indispensable for enabling public health authorities to implement timely interventions, such as fogging with insecticides or the release of Wolbachia-infected mosquitoes, both of which play crucial roles in reducing vector populations and interrupting the transmission cycle of the virus. Additionally, understanding the timing and intensity of rainfall is pivotal in issuing early warnings to the public, empowering households to take necessary actions to eliminate potential vector breeding sites. This is especially critical in areas like the CMC, where high human mobility and dense populations create a fertile environment for rapid dengue transmission. In such settings, the interplay between rainfall conditions and vector activity becomes a vital factor in forecasting dengue outbreaks, thus enabling timely decision-making and the deployment of targeted control measures. The implications of these findings underscore the need for a nuanced, context-specific approach to dengue control, one that integrates environmental monitoring with public health strategies to mitigate the impact of this persistent threat.
The findings of this study provide a foundation for developing a comprehensive early warning system for dengue emergence in the hotspots of Sri Lanka. By leveraging the observed correlations between rainfall patterns and vector population dynamics, an automated system could be designed to predict periods of increased vector activity and, consequently, heightened disease risk. This system would analyze rainfall data in real-time, using predictive models to forecast vector emergence and potential dengue outbreaks. Such a proactive approach would allow public health authorities to issue timely warnings and implement preventive measures well in advance, significantly mitigating the threat of dengue. For instance, our study’s findings could inform the development of an efficient vector control system by determining the optimal timing for cleaning and insecticide application in relation to rainfall patterns. By anticipating risk and acting before the disease spreads, this system could play a crucial role in reducing the incidence of dengue and protecting vulnerable communities across the country.
This study operates under several key assumptions regarding the emergence of dengue fever within the CMC area. Firstly, this study and its findings are specific to the Colombo district in Sri Lanka, and therefore have limitations when generalizing to other regions globally. However, this study presents a methodology that can be adapted to areas with unique weather patterns. Considering the region-specific findings, we outline the inherent limitations of this study, which can be refined in future research. It is assumed the primary vectors responsible for dengue transmission, Aedes aegypti and Aedes albopictus, and their serotype distribution, are homogeneously distributed throughout the region. Due to the lack of these data in Colombo district, our estimates may not be accurate and possibly represent in the estimated uncertainties. Further our estimates do not represent the intensities of cases due to species type or the virus serotype. The emergence of dengue in this area is hypothesized to be predominantly driven by rainfall, given that other environmental conditions, such as temperature and humidity, are consistently favorable for the breeding and survival of these vector species. Thus, any dengue incidences caused by unexpected fluctuations in environmental conditions other than rainfall are not reflected in our results. In the ODE system, both human and vector populations are assumed to be within a closed system, where the total number of humans and vectors remains constant throughout the study, with no significant external migration or population shifts. This assumption could influence our results, especially given Colombo’s status as a commercial hub with high human mobility. However, we were able to account for this during the Christmas/New Year period through the uncertainties. Additionally, the study assumes that parameters like transmission rates, drawn from existing literature, remain constant over time, without considering potential seasonal variations, which could influence our estimates. Another limitation of our study is the lack of experimental data for the model parameters. Using actual values reflecting dengue transmission in the Colombo district could improve the accuracy of our results. However, these type of errors are usually captured by the uncertainty of results and therefore our estimates account for the possible errors in the chosen parameter values. Additionally, while we have configured our model using fixed parameter values, it would be advantageous to employ dynamic parameters for factors such as transmission rates, though this would add complexity.
Conclusions
In conclusion, the findings of this study underscore the significant impact of weather variability, particularly monsoon rainfall patterns, on the ecology of vectors and the transmission dynamics of dengue in Sri Lanka. By integrating real-time rainfall data into disease mathematical model, our study introduced an algorithm to forecasting dengue cases taking into account the changes in vector populations. In that approach, we were able to estimate dynamic surge in vector abundance and consequently the infected human dynamics. Through this study, we successfully established a robust relationship between vector population dynamics and rainfall patterns. By elucidating how fluctuations in rainfall influence the breeding habitats of disease vectors, we gained valuable insights into the mechanisms driving dengue transmission. Leveraging this understanding, we developed a predictive model that not only quantified changes in vector populations but also enabled us to forecast dengue occurrences. Our study focuses on the Colombo Municipal Council (CMC) area, known for its high population density and significant dengue burden compared to other regions in the country. Our algorithm closely mirrored recorded dengue cases, accurately capturing outbreaks, particularly those in 2017 and 2019. Leveraging Bayesian methods, we quantified the uncertainty of our estimates (Fig. 6). While outbreaks exhibited low uncertainty indicating accurate predictions and the model’s capacity to capture extreme cases when supported by evidence, some seasons displayed large uncertainties suggesting the influence of undisclosed external factors apart from rainfall.
Upon careful observation the inferred high uncertainties are recorded in many of the seasons following Christmas/New Year times. Colombo Municipal Council (CMC) area being the commercial city of the country, Christmas and New year makes it the busiest and the most crowded city during these festive times. Due to the high population density with their frequent inbound and outbound mobility during the festivities, the city’s environmental pollution expected to elevate significantly. Thus during these seasons, the impact of rainfall is overpowered verifying the marginal distribution with high uncertainty. Other seasons with large uncertainties are reported following the seasons having above-average rainfall. Hence, it can be concluded, the external factors may dominate the impact of rainfall and may produce uncertainties in the forecast.
In summary, the iterative algorithm introduced in this study aims to estimate seasonal per-capita vector density and dengue cases using a probabilistic and dynamic modeling approach. By validating against real data and quantifying uncertainty, our approach demonstrates its effectiveness in precisely identifying outbreak years. Moreover, the uncertainty quantification reveals further insights into the elevated risk of dengue, emphasizing the necessity for continued exploration in future studies.
Data availability/Availability of data and materials
The data that support the findings of this study are available from the National Dengue Control Unit (NDCU), Ministry of Health, Sri Lanka, but restrictions apply to the availability of these data, which were used under license for the current study, and so are not publicly available. Data are however available from the author, Piyumi Chathurangika upon reasonable request and with permission of the National Dengue Control Unit (NDCU), Ministry of Health, Sri Lanka.
References
Halstead, S. B. Pathogenesis of dengue: challenges to molecular biology. Science 239(4839), 476–481. https://doi.org/10.1126/science.3277268 (1988).
Bhatt, S. et al. The global distribution and burden of dengue. Nature 8, 504–507. https://doi.org/10.1038/nature12060 (2013).
Guzman M., Halstead S., Artsob H.,Buchy P., Farrar J., Gubler D., Hunsperger E., Kroeger A., Margolis H., Martínez E., et al., Dengue: a continuing global threat. Nature reviews microbiology[SPACE] https://doi.org/10.1038/nrmicro2460 .
World Health Organization. Communicable disease threats report: Week 11, 12–18 March 2023 (World Health Organization, Weekly bulletin, 2023).
Siddique A. B. , Omi N. T., Rasel S. M.,Hoque S. S. B. ,Rahman N.,Sarker S., Ghosh A.,Ahmed I.,Akash Y., Ahmed A., et al., Assessment of perceived dengue risk and prevention practices among youth in Bangladesh. Scientific Reports 14 (1) (2024).
World Health Organization (WHO), Dengue and severe dengue, accessed: April 14, 2023 https://www.who.int/news-room/fact-sheets/detail/dengue-and-severe-dengue (2021).
Ministry of Health. Sri Lanka (National Dengue Control Programme, Ministry of Health, Sri Lanka, 2019).
National Dengue Control Unit, Ministry of Health, Nutrition and Indigenous Medicine, Sri Lanka, National action plan on prevention and control of dengue 2019-2023 (2019).
Padmanabha H., Durham D., Correa F., Diuk-Wasser M.,Galvani A., The interactive roles of Aedes aegypti super-production and human density in dengue transmission. PLoS Neglected Tropical Diseases 6[SPACE] https://doi.org/10.1371/journal.pntd.0001799 (2012).
Focks D., A review of entomological sampling methods and indicators for dengue vectors. World Health Organization (2004).
Liu-Helmersson J., Stenlund H.,Wilder-Smith A. et al., Vectorial capacity of Aedes Aegypti: Effects of temperature and implications for global dengue epidemic potential. PLoS ONE 9 (3)[SPACE] https://doi.org/10.1371/journal.pone.0089783 (2014).
World Mosquito Program, How climate change is amplifying mosquito borne diseases (2019).
Naish, S. et al. Climate change and dengue: a critical and systematic review of quantitative modelling approaches. BMC infectious diseases 14(1), 1–14. https://doi.org/10.1186/1471-2334-14-167 (2014).
Leung, X. Y. et al. A systematic review of dengue outbreak prediction models: Current scenario and future directions. PLOS Neglected Tropical Diseases 17(2), e0010631 (2023).
Ong S. Q., Isawasan P., Ngesom A. M. M., Shahar H., Lasim A. m. M., Nair G., Predicting dengue transmission rates by comparing different machine learning models with vector indices and meteorological data. Scientific reports 13 (1) 19129 (2023).
Tjaden N. B. , Thomas S. M., Fischer D., Beierkuhnlein C., Extrinsic incubation period of dengue: knowledge, backlog, and applications of temperature dependence PLoS Neglected Tropical Diseases 7 (6) e2207. https://doi.org/10.1371/journal.pntd.0002207 (2013).
Wang, X., Tang, S., Wu, J., Xiao, Y. & Cheke, R. A. A combination of climatic conditions determines major within-season dengue outbreaks in Guangdong Province. China Parasites & vectors 12(1), 1–10. https://doi.org/10.1186/s13071-019-3295-0 (2019).
Robert M. A., Christofferson R. C., Weber P. D., Wearing H. J., Temperature impacts on dengue emergence in the United States: Investigating the role of seasonality and climate change Epidemics 28 (9)[SPACE] https://doi.org/10.1016/j.epidem.2019.05.003 (2019).
Liyanage. P., The Influence of Climate and Public Health Interventions on Aedes Vectors and Dengue in Sri Lanka, Umea universitet (2022).
World Bank Group, Sri Lanka Climate Change Knowledge Portal Profile. Climate Change Knowledge Portal. (2020).
Sirisena, P., Noordeen, F., Kurukulasuriya, H., Romesh, T. A. & Fernando, L. Effect of climatic factors and population density on the distribution of dengue in Sri Lanka: A GIS based evaluation for prediction of outbreaks. PLoS ONE 12(1). https://doi.org/10.1371/journal.pone.0166806 (2017).
Pratchaya, Chanprasopchai I. & M. T. Puntani Pongsumpun, Effect of rainfall for the dynamical transmission model of the dengue disease in Thailand. Computational and Mathematical Methods in Medicine[SPACE] https://doi.org/10.1155/2017/2541862 (2017).
Li, C., Lim, T., Han, L. & Fang, R. Rainfall, abundance of Aedes Aegypti and dengue infection in selangor, malaysia. The Southeast Asian journal of tropical medicine and public health 16(4), 560–568 (1985).
Naqvi S. A. A., Jan B., haikh S., Kazmi S. J. H., Waseem L. A., Nasar-u minAllah M., Abbas N., Changing climatic factors favor dengue transmission in lahore, pakistan. Environments 6 (6) (2019).
Chathurangika P., De. Silva K., and Perera S. S. N.. Dengue disease prediction with seasonality of environmental factors. , Communications in Combinatorics, Cryptography & Computer Science, 1 29–38, (2023).
Tambo, E., Chen, J. H., Zhou, X. N. & Khater, E. I. Outwitting dengue threat and epidemics resurgence in asia-pacific countries: strengthening integrated dengue surveillance, monitoring and response systems. Infectious diseases of poverty 5(1), 1–5. https://doi.org/10.1186/s40249-016-0148-3 (2016).
Faruk, M., Jannat, S. & Rahman, M. S. Impact of environmental factors on the spread of dengue fever in Sri Lanka. International Journal of Environmental Science and Technology 19, 10637–10648. https://doi.org/10.1007/s13762-021-03905-y (2022).
Edirisinghe. G, Contribution of rainfall patterns for increased dengue epidemic in Sri Lanka. American Scientific Research Journal for Engineering, Technology, and Sciences (ASRJETS) 35 (1) 284–294 (2017).
Sun, W., Xue, L., & Xie, X. Spatial-temporal distribution of dengue and climate characteristics for two clusters in Sri Lanka from 2012 to 2016. Scientific Reports 7, (2017). https://doi.org/10.1038/s41598-017-13163-z.
Ehelepola, N., Ariyaratne, K., Buddhadasa, W., Ratnayake, S. & Wickramasinghe, M. A study of the correlation between dengue and weather in kandy city, Sri Lanka (2003–2012) and lessons learned. Infectious Diseases of Poverty 4, 1–15. https://doi.org/10.1186/s40249-015-0075-8 (2015).
Withanage, G. P., Viswakula, S. D., Gunawardena, Y. I. N. S. & Hapugoda, M. D. A forecasting model for dengue incidence in the District of Gampaha. Sri Lanka. Parasites & vectors 11, 1–10 (2018).
Goto, Kensuke, Balachandran Kumarendran, Sachith Mettananda, Deepa Gunasekara, Yoshito Fujii, and Satoshi Kaneko. Analysis of effects of meteorological factors on dengue incidence in Sri Lanka using time series data. PloS one 8 (5). : e63717 (2013).
Ramírez-Soto M.C., Machuca J.V.B., Stalder D.H., Champin D., Mártinez-Fernández M.G., Schaerer C.E., SIR-SI model with a Gaussian transmission rate: Understanding the dynamics of dengue outbreaks in Lima, Peru. PLoS ONE 18 (4) : e0284263. (2023). 10.1371/journal.pone.0284263
Derouich, M., Boutayeb, A. & Twizell, E. A model of dengue fever. Biomedical engineering online 2(1), 1–10 (2003).
Lee, C. et al. Epidemic prediction of dengue fever based on vector compartment model and Markov chain Monte Carlo method. BMC bioinformatics 22, 1–11 (2021).
Reiner, R. C. Jr. et al. A systematic review of mathematical models of mosquito-borne pathogen transmission: 1970–2010. Journal of The Royal Society Interface 10(81), 20120921 (2013).
Martheswaran, T. K., Hamdi, H., Al-Barty, A., Zaid, A. A. & Das, B. Prediction of dengue fever outbreaks using climate variability and markov chain monte carlo techniques in a stochastic susceptible-infected-removed model. Scientific Reports 12(1), 5459 (2022).
Pandey, A., Mubayi, A. & Medlock, J. Comparing vector–host and SIR models for dengue transmission. Mathematical Biosciences 246(2), 252–259. https://doi.org/10.1016/j.mbs.2013.10.007 (2013).
Erandi, K. K. W. H., Perera, S. S. N. & Mahasinghe, A. C. Analysis and forecast of dengue incidence in urban Colombo, Sri Lanka. Theoretical Biology and Medical Modelling 18, 1–19 (2021).
Colombo Municipal Council, https://www.colombo.mc.gov.lk/colombo.php , accessed: 18 April 2023.
Ministry of Transport and Civil Aviation, Sri Lanka, Urban transport system development project for Colombo metropolitan region and suburbs (2008).
Karunathilaka K., Dabare H., Nandalal K., Changes in rainfall in Sri Lanka during 1966-2015. Engineer: Journal of the Institution of Engineers, Sri Lanka 50 (2), 10.4038/engineer.v50i2.7251 (2017).
Dalpadado, R., Amarasinghe. D., Gunathilaka. N., and Ariyarathna. N., Bionomic aspects of dengue vectors Aedes aegypti and Aedes albopictus at domestic settings in urban, suburban and rural areas in Gampaha District, Western Province of Sri Lanka. Parasites & Vectors 15 1-148 (2022).
Herath, J. M. K., Abeyasundara, H. T., De Silva, W. P. P., Weeraratne, T. C., and Karunaratne, S. P., Weather-Based Prediction Models for the Prevalence of Dengue Vectors Aedes aegypti and Ae. albopictus. Journal of Tropical Medicine 1 4494660 (2022).
Noordeen, F. et al. Distribution of dengue vectors, Aedes aegypti and Aedes albopictus, in a few selected semi-urban areas of the Central Province of Sri Lanka. Sri Lankan Journal of Infectious Diseases 8, 1 (2018).
Santos, C. A. G. et al. Correlation of dengue incidence and rainfall occurrence using wavelet transform for João Pessoa city. Science of The Total Environment 647, 794–805. https://doi.org/10.1016/j.scitotenv.2018.08.019 (2019).
Thai K. T., Cazelles B., Nguyen N. V., Vo L. T., Boni M. F., Farrar J., Simmons C. P., R. van Doorn H., de Vries P. J., Dengue dynamics in Binh Thuan province, southern vietnam: periodicity, synchronicity and climate variability. PLoS neglected tropical diseases 4 (7) e747. 10.1371/journal.pntd.0000747 (2010).
NASA POWER Data Access Viewer, https://power.larc.nasa.gov/data-access-viewer/, accessed: January 2023.
Newton, E. A. & Reiter, P. A model of the transmission of dengue fever with an evaluation of the impact of ultra-low volume (ULV) insecticide applications on dengue epidemics. The American journal of tropical medicine and hygiene 47(6), 709–720 (1992).
Vector Disease Control International, Mosquito biology 101: Life cycle, https://www.vdci.net/mosquito-biology-101-life-cycle/#:\(\sim\):text=Females%20with%20an%20adequate%20food,in%20addition%20to%20plant%20nectar. Accessed: 02-01-2024.
Haario, H., Laine, M., Mira, A. & Saksman, E. Dram: Efficient adaptive mcmc. Statistics and computing 16, 339–354. https://doi.org/10.1007/s11222-006-9438-0 (2006).
The MathWorks, Inc 2024a, https://www.mathworks.com/products/matlab.html
Acknowledgements
Dengue data for this study were kindly provided by Dr. Sudath Samaraweera, the Director of the National Dengue Control Unit, Ministry of Health of Sri Lanka.
Author information
Authors and Affiliations
Contributions
P. C. - Methodology, Investigation, Simulations, Writing the original draft and editing. S. S. N. P. - Review and discussions. K. D. S - Conceptualize, Investigation, Methodology, Writing the original draft and editing. All authors read and approved the final manuscript.
Corresponding author
Ethics declarations
Competing interests
The authors declare no competing interests.
Additional information
Publisher’s note
Springer Nature remains neutral with regard to jurisdictional claims in published maps and institutional affiliations.
Supplementary Information
Rights and permissions
Open Access This article is licensed under a Creative Commons Attribution-NonCommercial-NoDerivatives 4.0 International License, which permits any non-commercial use, sharing, distribution and reproduction in any medium or format, as long as you give appropriate credit to the original author(s) and the source, provide a link to the Creative Commons licence, and indicate if you modified the licensed material. You do not have permission under this licence to share adapted material derived from this article or parts of it. The images or other third party material in this article are included in the article’s Creative Commons licence, unless indicated otherwise in a credit line to the material. If material is not included in the article’s Creative Commons licence and your intended use is not permitted by statutory regulation or exceeds the permitted use, you will need to obtain permission directly from the copyright holder. To view a copy of this licence, visit http://creativecommons.org/licenses/by-nc-nd/4.0/.
About this article

Cite this article
Chathurangika, P., Perera, S.S.N. & De Silva, S.A.K. Estimating dynamics of dengue disease in Colombo district of Sri Lanka with environmental impact by quantifying the per-capita vector density. Sci Rep 14, 24629 (2024). https://doi.org/10.1038/s41598-024-76176-5
Received:
Accepted:
Published:
Version of record:
DOI: https://doi.org/10.1038/s41598-024-76176-5
