
Abstract
Accurately and early diagnosis of melanoma is one of the challenging tasks due to its unique characteristics and different shapes of skin lesions. So, in order to solve this issue, the current study examines various deep learning-based approaches and provide an effective approach for classifying dermoscopic images into two categories of skin lesions. This research focus on skin cancer images and provides solution using deep learning approaches. This research investigates three approaches for classifying skin cancer images. (1) Utilizing three fine-tuned pre-trained networks (VGG19, ResNet18, and MobileNet_V2) as classifiers. (2) Employing three pre-trained networks (ResNet-18, VGG19, and MobileNet v2) as feature extractors in conjunction with four machine learning classifiers (SVM, DT, Naïve Bayes, and KNN). (3) Utilizing a combination of the aforementioned pre-trained networks as feature extractors in conjunction with same machine learning classifiers. All these algorithms are trained using segmented images which are achieved by using the active contour approach. Prior to segmentation, preprocessing step is performed which involves scaling, denoising, and enhancing the image. Experimental performance is measured on the ISIC 2018 dataset which contains 3300 images of skin disease including benign and malignant type cancer images. 80% of the images from the ISIC 2018 dataset are allocated for training, while the remaining 20% are designated for testing. All approaches are trained using different parameters like epoch, batch size, and learning rate. The results indicate that combining ResNet-18 and MobileNet pre-trained networks using concatenation with an SVM classifier achieved the maximum accuracy of 92.87%.
Introduction
Dermatology is the branch of medical science that focuses on the intricate elements of the skin, hair, and nails. A dermatologist is a medical professional who specializes in identifying and treating skin diseases. In the present era, it is of utmost importance to accurately detect infections as skin illnesses pose a significant threat to world health and can inflict substantial damage upon individuals. In order to minimize the time and effort spent by dermatologists and patients, a completely automated symptomatic system is necessary, especially in wealthy countries1.
Unlike other illnesses, skin disorders are more prevalent. Most skin problems are typically long-lasting, caused by infections, and often goes into skin cancer. Early identification of skin issues is crucial for mitigating their growth and proliferation. Diagnosing and treating skin illnesses can be a lengthy process that requires a significant amount of time and effort. Additionally, it can be financially burdensome and physically demanding for the patient2,3. Computer-based diagnosis for dermoscopic image analysis is employed due to its ability to produce faster and more accurate results compared to human analysis using laboratory techniques. Deep learning is the predominant technology used for predicting skin disorders.
CNNs are frequently used for classification and image recognition. The literature contains a variety of CNN-based designs used to identify skin cancer4,5. Currently, transfer learning techniques can be used, which is pre-trained on large image datasets such as ImageNet, particularly when working with small-sized datasets. These pre-trained models can serve as a fixed feature extractor for tasks such as object detection, picture segmentation, and image classification. As an illustration, a model that has been trained on ImageNet can be further optimized on a smaller dataset that focuses on a specific object or scene in order to enhance its performance6.
In an effort to enhance performance, numerous researchers have combined the CNNs with traditional machine learning techniques for classification, such as decision trees (DT), k-nearest neighbor (k-NN), and support vector machines (SVM)7,8,9. This work examines various deep learning approaches and provide an effective approach for early and accurately diagnose cancer symptoms from lesion images.
In order to improve the accuracy of diagnosis system, a number of issues related to skin lesion classification must be addressed. Class imbalance and the inherent variability of lesions are two important aspects that lead to these difficulties.
The uneven distribution of benign and malignant lesions creates a substantial challenge in the classification of skin lesions due to class imbalance. Due to this discrepancy, models may exhibit bias towards the dominant class, which results in higher accuracy but lower sensibility for the minority class. This disparity can be rectified using techniques such as oversampling minority classes or utilizing data augmentation. Nonetheless, the effectiveness of these strategies may vary, requiring meticulous model development.
Classifying skin lesions universally is difficult due to their varied morphology (differing in shape, size, color, and texture), numerous subtypes and their attributes (including melanoma, basal cell carcinoma, and squamous cell carcinoma), as well as environmental and temporal influences (such as skin types, lighting conditions, and seasonal variations).
The complex relationship between class imbalance and lesion variability requires a robust, adaptable classification methods. Addressing these issues not only improves the model’s ability to distinguish between benign and malignant tumors, but also increases diagnostic confidence in clinical settings. The inclusion of a comprehensive analysis of class imbalance and lesion variability in the study emphasizes its motivation, highlighting the need for novel methodologies in skin lesion classification. The main objective of this research is to develop a diagnostic model for dermatology by recognizing and resolving these issues and provide more accurately distinguish benign from malignant tumors, regardless of their subtypes. proposed work innovatively combines deep learning techniques with traditional machine learning classifiers to enhance the accuracy of cancer diagnosis from lesion images. While prior research has explored individual methods, our approach is distinctive in the integration of fine-tuned pre-trained networks (VGG19, ResNet-18, and MobileNet_V2) not only as classifiers but also as feature extractors in conjunction with various machine learning algorithms (SVM, decision trees, Naïve Bayes, and k-NN).
Proposed work is divided into four modules. The first module handles the pre-processing of the image, which includes resizing it to 224 × 224 × 3 dimensions, eliminating extraneous noise, and improving image quality. image segmentation is then used in the next module to extract the skin lesions from the image and give them a more meaningful shape. In this module we have adopted snake model based active contour technique for automatic skin lesions segmentation. In the third module we applied three different deep learning approaches for classification purpose. (1) Utilizing three fine-tuned pre-trained networks (VGG19, ResNet18, and MobileNet_V2) as classifiers. (2) Employing three pre-trained networks (ResNet-18, VGG19, and MobileNet v2) as feature extractors in conjunction with four machine learning classifiers (SVM, DT, Naïve Bayes, and KNN). (3) Utilizing a combination of the aforementioned pre-trained networks as feature extractors in conjunction with same machine learning classifiers. Lastly, we examine all deep learning strategies and recommends an effective approach for diagnose cancer symptoms.
This comprehensive framework not only improves the differentiation of benign and malignant tumors across various subtypes but also addresses existing gaps in early cancer detection, offering significant contributions to the fields of medical imaging and diagnostic technologies.
Remainder of the paper is as follows: Sect. 2 explains to the survey of literature. The proposed process is explained in Sect. 3. Results and discussion are covered in Sect. 4, and the conclusion is covered in Sect. 5.
Review of literature
CNN-based methods
Several studies have explored the use of Convolutional Neural Networks (CNNs) for skin lesion classification due to their strong performance in image-based tasks. For instance, Hosny et al.10 employed a deep convolution neural network (DCNN) to identify common nevus, atypical nevus, and melanoma from the PH2 skin cancer dataset. The scientists employed AlexNet to categorize various skin malignancies from the PH2 dataset, drawing inspiration from the diverse applications of DCNN architecture. First, AlexNet was utilized for Imagenet’s visual recognition. Imagenet is made up of three completely connected layers, one maxpooling layer, and five convolution layers. There is no pooling layer in the third or fourth convolution layers. To categorize skin lesions, a softmax layer has been added in place of the final layer of the AlexNet in this work. The weights are updated using a stochastic gradient and are fine-tuned using backpropagation. Similarly, Nazia Hameed et al., utilized a pre-trained AlexNet model for categorizing skin lesions into five categories: benign, malignant melanoma, eczema, acne, and healthy, achieving an accuracy of 86.21%11. Based on the standard deviation of the classifier’s weight matrix, Albahar12 proposed a unique regularizer-based CNN approach for classifying skin lesions. Since the filter values match the weight matrix, a new regularizer is incorporated into the convolution layer. The classifier’s complexity can be decreased by restricting its values. Their technique yielded a 97.49% accuracy rate when tested on the ISIC 2018 dataset. The CNN method was utilized by Malliga et al.13 for training and classifying a variety of clinical image types. Three categories of skin conditions have been taken. These three conditions—melanoma, nevus, and seborrheic keratosis—achieved 71% accuracy. Maron et al.14 proposed a classifier that distinguishes melanoma from four other classes of skin diseases. The study demonstrated that the CNN surpassed 112 dermatologists with varying levels of experience in accurately classifying images into five diagnostic categories, achieving a sensitivity of 98.8%.
Some studies have focused on improving the general performance of CNNs for skin lesion classification. Zhao et al. utilized DenseNet201 and StyleGAN for dermoscopy image classification, achieving 93.64% accuracy on the balanced ISIC2019 dataset15. Mendes suggested a deep CNN architecture based on the pre-trained ResNet-152 to categorize 12 distinct types of skin lesions16. Their model was trained with 3797 lesion photos at first, but subsequently, 29 augmentations were made based on scale transformations and illumination placements. For the classification of hemangioma lesion, pyogenic granuloma (PG) lesion, and intraepithelial carcinoma (IC) skin lesions, the suggested method yielded an AUC value of 0.99.
Some work has also emphasized ensemble models and multi-modal techniques to improve skin lesion classification. For example, Le et al. proposed a ResNet50 ensemble model that made use of class weight and focus loss to address the issues given by an unbalanced dataset. 93.00% accuracy was shown by their suggested model on the HAM10000 dataset17. Kawahara et al. developed a multi-modal CNN trained on clinical, dermoscopic, and meta-data to classify melanoma. They employed the idea of the criteria that dermatologists use to identify melanoma18.
The impact of image quality on deep learning model performance has also been explored. Akkoca Gaziolu and Kamaak found that noisy and blurry images negatively affected the classification accuracy of deep learning models in melanoma detection19. This highlights the importance of preprocessing and ensuring high-quality input images for better model performance.
Hybrid CNN-ML methods
Hybrid models that combine CNNs with traditional machine learning (ML) methods have also shown significant potential. For example, Codella et al. proposed a hybrid approach combining sparse coding, SVMs, and CNNs for melanoma detection, demonstrating the power of CNNs in this domain20. In their most recent study, Codella et al. created a framework for the segmentation and classification of skin lesions that takes advantage of recent developments in deep learning and machine learning techniques to achieve improved results on various datasets21. Another hybrid model proposed by Mahbod et al. utilizes pre-trained CNNs (AlexNet, ResNet-18, VGG16) for deep feature extraction, which are then fed into a multi-class SVM classifier. This method achieved an accuracy of 97.55% for seborrheic keratosis (SK) classification and 83.83% for melanoma on the ISIC 2017 dataset22.
Segmentation methods
Skin lesion segmentation is a crucial step in the accurate classification of skin conditions. Various segmentation techniques have been explored in the literature, many of which use CNNs to segment skin lesions. Pennisi et al. employed Delaunay Triangulation to extract binary masks from skin lesion locations where there is no need for a training phase12. Similarly, Yu used a Fully Convolutional Residual Network (FCRN) for dermoscopy lesion segmentation, which demonstrated the effectiveness of deep learning in handling complex segmentation tasks24.
Furthermore, Ma proposed a novel deformable model for skin lesion segmentation, which is resistant to noise and delivers high-quality segmentation results25. Thomas et al. utilized deep learning techniques for multi-class segmentation and classification of non-melanoma skin cancer using greyscale bioimages. Their method, although computationally intensive, showed promising results in distinguishing different types of skin cancer26. Begum and Asra employed a combination of k-NN classifier and fuzzy C-means (FCM) clustering for melanoma segmentation and classification. Their approach uses preprocessing, fuzzy c means clustering for segmentation, followed by feature extraction using color, correlogram, and fractal features, with classification performed by ANN and k-NN6.
Despite the progress in skin lesion classification using deep learning, challenges such as dataset imbalance, noise in images, and high computational demands remain. Future research may focus on developing more robust models capable of handling these challenges, as well as exploring multi-modal and transfer learning techniques to improve the generalization of models across diverse datasets and skin conditions. This paper explores different deep learning approaches to offer an efficient solution for classifying skin lesions. The proposed methodology operates as follows: initially, the skin disease dataset is acquired and preprocessed. Subsequently, skin lesion segmentation based on the snake model is performed. Then, several deep learning approaches are utilized for classification. Test outcomes are then compared and analyzed using a ISIC 2018 dataset.
Proposed methodology
Figure 1 depicts the flow chart of main processes in the proposed technique for identifying skin disorders. The flowchart consists of four stages: (1) preprocessing the initial image; (2) segmenting skin lesions; (3) Classifying using different deep learning models; and (4) Analyzing the results and provide an effective approach for skin lesions classification. A more detailed representation of the entire process can be seen in Fig. 2, where the block diagram illustrates each stage of the methodology in greater detail, including the flow of data from one process to another and the interaction between different components in the system.

Flow chat of proposed model

Block diagram of proposed model
Now, we describe, step by step, a detailed summary of each of the proposed sub-sections of the system.
Dataset
In this article, we conducted tests using the ISIC 2018 dataset27, which was obtained from publicly accessible sources. The ISIC 2018 training package comprises a collection of 3300 photographs depicting various skin lesions. The lesions are classified as either malignant or benign. Figure 3 showcases a selection of images from our dataset.
Simulations were conducted on the ISIC2018 dataset to demonstrate the efficacy of the training and testing sets, which were divided using an 80:20 ratio, as depicted in Fig. 3. The training set included 1800 benign and 1500 malignant images, and the testing set had 360 benign and 300 malignant images. Table 1 shows a summary with details about the dataset.

Shows some skin disease dataset
Data pre-processing
Prior to segmentation, images need to undergo into preprocessing step to improve their quality. Image pre-processing includes scaling, denoising, brightness enhancing, and normalizing. To tackle the problem of varying image sizes in the database, an input image (as seen in Fig. 4a) is resized. Image resizing reduces processing time, leading to increased efficiency. The original image with different sizes is adjusted to 224 × 224 × 3 pixels,, as seen in Fig. 4b. Gaussian noise and salt-and-pepper noise are removed from skin lesion images to imitate noise that may occur during image acquisition, thus improving the dataset28. The image quality is improved by applying the CLAHE algorithm29 after noise reduction. The CLAHE algorithm consists of three main components: tile generation, histogram equalization, and bilinear interpolation. The supplied image is initially segmented into pieces. Every division is referred to as a tile. Each tile undergoes histogram equalization with a predetermined clip limit. Histogram equalization involves five steps: computing the histogram, calculating the surplus, distributing the excess, redistributing the excess, and scaling and mapping with a cumulative distribution function (CDF). The histogram is calculated by creating a series of bins for each tile. Values in histogram bins exceeding the clip limit are gathered and redistributed into different bins. Cumulative distribution function (CDF) is computed based on the histogram data. The cumulative distribution function (CDF) values of each tile are adjusted and correlated with the pixel values of the input image. The tiles are combined using bilinear interpolation to create an output image with enhanced contrast. Figure 5 displays an example of the CLAHE enhancement approach.

Example of resizing image of Skin Image database

Example of image smoothness after CLAHE operation
Segmentation based on snake model
The segmentation stage is performed to separate the entire lesion area from the background. This step is considered a crucial component in the diagnosis and treatment process30. Furthermore, it is an essential requirement for diagnosing skin lesions as it extracts distinctive characteristics of the lesions and provides significant ginformation on their shape, structure, texture, and color. The Active contours approach, as described in reference31, has been utilized to extract the region of interest (ROI) for segmentation of dermoscopic skin lesions in the ISIC-2018 dataset.
The active contours approach, commonly known as snakes, is an iterative algorithm used for segmenting images by region-growing. The active contour algorithm involves selecting starting curves on an image and subsequently utilizing the active contour function to progressively refine the curves towards the limits of objects.
The snake model is a versatile technique that has the capability to solve a wide range of segmentation issues. The primary function of the model is to detect and describe the specific object that is being examined for segmentation. It relies on a specific level of pre-existing information about the shape of the desired object, particularly when dealing with intricate objects. The active snake model, often known as snakes, is typically configured by applying splines to minimize energy, followed by the application of various forces that govern the image. A spline is a mathematical representation of a collection of polynomials used to construct geometric shapes, such as curves. The constraint forces are guided by a spline that minimizes energy. This spline is pulled using internal and exterior image forces, which are based on suitable contour characteristics. The snake model applies a deformable model to an image by minimizing energy. This model typically employs cubic polynomials, although higher order polynomials can be used, they are often avoided due to several undesired local characteristics that need to be addressed. Snake effectively handles intricate target objects by decomposing the figure into multiple smaller targets32,33.
The snake model is specifically intended to flexibly change its shape and location in order to efficiently search for the state of least energy. The snake algorithm iteratively minimizes the energy function by propagating through the image domain and dynamically adjusting its position towards the local minimum. The representation of a snake is denoted by the Eq. (1). The Snake model capitalizes on the parametric form of the curve, which offers several advantages over the use of implicit and explicit curve forms.
where x and y are the coordinates of the two-dimensional curve, v is spline parameter in the range 0–1, s is linear parameter ∈ [0,1] and t is time parameter ∈ [0, ∞].
The snake model encompasses both external forces and image forces, which aid in the detection of features. As the snake model traverses a closed curve, it is guided by both internal and external forces to maintain the lowest possible total energy. The total energy of the active snake model is the sum of three types of energy: internal energy (Ei), which is determined by the curvature of the spline representing the target image; external energy (Ee), which encompasses user-defined external forces and other contributing factors; and energy of the image under consideration (EI), which provides information about the illumination of the spline representing the target object. The Eq. (2) provides the total energy that is defined for the creation of the contour in the snake model.
The term “\(\:{E}_{internal}\)” refers to the internal energy that establishes limits on the smoothness of the contour. The parameter α determines the extension length of the snake and its elasticity capacity. Beta determines the stiffness level of the snake. Equation (3) provides the internal energy.
External energy limitations mostly determine the snake’s position close to the desired local minimum. It can be characterized by advanced understanding and engagement.
The equation above, Eq. (4), displays the outline of the target object, with \(\:{w}_{1}\) referred to as the line efficiency and \(\:{w}_{2}\) as the edge efficiency. Snake will orient itself towards darker pixel areas with higher values of \(\:{w}_{1}\) and \(\:{w}_{2}\) when the value is positive, and move towards brighter pixels when the value is negative. Snake model employed for segmenting different image kinds.
The use of active snake models is growing significantly, particularly in several imaging domains. In the medical imaging sector, a snake model is utilized to segment a specific portion of an image that possesses distinct qualities in comparison to other regions of the picture. numerous uses of the classic snake model in medical imaging include optic disc and cup segmentation for glaucoma detection, cell image segmentation, vascular region segmentation, and segmentation of numerous other regions for diagnosing illnesses or anomalies. For instance, the snake model is used to segment the skin lesion from the skin image seen in Fig. 6. A contour has been created around the skin lesion for additional processing.

Shows Segmented Image after applying active contour
Classification based on deep learning models
In this step we examine three different deep learning-based approaches for classifying dermoscopic images into two categories of skin lesions. These are:
-
1.
ResNet-18, VGG19, and MobileNet v2 as feature extractor in conjunction with SVM, DT, Naïve Bayes, and KNN as classifier.
-
2.
Combination of ResNet-18, VGG19, and MobileNet v2 as feature extractors in conjunction with same machine learning methods as classifier.
-
3.
VGG19, ResNet18, and MobileNet_V2 as Fine-tuned classifiers.
Transfer learning for feature extraction and machine learning for classification
Due to the small size of the dataset in this experiment, combined with a particular depth of the deep neural network, makes it susceptible to overfitting during the training process. This, in turn, results in a poor ability to accurately recognize patterns34,35. In this scenario, the pretrained convolutional neural network may be employed to extract previously acquired image features. Subsequently, the network can be retrained for the purpose of detecting and classifying using the dataset in this study. This approach facilitates rapid convergence of our model, resulting in significant time savings during training. In addition to this, feature extraction just needs one pass through the data, so you can speed up network training, if you don’t have a GPU. this can be a decent starting point. This stage involves extracting the acquired image features from a pre-trained convolutional neural network and use these features to build an image classifier. Feature extraction is a straightforward and efficient method to utilize the representational capabilities of pretrained deep networks, for instance, you can train different classifiers, such as k-nearest neighbors (KNN) and support vector machine (SVM), using the retrieved features.
The combination of feature extraction and classification algorithms, yields greater performance compared to using feature extractors alone. The pre-trained network can be used to extract the features and the ML classifier receives the retrieved features as input and can classify the images as output. So, in this study, we employed VGG19, Resnet18, and MobileNetV2 as feature extractor which are the most basic, and make modifications to adapt it to our cancer classification task and DT, k-NN, Naïve Bayes and SVM as classifiers. All of the aforementioned pre-trained networks utilized the weight parameters from the ImageNet dataset35 which contains more than a million images of different categories. The following sub section provides the details of each pre-trained network models.
-
ResNet 18
An efficient deep CNN for extracting features from images is known as ResNet18. High-level deep features of pictures can be extracted using ResNet18 as a feature extractor, and these features are then fed into the classifier. ResNet-18 is composed of a fully connected layer, a maxpooling layer with a 3 × 3 filter size, and seventeen convolutional layers. These seventeen layers is divided into eight residual building components and one convolutional layer. Residual building block is the fundamental framework of the ResNet-18 network. Figure 7 depicts the block’s structure37 of ResNet-18 network. Direct addition of the input vector and the vector output through the convolutional layer is possible38, after which the rectified linear unit (ReLU) activation function outputs the result. This technique can eventually raise the accuracy of wood knot defect recognition while effectively resolving the issue of a vanishing gradient or exploding gradient brought on by an increase in neural network depth. A 33.16 million parameters of classical ResNet-18 model applies batch normalization (BN) and the ReLU activation function to the back of each convolutional layer in a “basic block” of convolutional layers. Table 2 displays the ResNet-18 structure.
Table 2 Structure of ResNet 18 Fig. 7 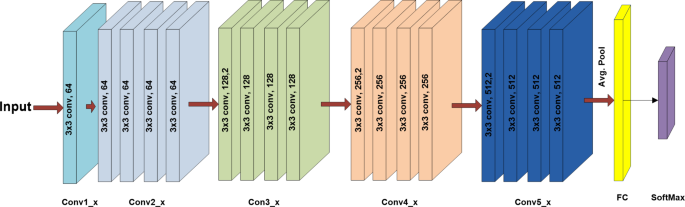
Visualization of resnet-18
-
VGG19
The simplicity of this network is what makes it unique. 3 × 3 convolutional layers are placed on top of one another in five blocks each. Max pooling of 2 × 2 kernels with a stride of 2 reduces volume size. Two fully-connected layers with 4096 nodes each and ReLU activation function come after it. Softmax serves as the activation function for 1000 nodes in the final layer39. There are roughly 143 million parameters in VGG19 overall. Canziani40 mentions a few VGG net uses in this article. Figure 8 shows the visulaization of vgg19 deep learning network. Table 3 displays the VGG19 structure.
Fig. 8 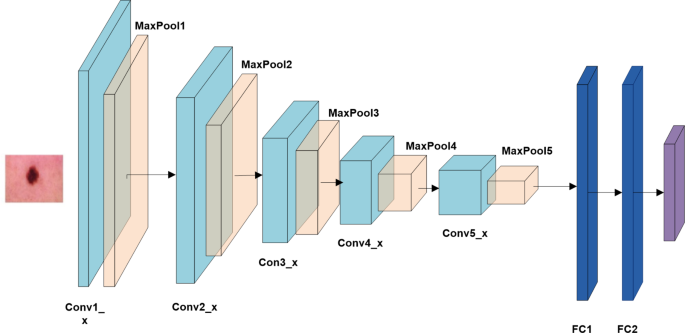
Visualization of VGG19
Table 3 Structure of VGG19 -
MobileNetV2
A CNN-based model called MobileNet V241 is widely used for image classification. The primary benefit of utilizing the MobileNet architecture is that, in comparison to the traditional CNN model, it requires significantly less computing effort, which makes it appropriate for use with mobile devices and PCs with less processing power42. The convolution layer of the MobileNet model, which is a streamlined structure, is useful for differentiating details based on two controllable parameters that efficiently flip between latency and accuracy. Reducing the size of the network is a benefit of the MobileNet paradigm43.
MobileNet is designed in a depth-wise manner43. With 53 convolution layers and 1 average pool, the MobileNet V2 model has around 350 GFLOP. It consists of two primary parts: The Residual Block and inverted Remaining Bottleneck Block. Each block has 3 different layers: 1 × 1 Convolution with Relu6, Depthwise Convolution and 1 × 1 Convolution without any linearity. In the MobileNet V2 design, thre are two types of convolution layers: 1 × 1 Convolution and 3 × 3 Depthwise Convolution. Figure 9 shows the details of MobileNet V2 architecture. The aforementioned idea aims to streamline the model and accelerate it beyond the standard convolutional neural network.
Fig. 9 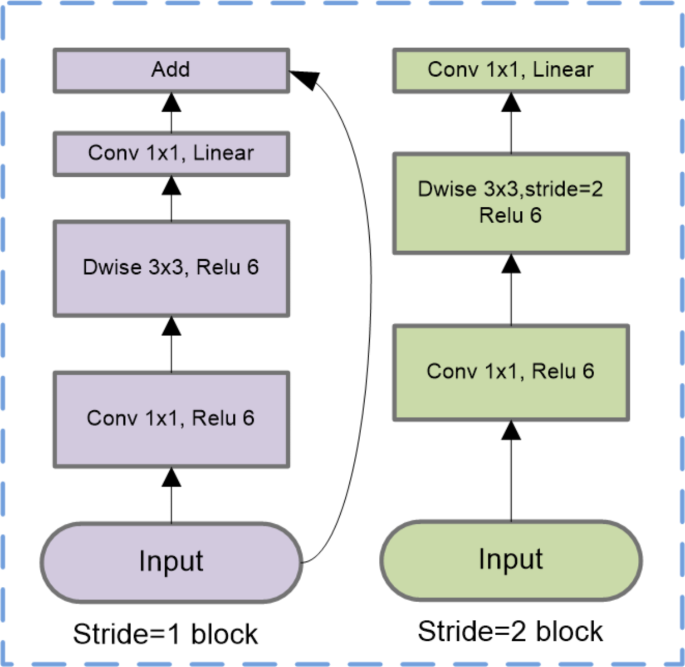
Visualization of MobileNet V2
The four different machine learning classifying techniques based on dermoscopic images feature dataset received from three pre-trained deep learning technique were applied. Short information about each of the classifying techniques, i.e., SVM, KNN, Naïve bayes and DT are given in the following subsection.
-
SVM
SVM is a supervised learning model that evaluates data for regression and classification along with related learning methods.
Vapnik and associates developed it at AT&T Bell Laboratories. Based on the statistical learning framework, it offers one of the most reliable prediction techniques44. When data has precisely two classes, SVM can be utilized. In order to classify the data The optimal hyperplane to divide all the data points of one class from all the data points of the other class can be found by an SVM. The hyperplane with the biggest margin between the two classes is the optimal one for an SVM. The maximum width of the slab parallel to the hyperplane with no inside data points is represented by the margin. Situated on the slab’s edge, the data points closest to the dividing hyperplane are known as the support vectors. Figure 10 shows the concept of SVM in brief.
Fig. 10 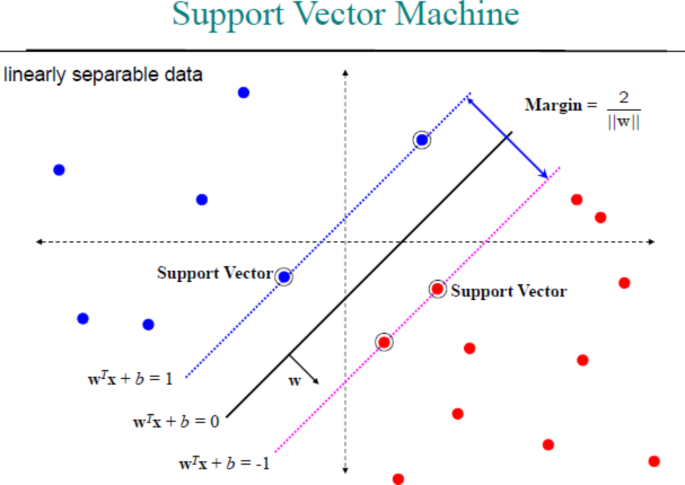
SVM
-
K-Nearest Neighbors Classification.
The K-Nearest Neighbor algorithm (K-NN) is a method for classifying data by determining the likelihood of a data point belonging to a particular group based on the groups of the nearest neighboring data points.
The k-NN algorithm, introduced by Thomas Cover, is a non-parametric approach utilized for both classification and regression tasks. Both situations involves using the k nearest training samples in the feature space as input. The outcome varies depending on whether k-NN is used for classification or regression 45. The k-NN algorithm can be considered as a specific instance of a variable-bandwidth, kernel density balloon estimator that utilizes a uniform kernel. The k-NN model is a classification model that can modify the distance metric and the number of nearest neighbors used. The model has the capability to calculate resubstitution predictions by utilizing the training data it maintains. The model uses the predict approach to categorize novel observations. Classes are classified on the basis of the nearest neighbors’ distance using the Euclidean distance (Eq. 5) in K-NN classification.
$$\:Dist.=\sqrt{{(La{t}_{1}-La{t}_{2})}^{2}+{({Long}_{1}-{Long}_{2})}^{2}}$$(5) -
Naïve Bayes Classification.
The Naïve Bayes classifier is an algorithm that employs Bayes’ theorem to categorize things. Naïve Bayes classifiers operate under the assumption of high independence between attributes of data items. The calculation of NB classification is based on the probability value assigned to each class for the provided variable 46. Naïve Bayes classifiers are commonly employed in spam filters, text analysis, and medical diagnosis.
$$\:p\left(H|E\right)=\frac{p\left(H\right)\times\:p\left(E\right|H)}{p\left(E\right)}$$(6)\(\:p\left(H|E\right)\) = hypothesis probability value for evidence, p (H) = hypothesis probability value, p (E | H) = probability evidence value for the hypothesis, and p (E) = probability value of evidence.
-
Decision Tree.
DT learning is a predictive modeling technique employed in the fields of statistics, data mining, and machine learning. It use decision trees to derive judgments about the goal value of an item based on observations. Classification trees are tree models that are used when the target variable can only have a limited number of distinct values. Within these tree structures, the leaves symbolize the class labels, while the branches symbolize the combinations of features that result in those class labels. Regression trees are used in decision trees when the target variable can take continuous values. Decision trees (DT) is highly favored in the field of machine learning due to their comprehensibility and straightforwardness 47. In order to forecast a reaction, one must trace the decisions made in the tree starting from the root node and progressing towards a leaf node. The leaf node stores the output or answer. Classification trees yield categorical outcomes, such as ‘true’ or ‘false’. Regression trees provide a numerical response.


Hybrid technique for feature extraction and machine learning for classification
In this study, we utilized the power of VGG19, MobileNet_v2 and ResNet-18 by combining their features for skin classification. This approach involves concatenating several pre-trained models to extract and merge valuable features. These combined features are then input into an SVM, DT, Naïve bayes and knn classifier, which generates the final classification output. Essentially, the extracted features from the pre-trained networks are merged and fed into the various classifier, which predicts the classes of the input dermoscopy image. The analysis of the model is conducted on the preprocessed and segmented image of the ISIC 2018 dataset. Three-hybrid models have been constructed by utilizing pretrained networks, specifically (1) MobileNetV2 and VGG19 (2) ResNet-18 and MobileNet-v2, and (3) VGG19 and ResNet-18. The models undergo analysis by employing several optimizers (such as RMSProp, sgdm, and adam) with varied epochs and batch sizes. The performance measurements utilized include accuracy, precision, sensitivity, specificity, and F1-score.
Fine-tuned pretrained network for classification
In this study, pre-trained convolutional neural network (CNN) models are utilized for transfer learning that is specifically designed for one task but can transfer information to new domains. These pre-trained models are used for making predictions, extracting features, and fine-tuning29. We employed widely recognized pre-trained models, namely ResNet18, VGG19, and MobileNet_v2, as classifier in order to evaluate the performance of transfer learning in comparison to our proposed model. The main concept is to utilize these pre-trained models with their final classification layer for enabling the categorization of skin disease images into two classes.
Results and discussion
Performance parameters
One of the key quality parameters evaluated in the proposed hybrid technique is the confusion matrix48. The information is displayed in a Table 4 illustrating the correlation between the predicted and actual classes generated by the suggested method. Table 4 displays the confusion matrix showing the link between the malignant and benign classes.
Skin cancer classification methods are assessed based on accuracy, sensitivity, specificity, precision, and F1-score. The measures are listed in Table 5. The values are determined by computing true positive (TP), false positive (FP), false negative (FN), and true negative (TN) as indicated in Table 4.
Hyper parameters
The hyperparameters that were utilized to retrain the predefined models are listed in Table 6. For the ResNet-18 and MobileNet V2 networks, the sgdm solver type and for VGG19 network RSMProp solve type is used. The initial learning rate is set to 0.0001 for all type of networks. The training and testing sets are divided into multiple batches using batch training. Every batch has 64 images in it. The maximum epoch is set to 25. L2 regularization is also adopted to minimize the overfitting the model and it is set to 0.01. cross-entropy loss function was trained for 25 epochs.
Experimental results
Impact of pre-trained models as feature extractor
The performance of the system is examined by analyzing different pre-trained models (VGG19, ResNet-18, and MobileNetv2) as a feature extractor and various well know machine learning models (DT, SVM, Naïve bayes, and knn) as classifier. From the segmented image, which is produced by applying snake model, features are extracted by using pre-trained models. These features are then given to the different classifier from which the final classified output is obtained. Finally, the classifier output predicts the classes to which the input dermoscopy image belongs.
All of the Machine Learning models and pre-trained CNN were trained and tested on a Windows 11 computer with an Intel i5 processor and 16 GB RAM. The models were implemented on MATLAB 2022. The model is analyzed using ISIC 2018 dataset. 80% images are used for training, and the rest 20% are used for testing. Confusion matrices are obtained to analyze the performance of the network. These models are analyzed by varying different optimizers (such as RMSProp, sgdm, and adam ) for various epochs and batch sizes. Performance metrics used are accuracy, precision, sensitivity, specificity, and F1-score.
A detailed comparison of pre-trained networks using classifiers are shown in Table 6. From the Table 7 we can observe that SVM has provide the highest accuracy among other classifier on the features obtained by all the pre-trained models. The classification accuracy of SVM on Resnet-18, vgg19 and MobileNet is 85.45%, 80.75%, 92.57% respectively. The highest accuracy was obtained by MobileNet network with SVM classifier for 25 epochs having learning rate 0.0001 and batch size 64. Figure 11 shows the accuracy graph for all three pre trained networks using different ML classifier.

Accuracy Graph for three transfer learning models with different ML Classifiers
Impact of hybrid models as feature extractor
In this experiment, the strength of multiple pre-trained networks is utilized and examined by combining the features of different pre-trained models. In this experiment, multiple pre-trained models are concatenated, and valuable features are extracted, combined, and given to the same classifiers from which the final classified output is obtained.
The same dataset, configuration and hyperparameter values are utilized in this experiment. Performance metrics for the different hybrid models are shown in Table 8. From the Table 8 we can observe that the highest accuracy (92.87%) obtained by hybrid model which is the concatenation of MobileNet_v2 and ResNet-18 network with SVM classifier for 25 epochs having learning rate 0.0001 and batch size 64. Figure 12 shows the confusion matrices for Hybrid model (concatenation of MobileNet_v2 and ResNet-18 network) with SVM classifier. Figure 13 shows the training performance plot of the hybrid model. From the figure, we can observe that after 20 epochs, both accuracy and loss become approximately stable. Figure 14 shows the accuracy graph for hybrid model using different ML classifier.

Confusion matrix of hybrid model (MobileNet V2 + ResNet-18 with SVM Classifier)

Training performance plot of hybrid model (MobileNet V2 + ResNet-18)

Accuracy graph for various hybrid models with different ML classifiers
Impact of fine-tuned pre-trained models as classifier
In this section, we conduct a comparative analysis of straightforward use of other fine-tuned CNN architectures on the same dataset. This study involves a comparison between same three widely recognized CNN models, specifically VGG19, ResNet18, and MobileNet_v2. Table 9 presents the mean accuracy, mean sensitivity, mean specificity, mean precision and mean time achieved by all the aforementioned methods/models on 10 different trials. The comparative analysis of the existing methods/models as demonstrated in Fig. 15.

Comparative Graph for three fine-tuned deep learning models
The analysis of various methods revealed that the highest accuracy of 92.87% was achieved by combining ResNet-18 and MobileNet pre-trained networks as feature extractor and an SVM as classifier at the output layer. The improved performance of the hybrid models may be attributed to the utilization of the output from the last ReLU layer of the CNN as input characteristics for the SVM classifier. The SVM classifier transforms the input information into a higher-dimensional space, potentially leading to enhanced classification accuracy.
Ablation study: analyzing the contribution of each component
In this section, we present an ablation study to investigate the contribution of each individual component—preprocessing, segmentation, and feature extraction—to the overall performance of our proposed pipeline. By systematically removing or altering these components, we aim to quantify their individual impact on the model’s effectiveness and provide insights into which part of the pipeline is most crucial for achieving high performance. to evaluate the effect of each component, we perform a series of experiments in which we remove the component entirely from the pipeline. We then measure the performance degradation (or improvement) in terms of the performance metrics such as accuracy and F-score to understand the relative importance of each part of the pipeline. We have tested the ablation study using a combination of ResNet-18 and MobileNetV2 as feature extractor and SVM as classifier. In absence of feature extractor, we have used these two pre-trained models as a classifier and fine-tune them on our dataset and analyze and present the results in a comparative manner. Table 10 shows the comparative result for contribution of each component to overall performance of our proposed pipeline. From the table, we conclude that each component—preprocessing, segmentation, and feature extraction—plays an essential role in the overall performance of the pipeline. However, the segmentation appears to be the most critical factor, as its removal resulted in the largest decrease in performance. These findings provide valuable insights into which steps should be prioritized in future iterations of the model or when optimizing the pipeline for specific tasks.
Conclusion
This research examines skin cancer images and proposes solutions using deep learning approaches to address challenges in categorizing the images. This research examines three strategies for categorizing skin cancer photos.1) Employing three-tuned pre-trained networks as classifiers. 2) Utilizing multiple pre-trained networks as feature extractors with different optimizers. 3) Utilizing a combination of multiple pre-trained networks as feature extractors with various optimizers. All algorithms are trained using segmented images from the ISIC 2018 dataset. The segmented images are created by using the active contour approach on a pre-processed image from the ISIC 2018 dataset. All approaches are trained using different parameters like epoch, batch size, and learning rate. The best accuracy of 92.87% was achieved by combining ResNet-18 and MobileNet pre-trained networks by concatenation and using an SVM classifier. In future, more detailed hyperparameter tuning (e.g., epochs, batch sizes, and learning rates) using techniques like grid search or Bayesian optimization for better accuracy can be done. Preprocessing processes can be integrated into the input pipeline prior to being fed into the networks. This approach can be enhanced to classify a larger number of classes. further studies could also improve model performance with limited data by using more fine-tuning techniques. Further studies could also expend to multi-class classification on real time data (e.g., clinical images or patient metadata) to improve diagnostic capabilities.
Data availability
dataset is freely available online at ISIC Challenge (isic-archive.com).
References
Filimon, D. & Albu, A. Skin disease diagnosis using artificial neural networks, 2014 IEEE 9th IEEE International Symposium on Applied Computational Intelligence and Informatics (SACI), Timisoara, pp. 189–194 (2014). https://doi.org/10.1109/SACI.2014.6840059
Alenezi, N. A method of skin disease detection using image processing and machine learning. Procedia Comput. Sci. 163, 85–92. https://doi.org/10.1016/j.procs.2019.12.090 (2019).
Binder, M. et al. Epiluminescence microscopy. A useful tool for the diagnosis of pigmented skin lesions for formally trained dermatologists. Arch. Dermatol. 131, 286–291 (1995).
Dildar, M. et al. Skin Cancer detection: a review using deep learning techniques. Int. J. Environ. Res. Public. Health. 18 (10), 5479. https://doi.org/10.3390/ijerph18105479 (2021).
Vipin, V. et al. Detection of melanoma using deep learning techniques: a review. 2021 International Conference on Communication, Control and Information Sciences (ICCISc), IEEE, (2021). https://doi.org/10.1109/iccisc52257.2021.9484861
Begum, S. & Asra, S. Extraction of skin lesions from non dermoscopic images using deep learning. Int. J. Sci. Res. Comput. Sci. 2, 591–596 (2017).
Zheng, L., Wang, Z., Liang, J., Luo, S. & Tian, S. Effective compression and classification of ecg arrhythmia by singular value decomposition. Biomed. Eng. Adv. 2, 100013. https://doi.org/10.1016/j.bea.2021.100013 (2021).
Roy, T. S., Roy, J. K. & Mandal, N. Classifier identification using deep learning and machine learning algorithms for the detection of valvular heart diseases. Biomed. Eng. Adv. 3, 100035. https://doi.org/10.1016/j.bea.2022.100035 (2022).
Vasilakos, C., Kavroudakis, D. & Georganta, A. Machine learning classification ensemble of multitemporal sentinel-2 images: the case of a mixed mediterranean ecosystem, Remote Sens. 12(12), 2005 (2020).
Hosny, K. M., Kassem, M. A. & Foaud, M. M. 9th Cairo international biomedical engineering conference CIBEC, pp. 90–93 (2018).
Hameed, N., Shabut, A. M. & Hossain, M. A. Multi-Class Skin Diseases Classification Using Deep Convolutional Neural Network and Support Vector Machine, 2018 12th International Conference on Software, Knowledge, Information Management & Applications (SKIMA),2018, pp. 1–7. https://doi.org/10.1109/SKIMA.2018.86315
Albahar, M. A. Skin lesion classification using convolutional neural network with novel regularizer. IEEE Access. 7, 38306–38313 (2019).
Malliga, S., Infanta, G., Sindoora, S., Yogarasi, S. & & & Skin disease detection and classification using deep learning algorithms. Int. J. Adv. Sci. Technol. 29, 255–260 (2020).
Maron, R. C. et al. Systematic outperformance of 112 dermatologists in multiclass skin cancer image classification by convolutional neural networks. Eur. J. Cancer. 119, 57–65 (2019).
Zhao, C. et al. Dermoscopy image classification based on StyleGAN and DenseNet201. IEEE Access. 9, 8659–8679. https://doi.org/10.1109/ACCESS.2021.3049600 (2021).
Mendes, D. B. & da Silva, N. C. Skin Lesions Classification Using Convolutional Neural Networks in Clinical Images. Available online: (2018). http://arxiv.org/abs/1812.02316. Accessed on 25 Jan 2021.
Le, D. N. T., Le, H. X., Ngo, L. T. & Ngo, H. T. Transfer learning with class-weighted and focal loss function for automatic skin cancer classification (2020). 10.48550/ARXIV.2009.05977
Kawahara, J., Daneshvar, S., Argenziano, G. & Hamarneh, G. Seven-point checklist and skin lesion classification using multitask multimodal neural nets. IEEE J. Biomed. Health Inf. 23 (2), 538–546 (2019).
Akkoca Gaziolu, B. S. & Kamaak, M. E. Effects of objects and image quality on melanoma classification using deep neural networks. Biomed. Signal. Process. Control. 67, 102530. https://doi.org/10.1016/j.bspc.2021.102530 (2021).
Codella, N. et al. Deep learning, sparse coding, and svm for melanoma recognition in dermoscopy images. In International Workshop on Machine Learning in Medical Imaging; Springer: Cham, Switzerland, pp. 118–126. (2015).
Codella, N. et al. Deep learning ensembles for melanoma recognition in dermoscopy images. IBM J. Res. Dev. 61. (2016).
Mahbod, A., Schaefer, G., Wang, C., Ecker, R. & Ellinge, I. Skin Lesion Classification Using Hybrid Deep Neural Networks. In Proceedings of the ICASSP 2019–2019 IEEE International Conference on Acoustics, Speech and Signal Processing (ICASSP), Brighton, UK, 12–17 May; pp. 1229–1233 (2019).
Pennisi, A. et al. Skin lesion image segmentation using delaunay triangulation for melanoma detection. Comput. Med. Imaging Graph. 52, 89–103 (2016).
Yu, L., Chen, H., Dou, Q., Qin, J. & Heng, P. A. Automated melanoma recognition in dermoscopy images via very deep residual networks. IEEE Trans. Med. Imaging. 36, 994–1004 (2017).
Ma, Z. & Tavares, J. A novel approach to segment skin lesions in dermoscopic images based on a deformable model. IEEE J. Biomed. Health Inf. 20, 615–623 (2017).
Thomas, S. M., Lefevre, J. G., Baxter, G. & Hamilton, N. A. Interpretable deep learning systems for multi-class segmentation and classification of non-melanoma skin cancer. Med. Image Anal. 68, 101915. https://doi.org/10.1016/j.media.2020.101915 (2021).
Noel Codella, V. et al. Harald Kittler, Allan Halpern: skin lesion analysis toward Melanoma Detection 2018: a challenge hosted by the International skin imaging collaboration (ISIC) (2018). https://arxiv.org/abs/1902.03368
Rajput, G., Agrawal, S., Raut, G. & Vishvakarma, S. K. An accurate and noninvasive skin cancer screening based on imaging technique. Int. J. Imaging Syst. Technol. 32, 354–368 (2022).
Zuiderveld, K. Contrast limited adaptive histogram equalization. Graph Gems. 4, 474–485 (1994).
Hesamian, M. H. et al. Deep learning techniques for Medical Image Segmentation: achievements and challenges. J. Digit. Imaging. 32, 582–596. https://doi.org/10.1007/s10278-019-00227-x (2019).
Kass, M., Witkin, A., Terzopoulos, D. & Snakes Active contour models. Int. J. Comput. Vis.. 1, 321–331. https://doi.org/10.1007/BF00133570 (1988).
Chan, T. F. & Vese, L. A. Active contours without edges. IEEE Trans. Image Process. 10, 266–277. https://doi.org/10.1109/83.902291 (2001).
Saha, R. & Bhowmik, M. K. Active contour models for medical applications. In: (eds Mandal, J. K., Mukhopadhyay, S. & Pal, T.) Handbook of Research on Natural Computing for Optimization Problems. 2nd ed. Dauphin County: IGI Global; 937–959. https://doi.org/10.4018/978-1-5225-0058-2.ch038 (2016).
Pathak, Y., Shukla, P., Tiwari, A., Stalin, S. & Singh, S. Deep Transfer Learning Based Classification Model for COVID-19 Disease, Irbm (2020).
Chouhan, V. et al. A novel transfer learning based approach for pneumonia detection in chest xray images, Appl. Sci., 10(2), 559 (2020).
ImageNet. http://www.image-net.org
Ali, H., Kabir, S. & Ullah, G. Indoor scene recognition using ResNet-18. Int. J. Res. Publ.. 69 (1), 7 (2021).
Sarwinda, D., Paradisa, R., Bustamam, A. & Anggia, P. Deep learning in image classification using residual network (ResNet) variants for detection of colorectal cancer. Procedia Comput. Sci. 179, 423–431 (2021).
Foahom Gouabou, A. C. et al. Ensemble method of convolutional neural networks with directed acyclic graph using dermoscopic images: melanoma detection application. Sensors 21, 3999 (2021).
Canziani, A. et al. An analysis of deep neural network models for practical applications. ArXiv Abs. http://arxiv.org/abs/1605.07678 (2016).
Sandler, M., Howard, A., Zhu, M., Zhmoginov, A. & Chen, L. C. MobileNetV2: Inverted Residuals and Linear Bottlenecks. In 2018 IEEE/CVF Conference on Computer Vision and Pattern Recognition (pp. 4510–4520).
Sae-lim, W., Wettayaprasit, W. & Aiyarak, P. Convolutional neural networks using MobileNet for skin lesion classification. In Proceedings of the 16th International Joint Conference on Computer Science and Software Engineering, Chonburi, Thailand, 10–12 July 2019; pp. 242–247.
Bi, C., Wang, J. & Duan, Y. MobileNet Based Apple Leaf diseases Identification. Mob. Netw. Appl. 1–9 (2020).
Cortes, C. & Vapnik, V. Support-vector networks. Mach. Learn. 20, 273–297 (1995).
Trivedi, V. K., Shukla, P. K. & Dutta, P. K. K-mean and HSV model-based segmentation of unhealthy plant leaves and classification using machine learning approach, 3rd Smart Cities Symposium (SCS 2020), Online Conference, pp. 264–270 (2020). https://doi.org/10.1049/icp.2021.0953
Wijaya, E. Implementation analysis of GLCM and naive Bayes methods in conducting extractions on Dental Image. IOP Conf. Ser. Mater. Sci. Eng., 407, 1, (2018).
Wu, X. et al. Top 10 algorithms in data mining. Knowl. Inf. Syst. 14, 1–37 (2007).
Kawahara, J. & Hamarneh, G. Fully convolutional networks to detect clinical dermoscopic features. arXiv arXiv:1703 (2017).
Acknowledgements
We would like to thank every member of the ISIC Dataset team for providing valuable data used in this study.
Funding
No funds, grants, or other support was received.
Author information
Authors and Affiliations
Contributions
All authors contributed to the study conception and design. Material preparation, data collection and analysis were performed by Manishi Shakya, Ravindra Patel and Sunil Joshi. The first draft of the manuscript was written by Manishi Shakya and all other authors commented on the manuscript. All authors read and approved the final manuscript.
Corresponding author
Ethics declarations
Competing interests
The authors declare no competing interests.
Ethical and informed consent for data used
The submitted work is original and have not been published elsewhere in any form or language. Data is collected from standard, open-access International Skin Imaging Collaboration (ISIC)2018 dataset.
Additional information
Publisher’s note
Springer Nature remains neutral with regard to jurisdictional claims in published maps and institutional affiliations.
Rights and permissions
Open Access This article is licensed under a Creative Commons Attribution-NonCommercial-NoDerivatives 4.0 International License, which permits any non-commercial use, sharing, distribution and reproduction in any medium or format, as long as you give appropriate credit to the original author(s) and the source, provide a link to the Creative Commons licence, and indicate if you modified the licensed material. You do not have permission under this licence to share adapted material derived from this article or parts of it. The images or other third party material in this article are included in the article’s Creative Commons licence, unless indicated otherwise in a credit line to the material. If material is not included in the article’s Creative Commons licence and your intended use is not permitted by statutory regulation or exceeds the permitted use, you will need to obtain permission directly from the copyright holder. To view a copy of this licence, visit http://creativecommons.org/licenses/by-nc-nd/4.0/.
About this article

Cite this article
Shakya, M., Patel, R. & Joshi, S. A comprehensive analysis of deep learning and transfer learning techniques for skin cancer classification. Sci Rep 15, 4633 (2025). https://doi.org/10.1038/s41598-024-82241-w
Received:
Accepted:
Published:
Version of record:
DOI: https://doi.org/10.1038/s41598-024-82241-w
Keywords
This article is cited by
-
An optimal graph convolutional vision neural network with explainable feature optimization for improved skin cancer detection
BMC Medical Imaging (2025)
-
Semi-supervised GAN with hybrid regularization and evolutionary hyperparameter tuning for accurate melanoma detection
Scientific Reports (2025)
-
Deep dictionary learning with reconstruction for texture recognition
Scientific Reports (2025)
