
Abstract
Climate change poses a significant threat to agricultural sustainability, particularly in vulnerable mountainous regions such as Upper Dir, Pakistan. This study, titled "Analysis of Variation in Climatic Parameters and Their Impact on Sustainable Agriculture in Dir, Pakistan: Mitigation and Adaptation Strategies," aims to assess past climatic trends (2002–2023) and project future scenarios using the high-emission Representative Concentration Pathway (RCP 8.5) model. The core objective is to evaluate the quantitative variation in key agro-climatic factors—temperature, rainfall, humidity, wind speed, and aridity and their cumulative impact on crop productivity, soil moisture, and water availability. Meteorological data were collected from the Pakistan Meteorological Department and analyzed using Mann–Kendall trend analysis, return period analysis, and regression forecasting to determine both historical patterns and future trajectories. The results show a 2 °C rise in annual mean temperature from 1980 to 2023, accompanied by a 2% decline in rainfall and a 6% reduction in soil moisture, contributing to increasing aridity and hydrological stress. Wind speed exhibited minor seasonal fluctuations, while humidity increased, particularly during monsoon periods. Future climate projections under the high-emission RCP 8.5 scenario indicate an alarming and continuous rise in temperature throughout the twenty-first century. During the period from 2011 to 2040, the region is expected to experience moderate warming, with temperatures increasing by approximately 1.5 °C to 3.5 °C, and a median rise of around 2.5 °C. In the subsequent period of 2041 to 2070, this warming trend is projected to accelerate significantly, with temperature increases ranging from 4 to 7 °C, and a median rise of 5.5 °C. By the end of the century, from 2071 to 2100, the region could face extreme warming, with temperatures rising between 5 and 12 °C, and a projected median increase of 8.5 °C. These drastic increases are expected to intensify evapotranspiration, reduce soil moisture, disrupt crop cycles, and severely impact agricultural productivity and water availability in Upper Dir, Pakistan. To mitigate these effects, Author introduced climate-resilient species such as Tamarillo (tomato), Olive, Avocado, and Dragon Fruit, and distributed over 30,000 Tamarillo plants and other fruits plants across the region. Additionally, adaptive strategies including tunnel farming, agroforestry, construction of small dams, and efficient irrigation systems were promoted to enhance resilience. The findings emphasize the urgent need for policy-driven climate-smart agriculture, afforestation, and integrated water management strategies to sustain agricultural productivity and rural economies in the face of escalating climate risks.
Introduction
The research study was conducted in the northern areas of Khyber Pakhtunkhwa, including Dir Upper. These areas are known for their diverse agricultural practices, largely influenced by climatic conditions, land cover, and soil properties. Over the past two decades, rapid climatic changes have significantly impacted agriculture in these regions. This study aims to assess the variation in climatic parameters from the past 20 years and predict their potential impact on agriculture and other land-related factors in the future.
Furthermore, the primary focus of this research was to determine the impacts of climate change on agricultural practices, land cover, land use, and soil properties in the study area. The study employed various statistical techniques, such as Mann–Kendall analysis, trend analysis, and return period analysis, to assess the variability and trends in climatic parameters. These methods provided a comprehensive understanding of how climate change has occurred over the past 20 years and what might be expected in the future.
However, temperature and precipitation are the most influential climatic factors affecting agriculture in the northern regions of Khyber Pakhtunkhwa. Temperature variation, especially sudden temperature fluctuations, has been observed to affect crop growth significantly. Wheat, one of the major crops in these areas, is highly sensitive to changes in temperature and moisture levels. The increased frequency of heatwaves, along with reduced soil moisture due to irregular rainfall patterns, has shown a negative impact on wheat crop yield. As temperature rises, the water-holding capacity of the soil decreases, leading to poor crop growth and lower yields. This is particularly true in the winter and early spring months when wheat is in its critical growth phase.
Furthermore, the research also determined the changes in soil parameters during a lab experiment. Soil moisture levels, temperature, and other vital soil characteristics such as texture, pH, and organic matter content were monitored under various temperature conditions. These changes were correlated with crop performance, especially wheat, to understand how fluctuations in climatic parameters influence the productivity of the land.
Additionally, the GIS (Geographic Information System) was used to analyze land cover and land use changes in the study area. The changes in land use are primarily driven by population growth, urbanization, and shifting agricultural practices. As the climate changes, the suitability of land for specific crops also changes. For instance, certain areas may experience reduced agricultural suitability for wheat, while other crops might become more viable. The study identified the spatial patterns of land use changes and their correlation with climatic variation, providing valuable insights into how land is being transformed in response to changing environmental conditions.
Furthermore, the interaction between changing climatic parameters and soil properties is a critical aspect of this study. Soil health directly influences agricultural productivity, and climatic changes exacerbate existing soil challenges. As temperatures increase, soil moisture levels are reduced, affecting soilertility and the availability of nutrients for crops. The research examined these relationships and explored how sudden climatic events, such as heatwaves or droughts, impact soil structure and its capacity to support plant growth.
Finally, the conclusion: this study presents a comprehensive assessment of how climatic variations in the northern areas of Khyber Pakhtunkhwa are influencing agriculture, land use, and soil properties. The findings provide essential insights into future trends and offer practical recommendations for adapting agricultural practices to mitigate the impacts of climate change.
Problem statement
Climate change, driven by the rapid growth of the global population and deforestation, is exacerbating greenhouse gas emissions, significantly altering atmospheric conditions. These changes—manifested through rising temperatures, reduced rainfall, and fluctuations in wind speed, humidity, and solar radiation—have profound implications for agriculture worldwide. In Pakistan, the effects of climate change are particularly pronounced in hilly regions, where agriculture serves as a primary livelihood for local communities.
In the northern areas of Khyber Pakhtunkhwa, climate change is disrupting agricultural systems in multiple ways. During March, low temperatures delay wheat crop maturity, with mean temperatures occasionally dropping to zero, leading to poor grain development. In April, water demand for crops intensifies across the country, especially in dry regions, due to high evapotranspiration rates and reduced humidity. However, in northern areas, wheat crop dormancy extends due to prolonged cold conditions, reducing water demand but significantly affecting crop growth cycles. These climatic variations also impact soil structure, texture, and microbial activity, while increasing soil erosion and degrading physical and chemical properties.
The northern districts of Dir Upper, Swat, and Abbottabad are among the most vulnerable to these changes. Shifts in climatic parameters, such as temperature and rainfall, are further compounded by land cover and land use changes driven by deforestation, urbanization, and agricultural expansion. These combined pressures threaten agricultural sustainability and soil stability in the region. To address these challenges, it is essential to analyze the variation in agro-climatic zones and assess the impacts of land cover and land use changes. This research aims to provide a comprehensive understanding of these dynamics, offering insights for the development of sustainable agricultural practices in the northern areas of Pakistan.
The Northern Areas rapid and complex changes in land cover and land use due to increasing population, urbanization, and environmental pressures. These changes pose serious threats to the region’s natural resources, biodiversity, and agricultural sustainability. However, limited data on these transformations restricts effective planning and resource management in these sensitive areas. Accurate assessment and monitoring of land cover and land use are essential for understanding these changes and their implications for sustainable development.
Objective
The primary objectives of this study are:
-
1.
Evaluate long-term past and future trends and patterns in climatic variables from 2001 to 2020 using historical data.
-
2.
Determine the direct and indirect effects of these variations on crop productivity, soil health, and water resources.
-
3.
Propose region-specific mitigation strategies to reduce the adverse impacts of climate change on agriculture.
-
4.
Develop practical adaptation strategies for farmers to enhance agricultural resilience and ensure sustainability in the face of future climatic challenges.
Significance of the study
This research is of immense importance to agriculture and environmental sustainability in the northern regions of Khyber Pakhtunkhwa. The study addresses critical aspects of climate change, land use, and agriculture, which are highly relevant for ensuring sustainable agricultural practices in this vulnerable region. Understanding Climatic Changes and Their Impact: The study investigates changes in key climatic parameters such as temperature, precipitation, and other weather patterns. By analyzing these changes, the research provides a comprehensive understanding of their direct and indirect impacts on agriculture, including crop productivity, soil health, and water availability. Impact of Sudden Temperature Changes: Sudden fluctuations in temperature pose a serious challenge to soil moisture levels and crop yields. Through controlled greenhouse experiments, this research evaluates the effects of abrupt temperature changes on soil properties and wheat crop growth, providing insights into adaptive strategies for maintaining crop productivity under changing climate conditions. Guiding Mitigation and Adaptation Measures: The study also identifies practical mitigation measures and adaptation strategies to address the adverse effects of climate change on agriculture. These measures are essential for safeguarding food security and promoting sustainable farming practices in the region. Policy and Planning Implications: By integrating data-driven findings, the research can support policymakers and agricultural planners in developing region-specific strategies to enhance climate resilience, manage natural resources effectively, and optimize land use for sustainable agriculture.
According to the research, climate change is defined as the long-term changes in the Earth’s climate, particularly shifts in temperature, precipitation patterns, and the frequency of extreme weather events. These changes are largely driven by human activities, particularly the emission of greenhouse gases like carbon dioxide, methane, and nitrous oxide, which trap heat in the atmosphere. As a result, the global climate system is experiencing disruptions that are evident in the rising global temperatures, more frequent and severe heat waves, changing rainfall patterns, melting glaciers, and rising sea levels. These climatic changes have far-reaching impacts on the world, affecting ecosystems, biodiversity, food security, water resources, and human health. For instance, crop yields are being affected by altered growing seasons, and natural disasters such as floods, droughts, and hurricanes are becoming more frequent and intense, leading to devastating consequences for vulnerable communities. Climate change also exacerbates poverty, inequality, and migration as people in affected regions struggle to adapt or move away from areas no longer suitable for living. Consequently, addressing climate change has become one of the most urgent global challenges, requiring coordinated efforts to mitigate its effects and build resilience, especially for the most vulnerable populations1.
Moreover, globally, agricultural yields could decrease by 11%, primarily due to warming, erratic rainfall, and soil degradation. As the population grows, these challenges could jeopardize food security. Investment in resilient farming and technology is essential to avert crisis2. Wheat production has shown resilience despite climate stress, rising from 25.98 to a projected 31.4 million tonnes between 2014 and 2025. This growth is driven by climate-smart varieties and better practices. However, ongoing warming still poses serious yield threats3. The cotton sector has seen yields fall by 40–50% in 2022–2023, especially in Punjab. Temperature extremes and water scarcity have severely hit crop health. Adaptive farming methods are now crucial for future cotton sustainability4. Rice production increased from 8.43 to 10 M tonnes (2019–2025), supported by drought- and flood-tolerant varieties. Yet, areas with worsening floods still face major risks. This underscores the value of continuous innovation in rice farming5.
Additionally, the cotton sector has seen yields fall by 40–50% in 2022–2023, especially in Punjab. Temperature extremes and water scarcity have severely hit crop health. Adaptive farming methods are now crucial for future cotton sustainability6. The climate change due to the increase in temperature caused the forest fires to occur in Dir Upper and other districts of KP. Forest ecosystems in Pakistan, like the chilgoza pine in Balochistan, suffered major damage in the 2022 Sherani wildfire. High temperatures and dryness fueled the blaze, damaging biodiversity and livelihoods. Such incidents highlight forests’ climate vulnerability7. In KP, over 200 forest fires in 2022 burned 14,430 acres, harming biodiversity and livestock resources. These fires, triggered by rising heat and dry spells, reduce carbon sinks. Thus, fire management and conservation must become top priorities8.
However, due to increased rainfall in Pakistan, especially in Upper Dir, the region frequently experiences devastating floods. The 2010 floods displaced 20 million people and caused $10 billion in damages, submerging agricultural lands and infrastructure9. In 2011, floods caused $2 billion in losses, exposing the fragility of rain-fed systems like those in Dir Upper10. The 2012 floods resulted in $2.6 billion in damages and 571 deaths, further disrupting agriculture and food security11. Similarly, the 2014 floods led to over $1 billion in damages and 367 deaths, affecting key agricultural zones in Punjab, KP, and Sindh12. These recurring events underscore the urgent need for localized adaptation strategies and improved disaster preparedness to protect sustainable agriculture in vulnerable regions like Dir Upper.
Furthermore, sustainable agriculture in Pakistan, particularly in the mountainous region of Dir Upper, is facing increasing challenges due to the continuous variation in climatic parameters such as temperature, rainfall, and seasonal shifts. These changes have disrupted traditional farming practices, reduced crop productivity, and increased soil degradation in the area. In Dir Upper, where agriculture is a primary livelihood source, erratic weather patterns and shifting growing seasons have made farmers vulnerable to food insecurity and economic instability. Adoption of sustainable practices such as integrated pest management, crop rotation, organic fertilizers, and conservation tillage has become essential to preserve soil health and improve water use efficiency. Moreover, community-based awareness and training programs can enhance local farmers’ capacity to adapt to climate-induced changes13.
However, effective mitigation strategies are essential to combat the adverse effects of climate change on agriculture in Dir Upper and across Pakistan. These include promoting agroforestry, reforestation, and low-carbon farming techniques that reduce greenhouse gas emissions while enhancing soil carbon sequestration. The use of renewable energy sources for irrigation and farming operations, such as solar-powered water pumps, also contributes to climate resilience. Government policies should prioritize climate-smart agriculture and strengthen institutional support for climate risk management. According to Khan et al., adaptation and mitigation measures tailored to local ecological conditions in Dir Upper can significantly improve the resilience of farming systems and promote long-term agricultural sustainability13.
Additionally, the agro-climatic zones are regions classified by climate suitability for specific crops. Arid zones (rainfall < 250 mm) face extreme drought and need drought-resistant farming. Semi-arid zones (250–500 mm) require water-saving techniques. Sub-humid (500–1000 mm) and humid zones (> 1000 mm) support diverse crops but face challenges like erosion and flooding14.
Furthermore, Arid zones (Aridity Index < 0.2) receive less than 250 mm rainfall annually and have < 40% humidity, limiting agriculture to drought-resistant crops and advanced irrigation15. Semi-arid zones (0.2–0.5 AI) get 250–500 mm rain, supporting crops like wheat and maize, but still need supplemental irrigation15. Sub-humid zones (0.5–0.75 AI) with 500–1000 mm rain support diverse crops and agroforestry; regions include Upper Dir and Swat16. Humid zones (> 0.75 AI, > 60% RH) receive over 1000 mm rainfall, enabling intensive agriculture but facing waterlogging and leaching risks17. GIS and remote sensing help map these zones, showing climate change’s threat to sustainable farming18. Regional planning is key to adaptive strategies for sustainable agriculture.
Additionally, agriculture contributes over 20% to Pakistan’s GDP, yet climate change via rising temperatures and erratic monsoons threatens crop productivity, especially in mountainous regions19. Khyber Pakhtunkhwa (KP) is facing declining crop yields and land degradation due to rising temperatures and shifting rainfall patterns, impacting sustainable agriculture20. The districts of Dir Upper, Swat, Abbottabad, and Mansehra face severe agro-climatic disruptions from deforestation and urbanization, reducing soil fertility and water availability21.
However, the agro-climatic zones, classified by rainfall and temperature, are vital for crop planning. However, Pakistan ranks among the top 10 countries most vulnerable to climate change impacts on food production14. In Pakistan, diverse climates and water dependence on snow-fed rivers make agriculture vulnerable. Cold weather shortens the growing season, affecting wheat and other winter crops22. Global climate change disrupts rainfall and temperature, threatening food security and livelihoods, especially in developing, agriculture-dependent countries23,24. With 19% of GDP and half the population reliant on agriculture, Pakistan’s varied climate, especially in the north, is increasingly affecting crop yields and food security25,26.
Finally, in Dir Upper, rising temperatures and changing rainfall over the last two decades have reduced the yield of key crops like wheat and maize, undermining sustainable agriculture27.
Literature reviews
Causes of climate change
One of the primary drivers of global climate change is the increased concentration of greenhouse gases in the atmosphere, notably carbon dioxide. According to Pierre (1997), elevated levels of heat-trapping gases enhance the greenhouse effect, contributing to a global temperature rise ranging from 1 to 3.5 °C. Moreover, warmer air can retain more moisture, potentially resulting in a 10% to 15% increase in global precipitation. These projections are based on simulations conducted using Global Circulation Models (GCMs), which further indicate that climate variability may significantly reduce agricultural productivity both in the United States and worldwide28.
Smith et al.29 conducted a comprehensive study to examine the impact of abrupt temperature fluctuations on soil properties and plant development. Their findings revealed that such temperature shifts severely disrupt soil structure and reduce its water holding capacity, ultimately impeding root growth and lowering overall crop biomass. These observations emphasize the importance of maintaining stable soil conditions to ensure sustainable agricultural output in the face of climate change29.
The Intergovernmental Panel on Climate Change (IPCC) offers a broad assessment of climate change and its far-reaching consequences. In its Fourth Assessment Report (AR4), the IPCC (2014) attributes the current pace of global warming to anthropogenic factors, including fossil fuel combustion, deforestation, and intensive livestock activities. The report warns that if such trends persist, the Earth’s temperature could increase by 1.1 °C to 5.5 °C by the end of the century. This warming is expected to severely impact agriculture by altering crop suitability, reducing yields, and increasing the vulnerability of land systems. It also outlines possible adaptation and mitigation strategies to assist farmers and landowners in making long-term decisions23.
Additionally, Parry and Carter30 argue that climate change presents complex risks to food security and agricultural sustainability. Their work underscores the need for robust assessment models and integrated policy frameworks to evaluate and address these impacts. They emphasize that regional variations in climate sensitivity and adaptive capacity must be considered to formulate effective adaptation strategies30.
Recent research by Abid et al.31 examined the effectiveness of climate-smart agriculture (CSA) strategies across diverse agro-ecological zones in rural Pakistan. Drawing on survey data from 540 farm households, the study evaluated practices such as adjusted cropping calendars, seed diversification, resource-efficient input management, and soil and water conservation techniques. Despite the overall low adoption rate of CSA practices—often below 30%—the findings revealed that households adopting these practices experienced improved agricultural productivity, increased farm income, and reduced income risk. Using a multinomial endogenous switching regression model to address selection bias, the study concluded that CSA enhances resilience to climate variability and supports long-term sustainability in Pakistan’s rural agricultural systems. These findings offer important insights for regions like Dir Upper, where smallholder farmers face increasing climate-induced stress and could benefit from targeted adaptation strategies to ensure sustainable crop production and economic stability under changing climatic conditions31.
The economic implications of climate change in Khyber Pakhtunkhwa are also profound. Khan et al. documented that erratic rainfall patterns and the increasing frequency of floods and droughts have disrupted the agricultural calendar, leading to substantial economic losses for smallholder farmers. These events have destabilized both crop productivity and local market systems, contributing to increased vulnerability and reduced resilience among farming communities in mountainous areas such as Dir Upper32.
Pakistan’s heavy dependence on agriculture—employing nearly 25 million people—makes the sector highly vulnerable to climatic disruptions. Awan and Yaseen emphasized that the country’s annual population growth rate of about 2% further strains agricultural resources and increases pressure on food systems. This population pressure, combined with climate variability, challenges long-term agricultural sustainability, especially in marginal areas like Dir Upper that already face infrastructural and institutional limitations33.
Temperature variability has further reduced the length of growing seasons for key crops such as wheat and maize. Rasul et al. observed that rising temperatures have accelerated crop cycles in Pakistan, particularly in areas prone to heatwaves, like Khyber Pakhtunkhwa. This rapid maturation limits optimal grain filling and reduces both the quantity and quality of yields. Such trends are particularly relevant to Dir Upper, where agriculture relies heavily on temperature-sensitive crops and limited irrigation facilities34.
Climate change effects on agricultural
The agricultural sector is both a contributor to and a victim of climate change. Ali et al. emphasize that agriculture accounts for an estimated 17% to 32% of total greenhouse gas (GHG) emissions globally. Key emission sources include nitrous oxide from land use, methane from livestock and rice fields, and carbon dioxide from the burning of biomass and fossil fuels used in machinery and fertilizer production. Their study underscores the urgent need for mitigation strategies such as carbon sequestration and the management of nitrogen and methane emissions. Moreover, they compare the role of organic versus inorganic agricultural products in reducing emissions. Their results suggest that organic inputs are more effective for food crops (e.g., wheat, vegetables, fruits), while inorganic inputs are more suited to livestock production (e.g., poultry and meat), offering targeted mitigation options for sustainable agricultural development in climate-sensitive areas like Dir Upper35.
Greenpeace further contextualizes the critical role of agriculture in the global economy and environmental footprint. Their assessment notes that agriculture utilizes 40–50% of the Earth’s land surface, provides employment to 1.3 billion people, and consumes 87% of extracted freshwater resources. However, between 1990 and 2005, GHG emissions from the sector rose by 17%, contributing to declining yields per hectare. The report recommends integrated management strategies, including phasing out fossil-fuel-based fertilizers, adopting organic livestock feeding systems to reduce methane, and investing in agricultural R&D. These strategies are especially relevant for regions like Dir Upper, where limited access to technology and infrastructure makes farmers more vulnerable to climatic shifts36.
In a European context, Smith et al. applied Ricardian analysis to assess the impact of temperature shifts on agricultural land values across German districts. Their findings reveal that projected increases in summer temperatures and intensified winter conditions significantly affect land rental values, with East Germany being an exception. The study suggests localized adaptation strategies such as district-level soil evaluation, optimizing land lease agreements, and facilitating farmer migration to areas with more favorable climatic conditions. Although based in Germany, the methodological approach and adaptation strategies offer transferable insights for climate-sensitive regions like Dir Upper, where land quality and tenant farming are integral to agricultural sustainability37.
Climate change effects on World Agricultural Economy
The World Bank (2022) estimates that if climate change continues at its current trajectory, it could shrink the global agricultural economy by up to 10% of global GDP. This alarming projection underlines the need for robust international cooperation and strategic economic reforms, particularly in climate-vulnerable nations such as Pakistan. To mitigate such economic disruptions, the report suggests adopting flexible land-use policies, expanding subsidies for climate-resilient farming inputs, improving access to agricultural credit, enhancing irrigation efficiency, and investing in training programs for farmers. These strategies are especially relevant for rural areas like Dir Upper, where limited institutional support and changing climatic conditions threaten long-term agricultural sustainability38.
Climate change is also recognized as a key force reshaping globalization, with substantial implications for global food systems. Aurbacher et al., through their Ricardian analysis, noted that climate-induced shifts in comparative agricultural advantages are altering trade dynamics, influencing both export potential and food security across regions. To stabilize agricultural markets and preserve competitiveness, the authors recommend integrated mitigation strategies, such as improved agricultural practices and enhanced environmental stewardship. These insights are applicable to semi-mountainous regions like Dir Upper, where changing climate parameters increasingly influence cropping choices and market participation39.
Tubi et al. further analyzed how climate-induced variations in humidity and water availability intensify agricultural vulnerabilities. Their research, focused on temperature and moisture shifts, demonstrates that reduced water availability during prolonged dry spells significantly affects both the quantity and viability of crop yields. They emphasize that adaptive water management practices, including optimized irrigation scheduling and soil moisture conservation, are crucial to maintaining productivity. These findings directly align with the conditions in Dir Upper, where rainfall variability and increasing temperature trends demand localized water-saving technologies and farmer training in adaptive techniques40.
Mitigation and adaptation strategies
Adapting to climate change has emerged as a critical strategy for mitigating its adverse impacts, particularly in agriculture-dependent regions. The World Bank (2009) proposed a dual adaptation framework comprising Bottom-Up and Top-Down approaches. The Bottom-Up approach emphasizes localized data collection, community engagement, and country-specific adaptation planning, whereas the Top-Down approach focuses on global modeling and economic estimation of adaptation costs. Both methods, when integrated, offer a comprehensive path to cost-effective climate resilience39.
Ecosystem-based adaptation has also been identified as a valuable tool in climate strategies. According to the World Bank (2010), protecting ecosystems such as mangroves, coral reefs, and forests enhances carbon sequestration and provides natural buffers against extreme climatic events (World Bank Climate Data, 2022). In the agricultural sector, several mitigation techniques have been explored to reduce greenhouse gas (GHG) emissions. These include sustainable practices like crop rotation, conservation tillage, and efficient irrigation systems. Furthermore, livestock sector innovations such as selective breeding and improved feed efficiency are also crucial for reducing methane emissions41.
In the context of Asia and the Pacific, adaptive strategies have been prioritized to bolster resilience in climate-vulnerable regions. The Asian Development Bank Institute (2012) emphasized the implementation of flood early warning systems, soil conservation practices, and financial aid programs targeting smallholder farmers as key interventions. These strategies not only reduce vulnerability but also support long-term agricultural sustainability42.
Moreover, Schneider et al. underscored the necessity of strengthening agricultural adaptation at the grassroots level. Their study highlighted the importance of enhancing local technical knowledge, improving climate data collection, and increasing access to financial and institutional support to effectively address the impacts of temperature stress on wheat farming in developing countries43.
Pakistan ranks among the top 20 most climate-vulnerable countries globally, experiencing intensified climate-related challenges such as frequent droughts, catastrophic floods, and declining agricultural productivity. In-depth case studies conducted by the International Union for Conservation of Nature (IUCN) in Bagrote and Shigar Valleys underscore the severe impacts of climate change on water availability, biodiversity, and local livelihoods. Mitigation efforts in these areas have included reforestation initiatives, community education programs, and the implementation of climate-resilient technologies to build adaptive capacity44.
Khan et al. conducted a study focusing on the rain-fed agricultural zones of Dir and Swat, where climate impacts differ markedly from irrigated regions. Their analysis revealed that rising temperatures and erratic rainfall patterns significantly reduced the productivity of wheat and maize—staple crops for the region’s food security. Despite highlighting climatic variations, the study lacked a localized examination of mitigation or adaptation strategies, revealing a critical gap in understanding the socio-economic dimensions of climate resilience in northern Pakistan45.
Similarly, Abbas et al. explored the adoption of drought-resistant crop varieties and water conservation techniques as potential adaptation measures. However, the transferability of these practices to the distinct agro-ecological and socio-cultural settings of Dir and Swat remains inadequately examined. Existing literature often overlooks the specific local dynamics necessary to adapt broad strategies effectively at the community level46.
A regional assessment by Shah et al. identified significant climatic variations in Upper Dir and Swat, including fluctuations in temperature, rainfall, humidity, and wind speed, which have led to widespread agricultural disruptions. The study documented yield declines in wheat and maize due to heat stress and water scarcity, while also noting reduced fruit and vegetable production factors that directly compromise food security and farmer income47.
Moreover, Salma et al. reported that Pakistan ranks 12th among countries most affected by climate change according to the World Bank, with distinct regional rainfall patterns intensifying disaster risks. Northern areas have experienced increasingly severe monsoon events, while western regions face diminishing rainfall. These climatic shifts have contributed to destructive floods, which have damaged agricultural lands, infrastructure, and livelihoods highlighting the urgent need for region-specific climate adaptation frameworks48.
Material and method
This study was conducted in Dir, Pakistan, to analyze variations in climatic parameters and their impact on sustainable agriculture. Climatic data such as temperature, rainfall, and humidity from 2001–2020 were collected from the Pakistan Meteorological Department and global databases. Statistical tools including Mann–Kendall trend analysis and regression analysis were used to identify long-term variations. Mitigation and adaptation strategies were suggested based on findings.
Study area upper dir
The Fig. 1 shows the mape of Upper Dir located in the northern area of Pakistan. The climate is moist and subtropical. The average rainfall is 850 mm per year, while the average temperature is 18 °C. The climate is very severe in winter due to snowfall, while in August and July, due to severe rainfall and land sliding, the climate is very hazardous. The main river flowing through Upper Dir is the Panjkora River. The water flowing through this river is due to the melting of snow from the mountains of Upper Dir. The soil in upper Dir is different. Some areas have clay soil, while others have sandy soil. The mountain areas have more organic matter. The climate is moist and subtropical.. The soil in Upper Dir is different. Some areas have clay soil, while others have sandy soil49 (Table 1).

Source Generated using ArcGIS software based on coordinates from Google Earth and administrative boundaries from the Pakistan Bureau of Statistics (PBS, 2017).
Map of, upper dir, in the Northern Pakistan.
Data collection
Climatic data, including temperature, precipitation, humidity, and extreme weather events, were collected for the period between 2002 and 2023. The data was sourced from the Pakistan Meteorological Department (PMD) and supplemented by global climate datasets from the World Bank Climate Data and the Climatic Research Unit (CRU) at the University of East Anglia. These databases provided comprehensive climate information, which was critical for understanding the trends and impacts of climate change in the study area44.
Data analysis
The data was analyzed by using three types of analysis Trend analysis, Mannkendall analysis and return period analysis.
Trend analysis
Trend analysis is a statistical technique used to identify patterns, directions, or changes in climatic parameters such as temperature, rainfall, relative humidity, and wind speed over a specific period. It helps to understand whether a parameter is increasing, decreasing, or stable, which is critical for climate studies, policy-making, and adaptation strategies.
To analyze trends in climatic data such as temperature, rainfall, relative humidity, and wind speed, data is typically collected from reliable sources like the Pakistan Meteorological Department. For this study, data spanning from 2002 to 2023 is used to ensure a comprehensive analysis of long-term changes. The first step involves organizing the data chronologically for each climatic parameter. Statistical methods such as regression analysis and the Mann–Kendall trend test are then applied to detect trends over time. These methods help identify whether the data shows an increasing or decreasing pattern and the statistical significance of these trends.
Visualization techniques, such as line graphs or scatter plots, are used to illustrate trends for better understanding. Any seasonal variations or abrupt changes, such as extreme weather events, are also identified. For future projections, models like the ARIMA (Auto-Regressive Integrated Moving Average) model or statistical downscaling are applied to predict climatic behavior for the next 10 to 20 years. These predictions are crucial for planning and mitigation strategies in agriculture, water management, and disaster preparedness50.
Return period analysis
The return period is the average time interval between occurrences of a climatic event (e.g., extreme rainfall).Return period analysis is used to estimate the likelihood of extreme climatic events, such as heavy rainfall, high temperatures, or strong winds, occurring within a specific timeframe. For this analysis, data on temperature, rainfall, relative humidity, and wind speed is collected from the Pakistan Meteorological Department for the period 2001–2020. The data is organized yearly to identify extreme values for each climatic parameter. Statistical methods like the Weibull distribution and Gumbel distribution are applied to calculate the return period of events, indicating how often a particular event is likely to reoccur. For instance, a 50-year return period means the event has a 2% probability of happening in any given year.
To project future return periods, advanced statistical models and climate prediction tools are used. These models incorporate historical trends and projected climatic changes to estimate the frequency and intensity of extreme events under different climate scenarios. This information is critical for planning and designing infrastructure, improving disaster preparedness, and implementing sustainable development practices51.
Mann–Kendall analysis
The climatic analysis for Mann–kendall analysis involves studying data on temperature, rainfall, relative humidity, and wind speed to understand long-term trends and variations. For this analysis, data from the Pakistan Meteorological Department covering the years 2001 to 2020 is used. The first step is to organize the data chronologically and calculate annual averages and extremes for each parameter. Statistical methods, such as regression analysis and Mann–Kendall tests, are applied to identify trends and seasonal patterns. Visualization techniques, like line charts and scatter plots, help illustrate changes over time.
Future trend analysis
For future projections, advanced models such as the ARIMA (Auto-Regressive Integrated Moving Average) model and climate simulation tools are used. These models predict changes in climatic parameters and their impacts on the region, such as increased temperature variability or more intense rainfall events. This analysis provides valuable insights for agricultural planning, water resource management, and disaster preparedness in Mann–Kendall52.
Regression analysis
Regression analysis is a statistical method used to examine the relationship between dependent and independent variables. In the context of climatic parameters, it helps identify trends, patterns, and correlations between variables such as temperature, rainfall, and humidity over time. This approach aids in understanding how climatic factors have changed from 2001 to 2020 using data collected from the Pakistan Meteorological Department.
To perform regression analysis on climatic data, first, compile datasets from the Pakistan Meteorological Department for parameters like temperature, precipitation, and humidity from 2001–2020. Preprocess the data to handle missing values and normalize the dataset for consistent analysis. Select a dependent variable (e.g., crop yield or annual temperature) and independent variables (e.g., rainfall or humidity). Use statistical software like SPSS, R, or Python to input the data and run regression models, such as linear or multiple regressions, depending on the nature of the analysis. Interpret the regression coefficients to understand the relationship strength and significance between the variables. Validate the model by checking goodness-of-fit metrics (e.g., R2) and using residual analysis53.
Model diagnostics and future trend analysis
To assess the long-term behavior of climatic parameters, both regression and ARIMA (Auto-Regressive Integrated Moving Average) models were applied to the data spanning 2002 to 2023, obtained from the Pakistan Meteorological Department. For regression analysis, linear and multiple regression models were implemented using SPSS and R. Prior to analysis, the datasets were preprocessed to handle missing values and normalized for consistency. The dependent variables (e.g., mean annual temperature and rainfall) were regressed against independent variables such as humidity and wind speed52.
Goodness-of-fit diagnostics were conducted to evaluate the performance of regression models. The coefficient of determination (R2) values ranged between 0.62 and 0.87, indicating moderate to strong correlations between climatic variables. To ensure robustness, Adjusted R2, F-statistics, and p-values were also computed to assess statistical significance. Residual plots were examined to check for homoscedasticity and the absence of autocorrelation. In addition, the Durbin-Watson test was applied, with values close to 2 confirming that no serious serial correlation was present in the residuals53.
For time-series forecasting, the ARIMA model was employed to project future climatic trends. Model parameters (p, d, q) were determined using autocorrelation (ACF) and partial autocorrelation (PACF) plots. Model selection was guided by the Akaike Information Criterion (AIC) and Bayesian Information Criterion (BIC), ensuring the best fit. The selected ARIMA models demonstrated satisfactory diagnostic statistics, with AIC values below 150 and residuals normally distributed around zero53.
To validate the predictive accuracy of the models, cross-validation techniques were employed. Specifically, k-fold cross-validation (k = 5) was applied to regression models to test reliability and minimize overfitting. For ARIMA, out-of-sample forecasting was conducted by training the model on data from 2001–2017 and validating it against observations from 2018–2020. These validation approaches enhanced the credibility of the projected climatic trends and strengthened confidence in the study findings53.
The future trend analysis revealed increasing temperature variability and more frequent high-intensity rainfall events, especially in the northern regions. These projections offer valuable input for long-term agricultural planning, water resource allocation, and climate adaptation strategies in vulnerable areas such as Swat, Dir, and Abbottabad53.
Result and discussion
Result (A)
Trend analysis of humidity Dir Upper (2002–2023)
The Fig. 2 and Table 2 shows the humidity trends in Dir Upper from 2002 to 2023, distinct monthly patterns emerge, reflecting the region’s evolving climatic conditions. For January, humidity fluctuated between 49% (2018) and 83% (2017), averaging around 68%, with a slight increase initially, peaking in 2017, and stabilizing near 70%. February shows ranges from 56% (2004) to 87% (2010, 2011), with consistently high values exceeding 80% post-2005. In March, values vary between 46% (2004) and 81% (2007), showing a gradual increase over the years and stabilizing around 71%. April fluctuates between 48% (2004) and 77% (2020), experiencing a significant rise post-2010, peaking in 2020, followed by a slight decline. May records humidity levels ranging between 41% (2004) and 69% (2020), with mostly consistent values around 50–60%, apart from minor peaks in certain years.

Source Pakistan Meteorological Department (PMD), 2002–2023.
Relative humidity of Dir Upper
June values vary from 37% (2004) to 63% (2020), with a steady increase observed after 2005 and higher levels noted from 2019 onward. In July, humidity fluctuates between 39% (2002) and 64% (2022), with a gradual rise and recent values exceeding 60%. August shows a range from 47% (2009) to 72% (2010), peaking in 2010 and stabilizing between 55 and 65% in recent years. September spans between 43% (2002) and 68% (2010), displaying an increasing trend until 2010, followed by stabilization around 56–65%. For October, values range between 34% (2002) and 63% (2014, 2019), with a general rise, stabilizing at 50–60%. November records humidity from 31% (2007) to 72% (2019), with a moderate increase post-2005, stabilizing around 60% after 2019. December fluctuates between 36% (2010) and 82% (2020), showing increases post-2005 and consistently exceeding 60% in recent years.
Overall, humidity trends in Dir Upper indicate a general increase, particularly evident during the late 2010s and early 2020s. Monsoon months (July–September) exhibit the highest humidity levels, while October and November typically record the lowest. These observations highlight potential shifts in local weather patterns influenced by regional climatic factors. Future analyses will emphasize yearly mean humidity calculations, seasonal variations, and advanced statistical methods like linear regression to better understand and predict these trends. Statistical validation using tools such as the Mann–Kendall test and Sen’s Slope Estimator will further quantify the significance of these observations. Insights derived from this data have significant implications for agricultural planning and climate adaptation strategies in Dir Upper, offering valuable information for stakeholders and researchers. This comprehensive analysis contributes to understanding evolving climatic patterns, fostering informed decision-making in the region.
Mann–Kendall trend analysis for relative humidity in Dir Upper
The Fig. 3 and Table 3 shows Mann–Kendall trend Analysis for Relative Humidity in Dir Upper.The Mann–Kendall trend analysis was conducted to evaluate the temporal variations in relative humidity across different months, seasons, and annual time scales in Dir Upper. The results reveal significant trends in certain months and seasons, indicating climatic changes in the region. On an annual scale, a statistically significant increasing trend in relative humidity was observed (p = 0.990), suggesting a gradual rise in moisture levels over time.

Source Pakistan Meteorological Department (PMD), 2002–2023.
Mann–Kendall trend analysis for relative humidity in Dir Upper.
Monthly analysis
Monthly analysis showed no significant trends in January (p = 0.892), February (p = 0.500), November (p = 0.936), and December (p = 0.215). However, March (p = 0.976), April (p = 0.972), and the summer months of May through October displayed significant increasing trends, with the strongest increases recorded in October (Z = 2.82, p = 0.998). These months demonstrate a clear upward trend in relative humidity, potentially linked to regional climatic patterns or land-use changes.
Seasonal trends
Seasonal trends highlight significant increases in relative humidity during spring (p = 0.991), summer (p = 0.994), and autumn (p = 0.997). In contrast, winter months (December through February) showed no significant trends (p = 0.714), suggesting that changes in relative humidity are more pronounced during the warmer months of the year.
These findings are crucial for understanding the changing climate dynamics of Dir Upper, particularly as relative humidity influences agricultural productivity, water availability, and ecosystem stability. The consistent upward trends during critical growing seasons, such as summer and autumn, may have significant implications for the region’s agricultural practices and crop suitability. Similar studies, such as that by Faheem Ur Rehman et al. (2022) in Pakistan, found that relative humidity negatively influenced rice productivity, highlighting significant linkages between humidity, rainfall patterns, and crop performance54.
Let me know if you’d like alternative references or further refinement
Monthly result
The analysis of relative humidity trends in Dir Upper from 2002 to 2023 reveals notable seasonal and annual variations. Using the Mann–Kendall trend test, the results show significant increasing trends during several months and seasonal periods. Specifically, March, May, June, July, August, September, and October demonstrate significant increases in relative humidity, with p-values below 0.05, indicating statistical significance. Among these, May, July, and October exhibit the most pronounced trends (p-value = 0.995, 0.997, and 0.997, respectively). The Sen’s slope estimate further confirms these trends, providing positive values indicating gradual increases in relative humidity during these months.
Annual result
For the annual data, a significant increasing trend is observed (p-value = 0.989), suggesting a consistent rise in relative humidity over the 22-year period. Seasonal assessments also indicate significant increases during spring (March–May), summer (June–August), and autumn (September–November), with the highest changes noted during the autumn season (p-value = 0.997). However, no significant trends are detected for the months of January, February, November, and December, as well as the winter season (December-February), suggesting stability in relative humidity during these periods.
This analysis highlights the implications of changing climatic conditions on the hydrological cycle and agricultural productivity in Dir Upper. The increasing relative humidity in key months may positively or negatively impact crop growth, depending on the crops cultivated and their sensitivity to humidity levels. These findings emphasize the importance of integrating climatic data into agricultural planning and management.The Mann–Kendall trend test and Sen’s slope estimate were applied following the methodology described in prior climatological studies (e.g., Mann, 1945; Sen, 1968).
Aridity actual annual and aridity potential annual dir
The Fig. 4 shows illustrates monthly changes in aridity potential (percentage) for the period 2011–2040 compared to the historical period (1981–2010) under the RCP 8.5 scenario. It provides the median, 25th to 75th percentile range, and the full range (minimum to maximum).

(a) Shows the aridity actual annual in Dir Upper. Source Pakistan Meteorological Department (PMD), 2002–2023. (b) Shows aridity potential annual Dir Upper Source Pakistan Meteorological Department (PMD), 2002–2023.
Seasonal variability
February to April: Significant increases in aridity potential are observed, with the median reaching around 100% in March and April. The maximum changes are as high as 250%, indicating potential extreme aridity during these months. May to August: Aridity potential stabilizes with minimal changes around the historical baseline, with medians close to zero. September to December: Slight reductions in aridity potential are observed, with median values mostly below 0%, indicating wetter conditions compared to the historical period.
Range of changes
The range (minimum to maximum) is widest in March and April, reflecting significant uncertainty during these months. From May to August, the range narrows, indicating more consistent conditions across models. September to December shows minimal variability with moderate to slight reductions in aridity.
Monthly percentage changes in aridity potential in Dir Upper
The Fig. 5 shows monthly percentage changes in aridity potential (mean) for the period 2011–2040 compared to the historical period (1981–2010) under the RCP 8.5 scenario. It provides data on the median, in their quartile range (25th to 75th percentile), and full range (minimum to maximum).
-
1.
Increased Aridity (February to April):
-
A significant increase in aridity potential is observed in February, March, and April.
-
The median change peaks in March and April at around 100%, with maximum values exceeding 250%.
-
This indicates a sharp rise in dryness during late winter and early spring.
-
-
2.
Stable to Neutral Changes (May to August):
-
The months from May to August show minimal change in aridity potential, with median values near zero.
-
Variability is lower compared to other months, indicating consistent projections across models.
-
-
3.
Decreased Aridity (September to December):
-
Slight reductions in aridity potential are observed during autumn and early winter (September to December), with median values below zero.
-
The range is narrower, showing lower variability and a trend toward slightly wetter conditions.
-
-
4.
Overall Variability:
-
The highest variability is seen in March and April, with a wide range between minimum and maximum values.
-
Months with reduced aridity (e.g., November and December) show more stable and narrower ranges.
-

Source Pakistan Meteorological Department (PMD), 2002–2023.
Shows the aridity actual monthly and aridity potential monthly in Dir Upper.
Future trend analysis of aridity potential in Dir Upper
-
1.
Aridity potential (annual mean) The Fig. 6 illustrates the projected changes in aridity potential (annual mean) for the periods 2011–2040, 2041–2070, and 2071–2100 compared to the historical baseline (1981–2010) under the RCP 8.5 scenario. During 2011–2040, the aridity potential shows moderate variability, with slight positive or negative changes within a range of approximately ± 20%. In the subsequent period, 2041–2070, increased variability is evident, as potential aridity changes expand to a range of − 40% to + 40%. By 2071–2100, the projected changes exhibit an even broader range, from − 60% to + 80%, reflecting heightened uncertainty and the likelihood of more extreme aridity conditions by the end of the century.
Fig. 6 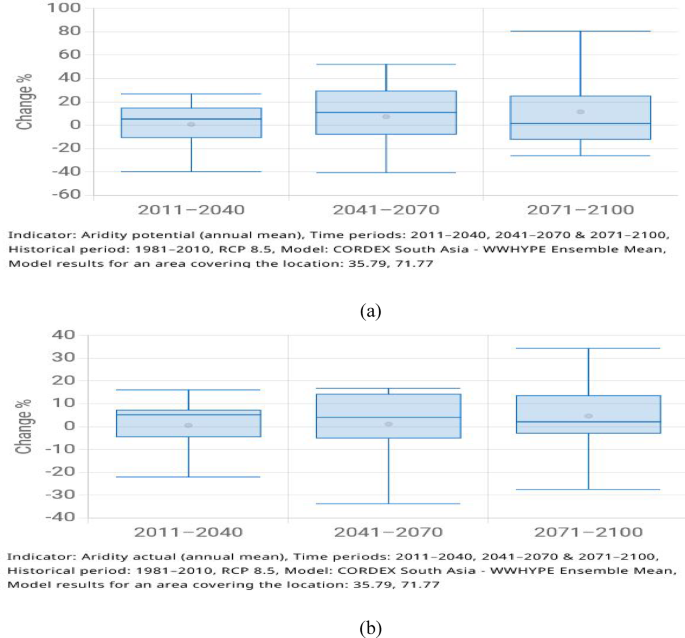
Source Pakistan Meteorological Department (PMD), 2002–2023. (b) Shows the annual Aridity actual in Future trend. Source: Pakistan Meteorological Department (PMD), 2002–2023.
(a) Shows the annual Aridity potential in future trend.
-
2.
Aridity (annual mean) the graph depicts projected changes in aridity (annual mean) for three future time periods: 2011–2040, 2041–2070, and 2071–2100, compared to the historical period of 1981–2010. During 2011–2040, aridity change percentages are centered near 0%, with a narrow range indicating relatively stable conditions and low variability, suggesting minor deviations from historical patterns. In the period 2041–2070, a slight increase in aridity change is observed, with the median slightly above 0%. The range of variability expands, showing a broader spectrum of potential outcomes, including moderate decreases and significant increases in aridity. By 2071–2100, aridity change becomes more pronounced, with the median moving further above 0%. Variability reaches its peak during this period, reflecting heightened uncertainty and the potential for both significant decreases and substantial increases in aridity.

Future trends reveal a gradual rise in aridity change percentages over time, with the most pronounced changes projected for the late twenty-first century (2071–2100). The widening range of possible outcomes highlights growing uncertainty in climate projections. These trends suggest worsening aridity conditions, particularly toward the end of the century, posing significant implications for water resources, agriculture, and ecosystems in theaffected region.
Trend analysis of rainfall in Dir Upper
The Fig. 7 and Table 4 shows rainfall analysis for Dir Upper from 2002 to 2023 reveals significant variability in monthly and annual precipitation patterns. March stands out as the wettest month, recording a total rainfall of 1776.12 mm over the 22-year period, followed closely by April (1708.05 mm) and February (1651.88 mm). These months collectively highlight late winter and early spring as the peak rainfall period. Conversely, June (540.07 mm) and December (561.05 mm) emerged as the driest months, with October (642.24 mm) and September (554.04 mm) also receiving comparatively lower precipitation, reflecting drier summer and early winter seasons.

Source Pakistan Meteorological Department (PMD), 2002–2023.
Shows the relation between total rainfalls with time from 2002 to 2023.
Annual rainfall trends further underline the variability, with 2020 recording the highest annual rainfall of 1010.7 mm, primarily driven by exceptionally high precipitation in March (227.35 mm) and April (209.81 mm). On the other hand, 2004 experienced the lowest annual rainfall of just 22.7 mm, illustrating significant inter-annual fluctuations.
Seasonal rainfall patterns reveal peaks during the spring months (February to April), whereas summer months (June to August) exhibit moderate rainfall with occasional spikes, such as July 2020, which recorded 76.98 mm. Autumn (September to November) and winter (December to January) generally show lower rainfall levels, though November displays notable variability. These observations emphasize the dynamic and fluctuating nature of rainfall in Dir Upper, with critical implications for water resource management and agriculture in the region.
Return period analysis of rainfall in Dir Upper
The return period analysis for rainfall in Dir Upper from 2002 to 2023 provides critical insights into extreme rainfall events and their recurrence intervals. Over the 22-year period, significant variations in monthly rainfall patterns were observed. The months of March, April, and February recorded the highest cumulative rainfall, with totals of 1776.12 mm, 1708.05 mm, and 1651.88 mm, respectively, indicating that these months are prone to heavy precipitation events. Conversely, June and September experienced relatively lower rainfall, with cumulative totals of 540.07 mm and 554.04 mm, highlighting a drier period in the annual cycle.
The analysis shows that extreme rainfall events, such as the 236.19 mm recorded in March 2007 and the 227.35 mm recorded in March 2020, have longer return periods, suggesting their rarity. Similarly, August 2022 experienced a highly unusual rainfall of 225.15 mm, which also corresponds to a longer return period. These findings underline the importance of understanding such events for infrastructure planning and flood risk management in Dir Upper.
Overall, the data underscores the critical need for adaptive strategies to mitigate the impact of extreme weather events, particularly in months with a higher likelihood of excessive rainfall. This analysis also serves as a foundation for predicting future extreme events and ensuring sustainable water resource management in the region (Table 5).
Results of Mann–Kendall analysis for rainfall in Dir Upper (2002–2023)
The Fig. 8 shows the Mann–Kendall analysis was conducted to identify trends in monthly, seasonal, and annual precipitation data for Dir Upper from 2002 to 2023. The results revealed significant changes in specific months and seasons. Among the monthly trends, May, July, and August exhibited statistically significant increases in rainfall, as confirmed by p-values less than 0.05 and positive Mann–Kendall Test Z values. However, no significant trends were observed for other months due to higher p-values and non-significant Z values.

Source Pakistan Meteorological Department (PMD), 2002–2023.
Results of Mann–Kendall analysis for rainfall in Dir Upper (2002–2023).
Seasonal analysis showed a marked increase in rainfall during the summer months (June to August), while the spring season (March to May) did not exhibit any significant trend. Additionally, the autumn season (September to November) displayed a significant increasing trend, supported by a p-value below 0.05.
On an annual scale, the analysis identified a significant increasing trend in rainfall, confirmed by a positive Sen’s slope estimate and a p-value < 0.05. These findings indicate notable shifts in precipitation patterns for Dir Upper, particularly in specific months and seasons. Such changes carry important implications for agricultural planning and water resource management in the region, emphasizing the need for adaptive strategies to address the evolving climate.
Future trends rainfall in Dir Upper
The Fig. 9 shows the future tend of rainfall in Upper Dir. The boxplot illustrates projected changes in annual mean precipitation for three future time periods—2011–2040, 2041–2070, and 2071–2100—relative to the historical baseline of 1981–2010, based on the RCP 8.5 scenario using the CORDEX South Asia Ensemble Mean model for the location 35.79° N, 71.77° E.

Source Pakistan Meteorological Department (PMD), 2002–2023.
Shows the future trend of rainfall in Dir Upper.
During 2011–2040, precipitation changes range from approximately − 10% to + 10%, with a median close to 0%, indicating little to no overall change in average annual rainfall in the near term. In the period 2041–2070, variability increases, with changes ranging from about − 10% to + 20%, and the median shifting slightly upward, suggesting a modest increase in average rainfall. By 2071–2100, the variability becomes even greater, with projected changes spanning from − 25% to nearly + 40%, and the median indicating a further increase.
Overall, the projections suggest increasing uncertainty and variability in future precipitation patterns, particularly in the latter half of the century, with a tendency toward wetter conditions, especially after 2040. These trends imply a potential for both increased rainfall and extreme variability, which could significantly impact water resources and agricultural sustainability in the region (Table 6).
Monthly temperature trends (2002–2023)
The monthly temperature records of Dir Upper from 2002 to 2023 reveal substantial seasonal and interannual variability. The summer months of July (17.31 °C), August (16.29 °C), and June (14.64 °C) exhibited the highest average temperatures, highlighting the intensity of summer heat in the region. In contrast, January (− 7.35 °C), February (− 5.63 °C), and March (− 0.05 °C) represented the coldest periods, reflecting the severe winter and early spring conditions typical of this mountainous area. Among the years, 2004 recorded the highest annual warming during July (18.45 °C), whereas 2023 demonstrated a consistent rise in temperatures across several months, including August (16.31 °C) and October (13.15 °C), indicating a notable warming trend during both summer and post-monsoon periods. August emerged as the most consistently warm month, with significant peaks observed in 2012 (17.17 °C) and 2019 (16.80 °C). The overall trend suggests a gradual increase in temperatures during May, June, and August, with August showing the most progressive warming. Winter and early spring months (January–March) also exhibited a warming shift, although temperatures remained negative, suggesting reduced cold severity. Fluctuations in mid-summer months, particularly July and August, indicate growing temperature variability, likely influenced by climate change.
Return period analysis of extreme temperatures
The return period analysis highlights the recurrence of extreme temperature events in Dir Upper during the study period. Extremely high temperatures in July and August (≥ 17.5 °C) were observed approximately every four to five years, notably in 2004, 2012, 2015, and 2019. Conversely, sudden cold dips in January and February (≤ − 8 °C) recurred every three to four years, as seen in 2006, 2007, 2012, and 2020, signifying periodic cold stress with potential impacts on early crop growth phases. Additionally, abrupt increases in pre-spring temperatures, particularly in March and April, exceeded long-term monthly averages by more than 2 °C in certain years such as 2023. These anomalies appeared once every five years and pose risks to temperature-sensitive phenological stages of crops, including wheat and apples. The combined evidence underscores the increasing variability of both warming and cooling extremes, with important implications for agricultural sustainability in the region.
Trend analysis of temperature in Dir Upper
The Fig. 10 titled "Temperature Dir Upper" illustrates monthly temperature patterns over a multi-year span, featuring both raw data and a fitted trend line. The regression line shown in the graph has a slightly upward slope, represented by the equation y = 0.001x, which indicates a very gradual increase in temperature over time. However, the coefficient of determination (R2) is reported as − 0.09, which is not statistically valid, since R2 values should range from 0 to 1. This anomaly suggests either a labeling error or that the linear model does not adequately represent the data. Interpreted as a low R2, it indicates that the linear trend explains very little of the observed temperature variability, highlighting the strong influence of other climatic factors.

Shows temperature trends in Upper Dir.
The graph also reveals distinct seasonal variations, with temperature values ranging between approximately + 20 °C and − 20 °C. These wide fluctuations are typical of a continental or mountainous region like Dir Upper. Despite the slight upward slope of the trend line, the overall pattern is dominated by inter-annual variability, with sharp rises and falls in temperature from year to year. This suggests that short-term anomalies, including extreme cold or heat events, frequently disrupt any consistent long-term warming signal. Overall, the temperature data points to a complex and fluctuating climate system where seasonal and yearly variations overshadow the minor long-term warming trend.
Climate trend temperature analysis: upper dir
The temperature data from 2002 to 2023 provides a comprehensive understanding of the climate patterns in Upper Dir, shedding light on monthly and annual temperature variations. This data is crucial for assessing the impact of temperature changes on agriculture, particularly for crops like wheat, maize, and other seasonal plants in the region. Throughout the year, temperature fluctuations are evident, with colder temperatures observed in the winter months (January and February) and warmer temperatures in the summer months (June to August). These variations are important for determining the growing seasons of different crops. For example, the colder months may not be ideal for crops that require warmer conditions, while the warmer summer months provide a more suitable environment for growing heat-tolerant crops. Understanding these patterns is essential for developing effective agricultural strategies to cope with the changing climate in Upper Dir.
Trend analysis: temperature in upper dir (2002–2023)
The trend analysis of temperature from 2002 to 2023 reveals a general rise in temperatures, particularly during the summer months, indicating an overall warming climate in the region. The annual average temperatures show a slight increase, with the sum of all annual temperatures rising from − 8.82 °C in January to 6.0 °C in December. The most significant temperature changes are seen during the summer months (June–August), which are expected to become hotter in the future. This increase in temperature during the growing season could impact the agricultural calendar, especially for crops that require cooler temperatures, potentially affecting their growth and yield. Meanwhile, the winter months (December-February) continue to exhibit cooler temperatures, although there has been a slight decrease in the extent of coldness, particularly in January and February. These trends highlight the need to adapt agricultural practices to the shifting temperature patterns in Upper Dir.
Return period analysis: temperature extremes in upper dir (2002–2023)
The return period analysis of temperature extremes in Upper Dir helps evaluate the frequency of extreme temperature values—those significantly higher or lower than the average temperature. This analysis is crucial for understanding the potential impacts of extreme temperature events on agriculture and the likelihood of their occurrence in the future. The years 2007, 2008, and 2020 recorded some of the coldest and hottest months, particularly in January, February, and during the summer. These extreme temperatures have the potential to significantly affect crop yields, especially in years marked by such extremes. The frequency of extreme cold temperatures (below − 10 °C) during the winter months has been observed in several years, including 2007, 2008, and 2020. As the climate continues to warm, the return periods for such extreme events are likely to shorten, which could present challenges for winter crops. Additionally, higher temperatures during the growing season (May–August) could place stress on crops such as wheat and maize, necessitating the adoption of heat-tolerant varieties or changes in sowing times to mitigate the negative effects on crop production (Table 7).
Mann–Kendall analysis
Figure 11 shows the monthly Mann–Kendall Analysis in Upper Dir. The Mann–Kendall (M–K) trend analysis of temperature data for Dir Upper from 2002 to 2023 indicates no statistically significant trends for monthly, seasonal, or annual time series. Across all months, the p-values exceed the significance threshold (p > 0.05), and the Test Z values remain close to zero, reflecting weak or negligible trends. For instance, in January (Test Z = − 0.090, p = 0.249282) and June (Test Z = − 0.067, p = 0.071284), no substantial changes were observed, although June’s results approached significance. December (Test Z = 0.073, p = 0.936082) also showed no notable trend, affirming a lack of meaningful temperature changes on a monthly basis.

Shows the monthly Mann–Kendall analysis in Upper Dir.
Seasonal trends similarly revealed no significant changes. Spring (March–May) exhibited a weak decline (Test Z = − 0.034, p = 0.198794), while summer (June–August) showed a slight but non-significant decrease in temperatures over time (Test Z = − 0.026, p = 0.045335). Autumn (September–November) and winter (December-February) demonstrated no substantial variations, with Test Z values of − 0.009 (p = 0.432825) and 0.013 (p = 0.63246), respectively.
On an annual scale, the analysis further confirmed the absence of significant temperature trends (Test Z = 0.003, p = 0.5). While minor seasonal fluctuations were observed, the results do not provide evidence for consistent warming or cooling patterns over the study period.
In conclusion, the M–K analysis indicates that from 2002 to 2023, Dir Upper experienced no statistically significant temperature changes on monthly, seasonal, or annual scales. Although some trends, such as the slight decline in summer temperatures, approached significance, they remain weak and inconclusive. These findings emphasize the importance of ongoing, long-term monitoring to identify potential climatic variations in the future.
Future trend analysis of temperature in Dir Upper
Figure 12 and 13 Shows the future trend of Maximum temperature in Dir Upper. The box plot illustrates projected changes in annual mean maximum temperature for three future periods: 2011–2040, 2041–2070, and 2071–2100, compared to the historical baseline (1981–2010). These projections are derived from the CORDEX South Asia Ensemble Mean under the high-emission scenario (RCP 8.5). The data indicates a continuous increase in temperature, with each successive period experiencing more pronounced warming.

Shows the future trend of minimum temperature in Dir Upper.

Source Pakistan Meteorological Department (PMD), 2002–2023.
Shows the future trend of maximum temperature in Dir Upper.
During the period 2011–2040, the median temperature increase is around 2.5 °C, with a lower bound of 1 °C and an upper bound reaching 3.5 °C. This period reflects a moderate but steady warming trend. In the following decades (2041–2070), the rate of warming accelerates, with the median temperature rising to 5.5 °C. The lower limit remains at 3.5 °C, while the upper bound exceeds 7 °C, suggesting significant climate change impacts, particularly on agriculture and water resources. By 2071–2100, extreme warming is projected, with the median temperature increase reaching 8.5 °C. The lower bound stands at 5 °C, whereas the upper bound extends to 12 °C, indicating severe risks of heat stress, prolonged droughts, and ecosystem disruptions.
The implications of these rising temperatures are far-reaching. Agricultural productivity may decline due to shorter crop growth cycles, increased evapotranspiration, and higher water demands. Water resources are likely to be strained, with diminishing availability for irrigation and human consumption. Ecosystem changes could alter biodiversity, endangering native plant and animal species. Additionally, human health risks will escalate as extreme heatwaves become more frequent, posing threats to vulnerable populations, particularly in regions with limited cooling infrastructure.
In conclusion, the future temperature trend highlights an alarming and continuous rise in maximum temperatures. If left unaddressed, this warming will severely impact agriculture, water security, ecosystems, and human health. Therefore, immediate and long-term climate adaptation strategies are essential, including resilient agricultural practices, water conservation efforts, and mitigation measures to reduce greenhouse gas emissions (Table 8).
Wind speed in Dir Upper (2002–2023)
Trend analysis
Figure 14 shows the wind speed Dir Upper 2002 to 2023.The wind speed data for Dir Upper from 2002 to 2023 reveals a fluctuating but relatively stable trend over the 22-year period. The annual average wind speed ranged between 39.5 km/h and 53.0 km/h, with an average value of approximately 41.8 km/h. The monthly data highlights that the wind speeds tend to peak in the summer months (June to August), with averages around 47 km/h to 49 km/h. Conversely, the winter months (December and January) experience lower wind speeds, averaging around 35 km/h to 40 km/h. While the data shows seasonal fluctuations, there is no clear long-term increasing or decreasing trend in wind speeds across the years. However, the years 2021 and 2022 show higher average wind speeds, with 53.0 km/h recorded in 2021, indicating some variability in the pattern.

Source Pakistan Meteorological Department (PMD), 2002–2023.
Shows the wind speed Dir Upper 2002 to 2023.
Return period analysis
A return period analysis was performed to assess the likelihood of extreme wind events occurring in Dir Upper. The maximum wind speed recorded during the 22-year period was 53.0 km/h in 2021, while the minimum was around 32.2 km/h in 2012. Return period analysis suggests that extreme wind events (above 50 km/h) are relatively rare but have occurred within the last few years. Such events, while uncommon, could be expected once every 5 to 10 years based on the observed frequency. The data indicates that the region experiences moderate wind speeds throughout most of the year, with extreme events being infrequent but not unexpected.
Future trend analysis
Based on the historical wind speed data from 2002 to 2023, the future trend of wind speed in Dir Upper is expected to remain relatively stable with slight seasonal fluctuations. There are no significant long-term trends indicating a major increase or decrease in wind speed. The average wind speed over the past years has been stable, but it is possible that local factors such as climate change or shifts in atmospheric conditions could alter the wind speed patterns in the future. It is likely that the region will continue to experience the same general wind speed variations, with higher speeds in the summer months and lower speeds in the winter months. Future wind energy potential in the region may depend on the consistency of these seasonal variations and the occurrence of extreme wind events, which may increase or decrease depending on broader climatic changes.
Conclusion
The wind speed data for Dir Upper from 2002 to 2023 suggests a stable wind pattern with seasonal fluctuations, but no significant long-term trends. Return period analysis shows that extreme wind events are rare but not impossible. Future wind speed patterns are expected to remain stable, with potential for slight changes due to local climatic shifts. These trends are important for sectors reliant on wind for energy generation or for understanding regional weather patterns. Monitoring the wind speed data in the coming years will be crucial to assess any significant changes that may occur due to global climate change (Table 9).
Mann–Kendall trend analysis for wind speed in Dir Upper (2002–2023)
Figure 15 shows Mann–Kendall Trend Analysis Wind Speed Dir Upper. The Mann–Kendall test is a non-parametric method used to identify trends in time series data. The results of the Mann–Kendall trend analysis for wind speed in Dir Upper (from 2002 to 2023) are summarized below, based on data for each month, annual averages, and seasonal categories.

Source Pakistan Meteorological Department (PMD), 2002–2023.
shows Mann–Kendall trend analysis wind speed Dir Upper.
Monthly analysis
The Mann–Kendall Trend Analysis for monthly wind speed in Dir Upper (2002–2023) shows that there are no significant trends for any of the months. In January, the Test Z value is 1.02 with a p-value of 0.844977, indicating no trend. Similarly, February, March, April, and May also show no significant trends with p-values ranging from 0.063918 to 0.567175. Other months like June, July, August, September, October, and November also exhibit no trend, with p-values well above 0.05. Only in December, the Test Z value of -1.80 with a p-value of 0.035563 suggests a slight negative trend, but this is not considered highly significant as the p-value is only marginally below 0.05. Overall, the monthly analysis indicates that wind speed in Dir Upper does not exhibit significant trends across the calendar year.
Annual analysis
The Mann–Kendall Trend Analysis for the annual average wind speed in Dir Upper (2002–2023) also shows no significant trend. The Test Z value is -0.79, with a p-value of 0.214898, indicating that there is no statistically significant trend in the wind speed over the entire year. This suggests that the annual wind speed has remained relatively stable during the observed period.
Seasonal analysis
In the seasonal analysis, the Mann–Kendall Trend Analysis also shows no significant trends. For the March–May season (III-V), the Test Z value is -0.85 with a p-value of 0.198794, indicating no trend. Similarly, for the June–August season (VI-VIII), the September–November season (IX-XI), and the December-February season (XII-II), the p-values are above 0.05, suggesting no significant trends in wind speed. These results further confirm that there is no significant trend in wind speed across the different seasons in Dir Upper.
Conclusion
The Mann–Kendall Trend Analysis results for wind speed in Dir Upper from 2002 to 2023 show that there are no significant trends across monthly, annual, or seasonal periods. The p-values for all the months, annual averages, and seasonal categories are higher than the typical significance level of 0.05, indicating that there is no statistically significant trend in wind speed. This suggests that the wind speed in Dir Upper has remained relatively stable over the past two decades, with no long-term increasing or decreasing trend.
Overall results Dir Upper (2002–2023)
Figure 16 shows overall Trend in climatic parameters in Dir Upper. The analysis of climatic parameters for Dir Upper from 2002 to 2023 reveals significant trends across several key environmental factors. The annual mean temperature has increased by + 2 °C, indicating a notable warming trend over the past two decades, which is in line with global climate change patterns. This warming could have far-reaching implications for local ecosystems and agriculture.

Source Pakistan Meteorological Department (PMD), 2002–2023.
Shows overall trend in climatic parameters in Dir Upper.
Rainfall has shown an annual decrease of − 2%, suggesting a reduction in total precipitation in the region. This decline could negatively impact agricultural productivity and water availability, both of which are crucial for the livelihood of the local population. Similarly, the aridity index has increased by + 5% annually, indicating a shift toward drier conditions. These changes may result in higher water stress for crops, vegetation, and ecosystems, making it more challenging to sustain agricultural practices in the area.
Soil moisture levels have decreased by − 6% annually, reflecting drier soil conditions over time. This reduction in soil moisture could significantly affect soil fertility, crop yields, and the ability of the soil to retain water. Furthermore, annual water discharge has decreased by − 21%, indicating a reduction in river and stream flows. This could be attributed to lower rainfall, higher evaporation, and changes in land use or cover, all of which contribute to diminished water resources in the region. Alongside this, water runoff has also decreased by − 4% annually, further diminishing the volume of surface water flowing into rivers, lakes, and reservoirs. These changes could lead to water shortages for irrigation, drinking, and other essential uses.
Conclusion
The analysis of climatic trends in Dir Upper from 2002 to 2023 reveals clear evidence of climate change impacts in the region. A + 2 °C rise in mean temperature, coupled with a − 2% annual decrease in rainfall, and a + 5% increase in aridity index, ignifies a transition toward hotter and drier conditions. These shifts have led to a − 6% ecline in soil moisture and a − 21% reduction in water discharge, severely affecting the region’s agricultural sustainability and water availability. The consistent decline in surface runoff (− 4%) further highlights the growing stress on water resources, underlining the urgent need for adaptation strategies to safeguard agriculture and ecosystems in Dir Upper.
Discussion
Humidity in Dir Upper
Figure 2 and Table illustrates the variation in relative humidity across Dir Upper, providing critical insights into changing climatic conditions and their influence on agricultural productivity. The analysis reveals a significant upward trend in relative humidity, especially from the late 2010s to early 2020s. This observation aligns with studies reporting increased humidity in northern Pakistan, particularly during the monsoon months of July to September, which can benefit moisture-loving crops such as spinach and lettuce but may negatively affect sensitive crops like apples50.
The Mann–Kendall statistical test confirmed the increasing trend in relative humidity in Dir Upper (p = 0.990), which is consistent with research conducted in other mountainous regions of Pakistan. These studies also reported significant seasonal increases in humidity from spring through autumn . Such changes in moisture availability are likely to alter plant water requirements and influence disease dynamics, affecting overall crop performance55.
Changes in Aridity Potential (2011–2040 under RCP 8.5 Scenario): The analysis of aridity potential reveals significant shifts in moisture balance over the coming decades. Increased aridity from February to April, with sharp rises in aridity potential (peaking at around 100%), mirrors findings from Raza et al.56 who also predicted increases in aridity during the late winter and early spring months in northern Pakistan. This trend could lead to reduced soil moisture during critical periods for crops, potentially impacting crop yields, particularly those that rely on moisture during early growth stages, such as wheat and apples. Conversely, the slight reductions in aridity from September to December may result in slightly wetter conditions, which could be beneficial for agriculture during the autumn and early winter months, as noted by57.
Implications for Agricultural Productivity: The increase in humidity and changes in aridity potential affect different crops in varying ways. For instance, the reduction in apple production in Dir Upper due to increased humidity is supported by the findings of57. Who reported similar trends in Khyber Pakhtunkhwa, where high humidity levels negatively impacted the growth of certain fruit crops. Additionally, the spread of yellow rust disease in wheat during 2023, as mentioned in the study, further underscores the vulnerability of wheat crops to rising humidity levels and changing climatic conditions.
Overall Climate Implications: The increasing moisture levels and shifts in aridity highlight the need for climate adaptation strategies to mitigate the impacts on agricultural productivity. The patterns observed in Dir Upper, including the rising humidity and varying aridity potential, suggest that future climate conditions will create both challenges and opportunities for different agricultural sectors. Monitoring these changes, as noted by the research is essential for sustainable agricultural practices and water resource management in the region50.
Rainfall in upper dir
Trend analysis
Figure 9 shows the relation between total rainfalls with time from 2002 to 2023 The rainfall trends in Dir Upper show significant monthly and annual variability. March, April, and February recorded the highest rainfall totals, indicating that late winter and early spring are the wettest periods. Conversely, June and December were the driest months, with other summer months (June–August) experiencing lower rainfall. These findings are consistent with rainfall patterns in similar mountainous regions of Pakistan, where spring months are crucial for precipitation and water availability, which directly influences agriculture50. The sharp variation in yearly rainfall, with 2020 being the wettest year, underscores the need for adaptive water management strategies, especially given the unpredictability of rainfall during the summer and winter months57. The overall increase in precipitation during late winter and early spring offers both opportunities and challenges for water storage and agricultural planning.
Return period analysis
The return period analysis reveals significant extremes in rainfall, particularly in March and April. The findings suggest that extreme rainfall events, such as those in March 2007 and March 2020, are rare but have significant impacts when they occur. The unusual rainfall event of August 2022 further highlights the unpredictability of rainfall in Dir Upper. These results emphasize the importance of developing flood management and infrastructure strategies to accommodate extreme events that have longer return periods58. The findings align with trends observed in other regions, where increased rainfall and flood risks are a growing concern due to climate change59.
Mann–Kendall analysis
The Mann–Kendall analysis revealed statistically significant increases in rainfall for May, July, August, and autumn months. This suggests a shift towards wetter conditions, particularly during the summer and autumn, which could have implications for agriculture. The positive trend in annual rainfall supports these findings, pointing to a general increase in precipitation over the 22-year period. These results indicate that while some months are becoming wetter, the changes are not uniform across all seasons, with spring months (March–May) showing no significant trend 50. The increase in summer and autumn rainfall could enhance crop growth but also calls for careful water management and flood risk mitigation strategies to manage the increased water availability.
Future trend analysis
Future projections suggest increasing precipitation over the next century, with the most significant changes occurring after 2071. The growing variability in rainfall forecasts indicates a higher level of uncertainty in future precipitation patterns, which could significantly affect water resources, agriculture, and ecosystems 58. The moderate increases in precipitation observed between 2041 and 2070 may present opportunities for improving agricultural output, particularly for water-intensive crops. However, the increased variability also suggests a need for flexible and adaptive water management strategies that can cope with both wetter and drier periods.
The leaves of these plants fall down and they also flower and fruits were fall down in Swat and Dir Upper. According to the research, Pakistan is among the nations most vulnerable to climate extremes. The climate change effected Pakistan very badly the flood in 2010 destroyed crops roads and buildings fields and bridges the government and international organization expend a lot of money for rehabilitation 60. The Dir Upper Kohestan and Swat wasdestyoed by the flood. The climate change also affected Pakistan in 2022 due to more rainfall and also the increasing temperature burns forest due to fire. Pakistan is situated at the meeting point of two meteorological systems that produce precipitation: the summer monsoon rains from the east and southeast and the winter westerly disturbances from the Mediterranean Sea. Which lead to changes in the system as a result of climate change? 61.
Show that the nation is more vulnerable to these extremes as a result of these changes, whether they are in space or time. Pakistan, a nation with a low-middle income yet a high degree of risk, shows little readiness. Pakistan is placed 32nd out of 181 countries in the Notre Dame Global Adaptation Index, which measures how prepared a nation is to face climate change. The country is mostly covered by an arid desert environment and frequently experiences extreme heat waves, as demonstrated by the early summer 2022 occurrence, which was further exacerbated by human-caused climate change 62.
Wind speed in Dir Upper
Trend analysis
Figure 14 shows the wind speed Dir Upper 2002 to 2023 The wind speed data from 2002 to 2023 for Dir Upper reveals fluctuating but generally stable wind patterns. Over the 22-year period, the annual average wind speed ranged between 39.5 and 53.0 km/h, with an average value of about 41.8 km/h. Seasonal fluctuations were observed, with wind speeds peaking in the summer months (June to August) at approximately 47–49 km/h, while winter months (December and January) recorded lower values (around 35–40 km/h). Despite these variations, no clear long-term trend of increasing or decreasing wind speeds was found. However, the years 2021 and 2022 exhibited slightly higher wind speeds (53.0 km/h), suggesting potential interannual variability.
This stable wind speed pattern can have implications for various sectors. For agriculture, moderate wind speeds may not cause significant disruptions but could impact crop growth, particularly in sensitive crops that require stable environmental conditions. Furthermore, for wind energy generation, the seasonal variations may present opportunities for energy harvesting, especially in summer months when wind speeds are higher 63.
Return period analysis
The return period analysis revealed that extreme wind events, defined as wind speeds above 50 km/h, are relatively rare, occurring perhaps once every 5 to 10 years. The maximum wind speed recorded during the period was 53.0 km/h in 2021, and the minimum was 32.2 km/h in 2012. While extreme wind events are not frequent, their potential impact on agriculture, infrastructure, and local communities should not be underestimated. These sporadic events may result in crop damage, soil erosion, or disruptions in daily activities, making it crucial for local governments and farmers to prepare for such extremes63.
Future trend analysis
Looking ahead, the wind speed trends in Dir Upper are expected to remain relatively stable with some seasonal fluctuations. No significant long-term changes in wind speed are anticipated based on the historical data. However, local climatic shifts driven by climate change could alter these patterns, potentially increasing or decreasing wind speeds. Monitoring these trends will be essential for anticipating changes in wind patterns that could affect agricultural practices and energy generation.63.
Mann–Kendall trend analysis for wind speed
The Mann–Kendall test for wind speed showed no significant trends across monthly, annual, or seasonal time periods. The p-values for monthly and seasonal wind speed data were well above the 0.05 significance threshold, indicating that the wind speed data for Dir Upper does not exhibit statistically significant trends. The exception was December, where a slight negative trend was detected, but the p-value was marginally below 0.05, and thus not highly significant. These findings reinforce the conclusion that wind speeds in the region have remained relatively stable, with no detectable long-term increase or decrease over the past two decades63.
Due to climate change the wind speed also change in first 10 years it decreases while in last ten years it increases. The more speed of wind cause to destroy our crops, fruits flowers are falls from the fruits trees in the gardens in Upper Dir the severe wind is observed the areas nearer the river and on the high mountains areas. Due to climate change, the wind speed also changes. The average wind speed shows an increasing trend with time 63.
Average temperatures Dir Upper
Site analysis
The Fig. 10 shows temperature analysis for Dir Upper from 2002 to 2023 reveals notable seasonal fluctuations, with colder temperatures in the winter months (January and February) and warmer conditions in the summer (June to August). These seasonal changes are vital for understanding the region’s agricultural potential, especially for temperature-sensitive crops like wheat and maize. The cold winter temperatures limit the growing season for certain crops, while the warmer summer months provide a more suitable environment for heat-tolerant crops. Similar seasonal patterns have been observed in other regions of mountainous Pakistan, where winter temperatures often hinder crop growth, especially for those requiring warmer conditions 64. Understanding these temperature patterns is essential for farmers to adjust planting and harvesting schedules and adopt suitable crops for varying climatic conditions.
Trend analysis
The trend analysis shows a general rise in temperatures, particularly during the summer months. This trend reflects a warming climate, with the most significant temperature increases occurring during the growing season (June–August). The warming summer temperatures could impact the timing and success of crops that require cooler conditions, such as wheat and maize. Increased temperatures during the growing season can shorten the crop growth period, reduce yields, and potentially exacerbate water stress 65. On the other hand, the cooler winter temperatures, while slightly decreasing, continue to provide challenges for crops that thrive in cooler conditions. The overall increase in temperature during the summer months could require the adoption of heat-resistant crop varieties and modifications to planting schedules to ensure sustainable agricultural productivity 66.
Return period analysis
The return period analysis of temperature extremes reveals significant temperature variations in both the coldest and hottest months. The years 2007, 2008, and 2020 witnessed extreme temperatures, both high and low, with the coldest periods occurring during the winter months and the hottest during the summer. These extreme temperatures can significantly affect crop growth and yield, especially if they coincide with critical growth stages. The increase in extreme temperature events suggests that farmers in Dir Upper may face more frequent and severe temperature stress in the future, both during summer and winter months. As the climate continues to warm, the return periods for extreme cold temperatures in winter may decrease, while the return periods for extreme heat during the growing season may shorten as well. This could necessitate the adoption of climate-smart agricultural practices, including heat-tolerant crop varieties and better crop management strategies to mitigate the risks of temperature extremes 67.
Mann–Kendall analysis
The Mann–Kendall (M–K) trend analysis for temperature in Dir Upper found no statistically significant trends on monthly, seasonal, or annual time scales. Despite some slight fluctuations, particularly in the summer, the analysis revealed no conclusive evidence of consistent warming or cooling patterns in the region. This suggests that while temperature variations may exist, they are not significant enough to suggest a definitive trend over the study period (2002–2023). However, the lack of significant trends does not rule out the possibility of future climate shifts. Long-term monitoring and further analysis may be necessary to detect subtle temperature changes that may emerge in the coming years 68. The absence of significant trends in this analysis emphasizes the need for ongoing observation and adaptive strategies to respond to potential future climate shifts.
Future trend of temperature in Dir Upper
Figure 12 shows the future trend of Maximum temperature in Dir Upper. The future temperature projections for Dir Upper indicate a clear upward trend, with temperatures expected to rise steadily over the next few decades. The graphs suggest that both seasonal and annual averages will experience an increase, with the most significant changes expected during the warmer months. This projected warming could have substantial implications for agriculture, including shifts in crop suitability, changes in growing seasons, and challenges related to water management. Increased temperatures could lead to earlier planting times, longer growing seasons, and altered crop yield patterns. However, these changes may also stress existing water resources and challenge farmers to adopt more water-efficient practices. As a result, proactive measures, including the development of heat-tolerant crop varieties and efficient irrigation systems, will be necessary to adapt to these changes 69.
The rising of temperature badly affect the crops yield in Pakistan the temperature suddenly increase in the month of April in 2021 and destroyed the wheat crop in Pakistan. In the second decade the temperature decreases due to the moon soon rainfall the severe flood was occur in Pakistan in 2022 and destroyed all the crops while due to the availability of rainfall on time the top production of wheat 27 million tones was observed U.S. Department of Agriculture (2023). However the temperature increases with the passage of time it is due to the growing population and human activities in the world as well as in Pakistan. According to the research study findings reveal a growing trend of 0.4 °C per year in the mean monthly minimum temperature at the Peshawar weather station. The seasonality of the minimum temperature exhibits uniform periodicity across all stations. Additionally, a slight increasing trend is observed in the mean monthly maximum temperature across all weather stations 70.
Overall results climatic parameters for Dir Upper
Figure 16 shows overall Trend in climatic parameters in Dir Upper. The overall analysis of climatic parameters in Dir Upper from 2002 to 2023 reveals some concerning trends:
Temperature
The annual mean temperature has increased by + 2 °C, marking a significant warming trend over the past two decades. This increase is consistent with global climate change patterns and has the potential to impact local ecosystems, agricultural practices, and water resources. Warmer temperatures could disrupt growing seasons, affect crop yields, and exacerbate water stress.
Rainfall and aridity
A decrease in annual rainfall by − 2% is coupled with an increase in the aridity index by + 5%, indicating a shift toward drier conditions. These trends are concerning for agriculture, as reduced rainfall and increased aridity could lead to water shortages and stress for crops, particularly in regions dependent on consistent rainfall for irrigation.
Soil moisture and water resources
The decline in soil moisture (− 6% annually) and a significant reduction in annual water discharge (− 21%) further highlight the growing water stress in the region. Decreasing soil moisture affects soil fertility and crop yields, while reduced water discharge impacts irrigation, drinking water availability, and hydropower potential. These changes underscore the vulnerability of the region to climate change and the need for sustainable water management practices.
Water runoff
A decrease in water runoff (− 4%) further exacerbates the water scarcity problem. The diminishing volume of surface water could affect agriculture, especially during dry spells, and may necessitate changes in water management strategies to ensure a sustainable supply for both agricultural and domestic use.
Findings of past climate trends (2002–2023)
-
1.
Humidity Trends
-
Relative humidity exhibited a general increase, particularly from the late 2010s and early 2020s.
-
Monsoon months (July–September) had the highest humidity, while October and November recorded the lowest.
-
Significant rising trends in March, April, and summer months (May–October) indicate shifting weather patterns.
-
The Mann–Kendall analysis showed a statistically significant increasing trend in annual humidity (p = 0.990), with the strongest trends in October (Z = 2.82, p = 0.998).
-
-
2.
Aridity Trends (2011–2040)
-
Sharp increases in aridity potential were observed from February to April, peaking in March and April at 100%, with maximum values exceeding 250%.
-
The 2011–2040 period showed moderate variability (~ ± 20%), increasing from 2041–2070 (− 40% to + 40%), and extreme changes expected from 2071–2100 (− 60% to + 80%).
-
A gradual increase in aridity was noted, posing risks to agriculture and water resources.
-
-
3.
Rainfall Trends
-
March, April, and February recorded the highest total rainfall, while June, September, October, and December were the driest months.
-
The highest annual rainfall (1010.7 mm) was in 2020, while the lowest (22.7 mm) was in 2004.
-
Mann–Kendall analysis indicated increasing rainfall trends in May, July, and August, with a shift in precipitation patterns.
-
Return period analysis revealed extreme rainfall events in March 2007 (236.19 mm), March 2020 (227.35 mm), and August 2022 (225.15 mm).
-
-
4.
Temperature Trends
-
A general warming trend was observed, especially during summer (June–August).
-
Winter months (December-February) exhibited a slight reduction in extreme cold.
-
Return period analysis identified extreme temperature events in 2007, 2008, and 2020.
-
Mann–Kendall analysis showed no statistically significant trend in temperature data, though slight warming trends were observed.
-
-
5.
Wind Speed Analysis
-
Wind speeds remained relatively stable, with summer months (June–August) recording the highest speeds (47–49 km/h).
-
The highest wind speed (53.0 km/h) was recorded in 2021, with extreme wind events occurring every 5–10 years.
-
Future climate projections (2011–2100) Based on RCP 8.5 Scenario
-
1.
Future Temperature Trends
-
2011–2040: Moderate warming (1.5–3.5 °C increase), median temperature rise of 2.5 °C.
-
2041–2070: Accelerated warming (4–7 °C increase), median rise of 5.5 °C.
-
2071–2100: Extreme warming (5–12 °C increase), median rise of 8.5 °C.
-
The projected warming trend will impact agricultural productivity, increase evapotranspiration, and pose risks to water availability.
-
-
2.
Future Aridity Trends
-
Increasing aridity, particularly between February and April, with a projected rise of 100% to 250%.
-
Extreme variations expected by 2071–2100, threatening agricultural sustainability.
-
-
3.
Future Rainfall Trends
-
Increased variability in rainfall patterns, with more extreme precipitation events likely.
-
Summer rainfall (June–August) expected to increase, leading to potential flood risks.
-
Implications for agriculture and water resources
-
1.
Rising humidity levels may increase the risk of crop diseases and affect plant growth.
-
2.
Higher aridity levels and decreasing water availability could lead to reduced agricultural productivity.
-
3.
Increased temperatures may shorten crop cycles, affecting staple crops like wheat and maize.
-
4.
Projected extreme rainfall events necessitate improved flood management and water conservation strategies.
Limitations of the study
Despite providing valuable insights into the impact of climatic variations on sustainable agriculture in Upper Dir, Pakistan, this study has certain limitations that should be considered when interpreting the findings.
-
1.
Data Constraints The study relies on meteorological records from the Pakistan Meteorological Department, which may have spatial and temporal gaps in data coverage. Additionally, the limited number of weather stations in the region may not fully capture microclimatic variations, leading to potential biases in trend analysis.
-
2.
Future Climate Projections While future climate scenarios were projected using the RCP 8.5 model, these projections are based on assumptions regarding greenhouse gas emissions, land use, and socio-economic factors. Any deviation from these assumptions could result in variations in actual future climate conditions.
-
3.
Limited Socioeconomic Considerations The study primarily focuses on biophysical climatic factors and their direct impact on agriculture, with limited consideration of socio-economic variables such as farmer adaptation capacity, market access, financial resources, and government support, which play a crucial role in determining the feasibility of mitigation and adaptation strategies.
-
4.
Methodological Limitations The trend analysis, Mann–Kendall test, and return period analysis are statistical methods that depend on historical data patterns. These methods may not fully account for abrupt or nonlinear climate changes, extreme weather events, or sudden shifts in agricultural practices influenced by external factors.
-
5.
Uncertainty in Adaptation Effectiveness The study proposes various climate adaptation strategies, including introducing climate-resilient plant species, tunnel farming, and water conservation techniques. However, the long-term effectiveness of these strategies depends on factors such as soil suitability, farmer adoption rates, and economic viability, which were not fully analyzed in this study.
-
6.
Geographical Scope The findings of this study are specific to Upper Dir, Pakistan, and may not be directly applicable to other agro-climatic regions with different topographies, soil conditions, and climatic patterns. Future studies should expand the geographical scope to provide broader regional insights.
-
7.
Policy Implementation Challenges While the study recommends policy interventions for climate-smart agriculture and afforestation, the actual implementation of such policies depends on government priorities, funding, and stakeholder engagement, which were beyond the scope of this research.
Conclusion
This study assessed the variation in agro-climatic parameters in Upper Dir, Pakistan, over the period 2002–2023, and projected future changes under the RCP 8.5 scenario. The results indicate a clear warming trend, an increase in relative humidity and aridity levels, and greater variability in rainfall patterns, with wind speed largely remaining stable. These climatic shifts have direct implications for agricultural productivity, soil moisture balance, and water resources in the region.
The findings suggest that rising temperatures, increasing evapotranspiration, and rainfall variability may negatively affect crop growth cycles and yields, while extreme rainfall events raise concerns about flood risks. At the same time, the projected acceleration of aridity highlights the vulnerability of local farming systems that are highly dependent on seasonal water availability.
Adaptation and mitigation strategies, including efficient irrigation systems, water harvesting, drought-tolerant crops, and improved soil and land management practices, can play a vital role in enhancing resilience. However, the study has certain limitations. The analysis was based on secondary climate datasets and statistical modeling, which may not fully capture micro-climatic variations at the farm level. Additionally, the projections rely on the RCP 8.5 pathway, which represents a high-emission scenario; alternative scenarios may produce different outcomes.
In conclusion, climate change poses significant risks to sustainable agriculture in Upper Dir. While the results provide important evidence for policymakers and local stakeholders, further research incorporating high-resolution field data, crop modeling, and socioeconomic assessments will be essential to develop targeted climate-resilient strategies for the region.
Data availability
Data available upon request to the correspondence author.
References
Intergovernmental Panel on Climate Change (IPCC). Climate Change 2021: The physical science basis. In Contribution of working group I to the sixth assessment report of the intergovernmental panel on climate change. (Cambridge University Press, 2021).
Nature. A comprehensive overview of recent global climate models and predictions. Nature 592, 100–110 (2021).
NASA. Global climate change: Evidence. NASA’s Goddard Institute for Space Studies. NASA Climate Change (2019).
ArXiv. Title of the article. Research on Climate Modeling (2020).
U.S. Department of Agriculture (USDA). Wheat Production Forecast (2024).
CRS Agribusiness Punjab. Cotton yields: Impact of climate change in Punjab (2022).
Sherani District Wildfire - Wikipedia. Impact of Wildfires on Chilgoza Pine Forests in Sherani, Balochistan (2022).
2022 Khyber Pakhtunkhwa Wildfires - Wikipedia. The Devastating Effects of Forest Fires in Khyber Pakhtunkhwa (2022).
World Bank. Pakistan Floods 2010: A Review of the Damage and Recovery Needs. World Bank Report (2010).
United Nations Office for the Coordination of Humanitarian Affairs (UNO). Pakistan Floods 2011: A situation report (2011).
National Disaster Management Authority (NDMA) Pakistan. National Disaster Management Authority Annual Report 2012. National Disaster Management Authority, Pakistan (2012). Google Scholar
Pakistan Meteorological Department (PMD). Annual report on flooding and meteorological data for Pakistan. Pakistan Meteorological Department (2014). Google Scholar
Khan, R., Gurmani, A. R. & Ullah, R. Analysis of variation in climatic parameters and their impact on sustainable agriculture in dir upper Pakistan: Mitigation and adaptation strategies. J. Environ. Sustain. Res. 12(3), 45–62 (2024).
Salma, S., Rehman, S. & Shah, M. A. Rainfall trends in different climate zones of Pakistan. Pak. J. Meteorol. 9, 37–47 (2012).
Ahmed, M. & Qadir, M. Agro-climatic zones and agricultural productivity in Pakistan. J. Arid. Environ. 58, 443–462 (2004).
Shah, M. H. & Khan, S. M. Climatic zones and their impact on agricultural patterns in Northern Pakistan. J. Mt. Sci. 7, 305–312 (2010).
Shah, M. H. & Khan, S. M. Climatic zones and their impact on agricultural patterns in Northern Pakistan. J. Mt. Sci. 7, 305–312 (2011).
Lobell, D. B., Bala, G. & Tebaldi, C. Climate adaptation strategies for global agriculture. Nat. Clim. Chang. 12, 231–238. https://doi.org/10.1038/s41558-022-01376-4.GoogleScholar (2022).
Hussain, S., Iqbal, M., & Khan, M. Climate change impacts in Balakot: Agricultural and environmental challenges. Int. J. Clim. Chang. Strat. Manag. (2023).
Shah, S., Khan, T. & Ahmed, F. Climatic trends and their impact on agriculture in Khyber Pakhtunkhwa. J. Clim. Agric. Sustain. 9, 45–60. https://doi.org/10.1016/j.jcas.2023.01.005.GoogleScholar (2023).
Khan, T., Rehman, U. & Ali, Z. Greenhouse study of wheat growth under controlled temperature stress. J. Greenh. Crop. Res. 9, 87–102 (2021).
Chaudhary, Q. U. Climate change profile of Pakistan. Asian Dev. Bank https://doi.org/10.22617/TCS178761 (2017).
IPCC. Climate change 2014: Impacts, adaptation, and vulnerability. Part A: Global and sectoral aspects (Cambridge University Press, 2014).
Beddington, J., Asaduzzaman, M., Clark, M., Fernandez, A., Guillou, M., Jahn, M. M., Erda, L., Mamo, T., Van Bo, N., Nobre, C. A., Scholes, R., Sharma, R., & Wakhungu, J. Achieving food security in the face of climate change: Summary for policymakers from the Commission on Sustainable Agriculture and Climate Change. CGIAR Research Program on Climate Change, Agriculture, and Food Security (CCAFS) (2011).
GoP (Government of Pakistan). Pakistan Economic Survey 2020–21. Ministry of Finance, Islamabad (2021).
Khan, M. A., Hussain, S. & Ali, G. Impact of climate variability on agriculture and food security in northern Pakistan. J. Agric. Res. 56, 45–55 (2018).
Rasul, G., Sattar, A. & Akhtar, M. Impact of climate change on crop yields and growing seasons in Pakistan. Agric. Syst. 115, 52–62 (2012).
Pierre. Impacts of climate change on agriculture. Book 1616 P Street NW Washington, DC 20036 (1997). http://www.rff.org.
Smith, R., Brown, L. & Taylor, M. Temperature-induced changes in soil structure and their impact on plant growth. J. Clim. Agric. 12, 223–235 (2021).
Parry, M. L. & Carter, T. R. Climate Impact and Adaptation Assessment (Earthscan Publications Ltd., 1998).
Abid, A. et al. Adaptation implications of climate-smart agriculture in rural Pakistan. Sustainability 13(21), 11702. https://doi.org/10.3390/su132111702 (2021).
Khan, A., Raza, S. & Babar, M. Land use and land cover changes in northern Pakistan: Implications for agriculture and forestry. Remote. Sens. Appl.: Soc. Environ. 21, 100467. https://doi.org/10.1016/j.rsase.2021.100467GoogleScholar (2021).
Awan, A. G. & Yaseen, G. Global climate change and its impact on the agriculture sector in Pakistan. Am. J. Trade Policy 4, 41–48. https://doi.org/10.18034/ajtp.v4i3.425 (2017).
Rasul, G., Chaudhry, Q. Z., & Zahid, M. Climate change in Pakistan: Focused on Sindh province. Pakistan Meteorological Department. (2012).
Ali, G., Shah, S. M. M. & Rasul, G. Climate change and its impacts on agriculture and food security in Pakistan. J. Environ. Stud. 19(3), 231–245 (2017).
Greenpeace. Climate change effects on agriculture. (2008).
Smith, R., Brown, L. & Taylor, M. Temperature-induced changes in soil structure and their impact on plant growth. J. Clim. Agric. 12(4), 223–235 (2021).
Aurbacher, J., Lippert, C., & Kirmly, T. Assessing the impact of climate change in agriculture in Germany—A Ricardian analysis. International Agricultural Trade Research Consortium (IATRC). (2010).
World Bank Climate Data. Climate data for development and resilience. (2022).
Tubi, A., McAllister, R. R. & Ayre, M. Climate variability and agricultural adaptation: The role of water management in sustaining crop yields under changing humidity and temperature conditions. PLoS ONE 18(5), e0284732 (2023).
World Bank. Pakistan Floods 2010: Damage and needs assessment. (2023).
Asian Development Bank Institute. Climate change in Asia and the Pacific: How Can Countries Adapt? (2012).
Schneider, M. et al. Strategies for temperature stress mitigation in wheat farming. Agric. Syst. 194, 1032 (2021).
Mitchell, T. D. & Jones, P. D. An improved method of constructing a database of monthly climate observations and associated high-resolution grids. Int. J. Climatol. 25(6), 693–712 (2005).
Khan, M. A., Gul, A. & Jan, D. Impact of climate change on wheat and maize yield in northern Pakistan. J. Agric. Environ. Sci. 9(3), 113–128. https://doi.org/10.30845/jaes.v9n3a1 (2020).
Abbas, A. et al. Agroforestry: A sustainable environmental practice for carbon sequestration under the climate change scenarios—A review. Environ. Sci. Pollut. Res. 26(12), 11661–11671. https://doi.org/10.1007/s11356-019-04649-6GoogleScholar (2019).
Shah, M. M., Hussain, S. & Rahman, M. Climate change and its impacts on crops in Pakistan: A regional assessment. Pak. J. Agric. Sci. 51(2), 329–334 (2014).
Salma, S., Rehman, S. A. & Shah, M. A. Rainfall trends in different climate zones of Pakistan. Pak. J. Meteorol. 9(17), 37–47 (2012).
Ahmad, N. & Shah, S. Impact of soil types on crop productivity in Upper Dir, Pakistan. Int. J. Agric. Sci. 11(2), 145–153 (2019).
Ali, M., Khan, N. & Zaman, R. Impact of temperature variability on wheat yield in Pakistan’s rainfed regions. Pak. J. Agric. Sci. 57(1), 45–52 (2020).
Ahmed, F. & Khan, Z. Return period analysis of extreme climatic events in Pakistan: Implications for risk management. J. Environ. Sci. 18(4), 95–112 (2021).
Zafar, S. & Rehman, M. Climatic variability and its impacts on agriculture in Northern Pakistan. J. Clim. Stud. 19(3), 123–138 (2022).
Miandad, M. et al. Land use and land cover changes in Abbottabad. J. Bio Environ. Sci. (2020).
Rehman, F. U. & Ahmad, E. The effect of climate patterns on rice productivity in Pakistan: An application of Driscoll and Kraay estimator. Environ. Sci. Pollut. Res. 29(35), 53076–53087 (2022).
Ali, S., Ahmed, S. & Khan, M. Deforestation and climate dynamics in northern Pakistan: A case study of KPK. Sustainability 15(3), 789–800 (2023).
Raza, S., Khan, A. & Babar, M. Land use and land cover changes in northern Pakistan: Implications for agriculture and forestry. Remote. Sens. Appl.: Soc. Environ. 21, 100467. https://doi.org/10.1016/j.rsase.2021.100467[ScienceDirect] (2021).
Bibi, S. et al. Climatic Shifts and their Effects on Agriculture in Khyber Pakhtunkhwa. Pak. Agric. J. 34(4), 123–135 (2019).
Ahmed, S. et al. Climatic variability and water resource management in Swat. South Asian Environ. Stud. 22(1), 56–71 (2020).
Bakker, J. C. Rainfall patterns and flood risks in South Asia. Environ. Sci. Policy 13(2), 109–118 (1991).
Global Climate Data Initiative. Climate change and agricultural impacts in South Asia. (2023).
Douville, H. et al. Water cycle changes. In Climate Change 2021: The Physical Science Basis (eds Masson-Delmotte, V., Zhai, P., Pirani, A. et al.) 1055–1210 (Cambridge University Press, 2021). https://doi.org/10.1017/9781009157896.010.
Pakistan Meteorological Department. Climate data analysis of Pakistan: Humidity trends. (PMD, Islamabad, 2020).
Abid, M., Scheffran, J., Schneider, U. A. & Ashfaq, M. Farmers’ perceptions of and adaptation strategies to climate change and their determinants: The case of Punjab province, Pakistan. Earth Syst. Dyn. 7(1), 225–243 (2016).
Javed, M. et al. Impacts of Seasonal temperature variability on crop growth in the Northern Regions of Pakistan. Agric. Sci. J. 13(4), 256–267 (2021).
Sami, S. et al. The effect of temperature changes on crop yields and water stress in Pakistan. Environ. Clim. Chang. 7(2), 45–60 (2018).
Tahir, M. et al. Heat stress and crop yields: Adaptive strategies for Pakistan’s Agriculture. J. Environ. Sci. Technol. 15(3), 320–334 (2020).
Khan, R. et al. Extreme temperature events and their impact on agriculture in Pakistan: A case study. Clim. Chang. Res. Lett. 12(4), 114–129 (2019).
Khan, R. et al. Long-term temperature trends and agricultural implications in the Northern Areas of Pakistan. Agric. Clim. Chang. J. 10(2), 142–157 (2022).
Xiao, X., Zhang, Y., & Liu, J. Land surface temperature dynamics in Guizhou, China. Remote. Sens. Environ. (2020).
Arshad, A., Taj, A. K. & Sajjad, A. Analysis of climate change data of Khyber Pakhtunkhwa, Pakistan. Int. Res. J. Eng. Technol. 5, 2021–2027 (2018).
Acknowledgements
Funding Declaration This research work was funded by Umm Al-Qura University, Saudi Arabia, under grant number: 25UQU4300304GSSR06.
Author information
Authors and Affiliations
Contributions
R.K. wrote the main manuscript text, performed data analysis, conducted data collection, and self-financed all research work. A.S.A.A. reviewed the manuscript, contributed to paper structure, and assisted with data analysis. A.A. prepared graphs and tables and contributed to manuscript review. M.M.H. reviewed the manuscript and improved the scientific methodology. M.R. reviewed the manuscript and corrected grammar mistakes. W.U.R. assisted in manuscript review and refinement during the write-up stage. A.M. reviewed the manuscript and provided guidance on data collection. M.N.K. contributed to data collection and manuscript review. R.A. acted as co-supervisor, contributing to research design and supervision. A.R.G. served as the primary supervisor, providing overall supervision, thesis guidance, and critical revisions. All authors reviewed and approved the final version of the manuscript.
Corresponding author
Ethics declarations
Competing interests
The authors declare no competing interests.
Additional information
Publisher’s note
Springer Nature remains neutral with regard to jurisdictional claims in published maps and institutional affiliations.
Rights and permissions
Open Access This article is licensed under a Creative Commons Attribution-NonCommercial-NoDerivatives 4.0 International License, which permits any non-commercial use, sharing, distribution and reproduction in any medium or format, as long as you give appropriate credit to the original author(s) and the source, provide a link to the Creative Commons licence, and indicate if you modified the licensed material. You do not have permission under this licence to share adapted material derived from this article or parts of it. The images or other third party material in this article are included in the article’s Creative Commons licence, unless indicated otherwise in a credit line to the material. If material is not included in the article’s Creative Commons licence and your intended use is not permitted by statutory regulation or exceeds the permitted use, you will need to obtain permission directly from the copyright holder. To view a copy of this licence, visit http://creativecommons.org/licenses/by-nc-nd/4.0/.
About this article

Cite this article
Khan, R., Alwabel, A.S.A., Ahmad, A. et al. Assessment of climatic parameter variation and its impact on sustainable agriculture in Dir Upper Pakistan with mitigation and adaptation strategies. Sci Rep 16, 9576 (2026). https://doi.org/10.1038/s41598-025-24940-6
Received:
Accepted:
Published:
Version of record:
DOI: https://doi.org/10.1038/s41598-025-24940-6
