
Abstract
Cultured meat is an attractive concept to address environmental and ethical issues of livestock farming. Replication of conventional meat requires fat tissue, for flavour, texture, and mouthfeel. However, cultured meat production is limited by the lack of bovine adipogenic cells that are both proliferative and differentiable. Here, we demonstrate the isolation and characterisation of spontaneously immortalised bovine preadipocytes proliferating over 100 days and 21 passages, showing adipogenic differentiation. Upon induction, the cells accumulate lipids and express key adipogenic markers. Comparative RNA sequencing and proteomic analysis between induced and non-induced cells confirmed bovine origin, cell identity, and low tumour suppressor expression. Proteomic profiling identified over 2000 proteins, with enrichment in adipogenesis-associated pathways, including PPAR signalling and the ERK1/2 cascade. Additionally, the cells demonstrate viability in suspension and strong scaffold attachment. These results establish a reproducible bovine cell source for cultured fat supporting scale-up and bioprocess research in cellular agriculture.
Introduction
Cellular agriculture is an innovative technology focused on producing animal products, such as meat, dairy, and leather, through cell cultivation rather than through traditional farming. Using techniques such as tissue culture and bioengineering, the field is making progress to create materials that are biologically equivalent to those derived from animals for food production. This approach has the potential to reduce the environmental impacts of agriculture, including greenhouse gas emissions and land use1. Cellular agriculture also offers ethical advantages by minimising the need for animal slaughter. With advancing technology readiness, it could play a role in addressing global food security and sustainability challenges. For successful production of cultured meat, it is essential to establish rapidly expanding cell lines and to develop low-cost nourishing media2,3,4,5,6. Moreover, the process requires the creation of biological scaffolds that support cell growth7,8,9. It is critical that laboratory-scale fundamental research emphasises these aspects to facilitate the scaling-up process.
Although most research on cell-cultured meat focuses primarily on muscle cells, fat tissue is also a vital component. Fat not only provides key nutrients but also plays a significant role in determining the meat’s flavour, texture, and tenderness, which are major factors influencing consumer preferences10,11,12,13. A key challenge in producing cell-cultured fat is identifying a seed cell that can proliferate stably, i.e., maintain consistent growth over multiple passages without senescence, while retaining strong adipogenic potential. Since adipocytes are terminally differentiated and no longer capable of dividing, primary adipogenic cells are commonly used in cultured meat research13,14. However, their adipogenic efficiency and proliferation capacity tend to decline with increasing passages, which limits their usefulness in fat tissue research and large-scale production13. Immortalised preadipocytes that can maintain their proliferative and differentiation capacity have been developed but mainly from rodents and avians15,16. Several bovine17,18,19 and porcine13,20,21,22,23 cell lines with adipogenic potential have been reported to maintain proliferation over 30 passages. Additionally, these preadipocytes can be differentiated into adipocytes by using a classic cocktail (including dexamethasone (DEX), insulin, 3-isobutyl-1-methylxanthine (IBMX), and rosiglitazone) or a fatty acid cocktail24. Adipocyte differentiation is a complex biological process controlled by transcription factors, signalling pathways, hormones, and various other regulatory molecules. Molecules and pathways such as Peroxisome proliferator-activated receptor-γ (PPARγ)25, CCAAT/enhancer-binding protein-α (CEBP/α)26, Wnt (wingless-type MMTV integration site) signalling pathway27, MAPK (mitogen-activated protein kinases) signalling pathway28 and multiple microRNAs (miRNAs) have been associated with adipogenesis in these cells17. However, most of the established preadipocyte cell lines have relatively low adipogenic efficiency13, that is, the ability of preadipocytes to differentiate into a mature adipocyte-like cell. Thus, a highly adipogenic immortal bovine cell line will be desirable for these cells to be used in cell-cultured fat.
The present study establishes a protocol for isolating and characterising bovine preadipocytes in vitro and for culturing them in suspension and on a scaffolding material. RNA sequencing and proteomics results show novel genes and proteins associated with adipogenesis. Together the data provides a deeper understanding of bovine preadipocytes and how these cells can be used to engineer cultured meat.
Results
Growth and expansion of preadipocytes
To monitor the growth of preadipocytes, the cells were tracked using phase contrast microscopy with the Incucyte S3 Live-Cell Imager (Fig. 1). Preadipocytes were successfully expanded from single cells and developed fusiform or triangular projections when cultured on a 6-well plate for expansion. As the cells reached 70–80% confluence, their morphology began to resemble fibroblast-like, which is characteristic of preadipocytes17. They were expanded successfully over 100 days and 21 passages; the cell doubling times were also monitored (Fig. 1E), where the average doubling time was recorded as 43.9 h, and the confluence percentage was recorded via microscopy (Fig. 1D). The physical appearance of the cells at days 1, 50, and 100 is shown in Fig. 1A–C, revealing that the cells maintained a preadipocyte-like morphology throughout.
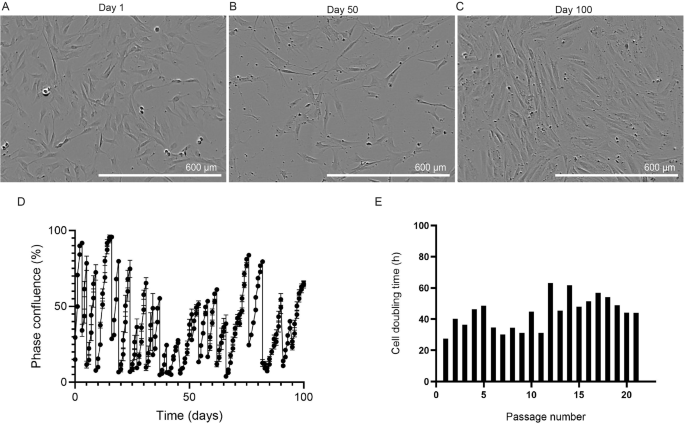
Phase contrast images of the isolated cells following A 1, B 50 or C 100 days of culture within an Incucyte S3 live cell imaging instrument. Scale bars = 600 μm. D Degree of cell confluence over 100 days of cell culture and 21 independent passages of the bovine preadipocytes. The degree of cell confluence, “phase confluence (%)”, was determined by the internal software of an Incucyte S3 live cell imager, which performs densitometry on phase contrast images acquired over the 100-day time course. E Cell doubling time over 21 independent passages, as calculated by the formula: doubling time = duration.ln(2) = duration x ln(2)/ln(final confluence/initial confluence). (Figure created using GraphPad Prism).
Morphological changes and lipid accumulation during adipocyte differentiation
Differentiation of preadipocytes into adipocytes has been characterised using an FFA cocktail and control cultures. In the non-induced control cultures, the cells had a preadipocyte-like appearance and did not contain lipid droplets (Fig. 2A–C). However, in the induced cells, cellular morphology changed dramatically; they present a prominent appearance and vast accumulation of lipid droplets in the cytoplasm at days five and seven (Fig. 2B, C). The cytoplasm displayed an oval or round shape of varying sizes, with bright spots forming around the nucleus. The differentiated group exhibits red-stained lipid droplets, whereas the non-induced control group shows no notable lipid staining. Intracellular lipid accumulation was also quantified using ImageJ software, which confirmed a progressive increase in Oil Red O (ORO) intensity, supporting the visual observation of enhanced adipocyte differentiation (Supplement Fig. 1, figure created using GraphPad Prism).

A–C Phase contrast images of preadipocytes without FFA cocktail (control) and with FFA cocktail (induced) for differentiation over the span of 3, 5, and 7 days, respectively (scale bars = 20 μm). The lipid accumulation inside the induced cells is evident and is stained red by ORO, whereas in controls, no lipid accumulation can be seen, and therefore no staining occurs. As the incubation period increases from Day 3 (A) to Day 7 (C), the lipid droplets also increase in size and number.
RNA-seq confirms species and tissue identity of the cells
To validate the origin and identity of the established cells, RNA sequencing was performed comparing induced and non-induced bovine preadipocytes. It was found that 97.5% of reads sequenced were classified as Bos taurus using Kraken2, verifying that the isolated cells are of bovine origin. The adipogenic nature of these cells was confirmed with canonical markers, including CCAAT enhancer binding protein beta (CEBPB)29, KLF transcription factor 6 (KLF6)30, fibroblast growth factor 10 FGF10)31, and scavenger receptor class A member 5 (SCARA5)32, consistent with the expected gene expression profile of adipogenic progenitor and adipocyte cell types (Table 1). Additionally, high expression of ribosomal proteins, translation elongation factors (EEF1A1, EIF1, RPL and RPS family genes), and mitochondrial genes suggests a metabolically active and proliferative phenotype33,34. Known housekeeping genes such as glyceraldehyde-3-phosphate dehydrogenase (GAPDH), actin beta (ACTB), and actin gamma 1 (ACTG1) showed stable expression across conditions, indicating transcriptomic integrity and comparability between samples.
RNA-seq data also revealed that expression of tumour suppressor genes, including cyclin-dependent kinase inhibitor 2A (CDKN2A, 58.0 TPM), RB transcriptional corepressor 1 (RB1, 16.7 TPM), and tumour protein p53 (TP53, 36.3 TPM) was markedly low, especially in comparison to housekeeping genes (GAPDH, 1547.2 TPM), suggesting possible attenuation of these checkpoint controls35. Telomerase reverse transcriptase (TERT) expression was absent, and ATRX chromatin remodeler (ATRX, 28.8 TPM) and death domain-associated protein (DAXX, 30.9 TPM), key regulators of the Alternative lengthening of telomeres (ALT) pathway, were expressed at low levels. This suggests that if telomerase maintenance is occurring, it is likely via an alternative mechanism, not strictly driven by canonical telomerase or ALT pathways. The RNA-seq data is made publicly available on the SRA database (https://www.ncbi.nlm.nih.gov/sra) under Bioproject ID PRJNA1179665.
Proteomics reveals key protein regulation and pathways associated with adipogenesis
To further identify proteins that are associated with adipogenesis in these cells, proteomic analysis was performed. Mass spectrometric analysis identified 2039 proteins after removal of proteins with two or more missing values in either group after data normalisation. In total 470 proteins have been mapped (233 downregulated and 237 upregulated) that had statistically significant fold-changes of >20% (log2 fold-change 0.263 and q-value < 0.05) in differentiated adipocytes versus preadipocytes (control) (Fig. 3A). Table 2 shows the list of top 10 most significantly upregulated and downregulated proteins. Overall, proteomic data revealed the upregulation of mitochondrial proteins such as NADH dehydrogenase (ubiquinone) 1 beta subcomplex subunit 4 (NDUFB4) and enzymes like carotenoid-cleaving dioxygenase (BCO2). While these are associated with cellular metabolism, their increased abundance may reflect the metabolic shift required to support lipid biosynthesis and energy-intensive adipogenesis. To assess if any Gene Ontology (GO) terms previously associated with adipogenesis were enriched in the proteomic dataset, statistically significant proteins with upregulated log2 fold-change were analysed using Fisher’s exact test. One enriched GO term (Table 3) was related to the positive regulation of ERK1 and ERK2 cascade, which has been established with adipogenesis36. For enriched KEGG pathways, upregulated proteins with a log2FC > 1 proteins (q < 0.05) were associated with known pathways associated with adipogenesis and adipocytes including the Notch signalling pathway, cholesterol metabolism, and PPAR signalling pathways (Fig. 3B). Interestingly, the proteomics data provided independent support for ALT, as homologous recombination emerged as one of the top-enriched pathways. Upregulation of replication protein A1 (RPA1; log2FC > 1, q < 0.05), which is involved in homologous recombination, suggests a possible role for DNA repair mechanisms in the spontaneous immortalisation of these cells. Although canonical ALT regulators, such as ATRX and DAXX, were not strongly expressed at the transcript level, and TERT was absent, the enrichment of homologous recombination at the protein level indicates potential activation of a telomerase-independent telomere maintenance mechanism. The mass spectrometry proteomics data have been submitted to the ProteomeXchange Consortium through the PRIDE partner repository with the dataset identifier PXD05746837.

A Volcano plot showing 2039 proteins when a comparison was made between non-induced and induced preadipocytes, out of which 459 proteins had statistically significant q-value of less than 0.05. The non-significant proteins (q-value < 0.05) are shown in black; the significant proteins (q-value > 0.05) with a fold change greater than 1 are represented in dark blue, while those with a fold change less than 1 are shown in light blue. B The bar graph shows enriched KEGG pathway results generated through the WebGestalt database with p-values lower than 0.05 indicated through an asterisk (*). The significant pathways are further listed with the specific genes that were associated. (NOTCH1 notch receptor 1, NUMBL NUMB like endocytic adaptor protein, APOB apolipoprotein B, APOC3 apolipoprotein C3, CYP27A1 cytochrome P450 family 27 subfamily A member 1, SCD stearoyl-CoA desaturase). (Fig. 3B created using GraphPad Prism).
Successful suspension and viability of preadipocytes in spheroid formation
Preadipocytes were successfully grown in suspension as a spheroid culture over the period of seven days by using low-attachment plates. Microscopic examination demonstrated the spheroid formation of preadipocytes (Fig. 4A–C) and that they maintained healthy and normal morphology. The cells were shown to be viable through confocal images using a Live/Dead assay (Fig. 5a–f), where the live cells fluoresce green, and the dead cells fluoresce red. This verifies that these adherent cells can be grown in suspension without affecting their viability. Further viability of the cells in spheroids was also confirmed using a CTB assay over 1, 5 and 7 days (Fig. 4D).

A–C Phase contrast images of bovine preadipocytes were taken on Days 1, 5 and 7, respectively (scale bar = 5 μm). D Cell viability was assessed over days 1, 5 and 7 through CTB assay. The images represent one spheroid from one well out of triplicates. (C created using GraphPad Prism).

a–f Compilation of confocal microscopy images (z-stack) showing spheroid viability, the live cells fluoresce green, and the dead cells fluoresce red after seven days (scale bar = 50 μm). The images here represent one spheroid from one well out of triplicates, and multiple images were taken from various optical planes to characterise the 3D spheroid. Arrows in (f) point towards a dead cell fluorescing red and a live cell fluorescing green.
Growth of preadipocytes on scaffold
Preadipocytes were seeded onto Fibra-Cel® disks (Eppendorf) in bioreactor tubes and quantified later using CTB and BCA assay. Total cellular protein (BCA) analysis (Fig. 6G) agreed with the CTB data (Fig. 6H). SEM was performed after one month to assess the attachment, growth, and differentiation of preadipocytes within the scaffold, compared to an unseeded scaffold serving as the control. Following incubation under differentiation conditions for three days, cells were observed to adhere uniformly to the scaffold (Fig. 6C–F), spreading into a monolayer-like characteristic (Fig. 6A, B). The cells successfully expanded in a network-like construction and can also be seen elongating and stretching over the area, forming bridges. As the differentiation period was short, no morphological change was observed between the induced and non-induced preadipocytes.

The coloured SEM images showed control (A, B) and differentiated preadipocyte adhesion on the fibres of the Fibra-Cel® scaffold (C–F). The Fibres of the scaffold are coloured yellow, and the cellular bodies are coloured pink, and images were taken at different magnifications: A 200×, B 500×, C 250×, D 600×, E 600×, and F 1800×. Quantification of the cellular material adhered to the scaffold showed the efficiency of the Fibra-Cel® disks. Scaffolds with preadipocytes seeded and differentiated in addition to controls (with no cells seeded, used for background quantification) were maintained over 30 days and later assessed through CTB and BCA assay (E, F). (G and H created using GraphPad Prism).
Discussion
The work presented describes the successful isolation and characterisation of bovine preadipocytes derived from subcutaneous bovine fat tissue, and their ability to grow in suspension as spheroids and on commercially available scaffolds. First, it is shown that progenitor adipocyte cells can be isolated effectively in a reproducible method and expanded over multiple passages. RNA sequencing confirmed their bovine origin and adipogenic identity. Both RNA-seq and proteomic analyses were performed to compare gene and protein expression profiles between induced and non-induced preadipocytes, increasing our understanding of adipogenesis in preadipocytes undergoing induction. Distinctively, this study provides one of the few comprehensive transcriptomic and proteomic analyses of bovine preadipocytes. The RNA-seq dataset showed negligible contamination from non-bovine sources, with over 97.5% of reads mapping to Bos taurus, supporting the origin of the cells. Regarding cellular purity, the transcriptomic data revealed the presence of adipogenic markers characteristic of preadipocyte and adipocyte cell types, thereby reinforcing the identity and functionality of the isolated cells. Elevated expression of ribosomal proteins, mitochondrial genes, and translation-related factors reflects a metabolically active and proliferative state, which is expected in early-stage preadipocytes undergoing expansion. Interestingly, expression levels of tumour suppressor genes, including CDKN2A, RB1, and TP53, were markedly lower than housekeeping controls, suggesting a potential relaxation of cell cycle checkpoint mechanisms in these cells. While transcriptomic data did not show elevated expression of canonical telomere maintenance genes such as TERT, ATRX, or DAXX, proteomic analysis revealed enrichment of the homologous recombination pathway, including upregulation of RPA1, suggesting possible engagement of recombination-based telomere maintenance mechanisms. This provides independent support for a telomerase-independent route of spontaneous immortalisation in these bovine preadipocytes. Notably, despite extended proliferation, these cells retained adipogenic differentiation capacity at later passages. While the precise mechanisms remain to be elucidated, this may reflect a lineage-specific stability, whereby spontaneous immortalisation preserves core transcriptional programs required for preadipocyte identity. The enrichment of homologous recombination pathways and upregulation of RPA1, consistent with recombination-based telomere maintenance, could contribute to prolonged proliferative lifespan while maintaining differentiation potential. Together, these features suggest that spontaneous immortalisation in bovine preadipocytes may confer both extended growth and preservation of adipogenic competence. Beyond this, the proteomic analysis identified over 2000 proteins, with significant differential abundance between induced and non-induced cells, highlighting metabolic and signalling pathways relevant to adipogenesis. Pathways such as Notch signalling, cholesterol metabolism, and PPAR signalling were enriched in differentiated cells, aligning with known mechanisms of adipocyte maturation. Out of the most upregulated and downregulated proteins, the proteins that stand out are NDUFB4, BCO2, and Large ribosomal subunit protein uL16m proteins (MRPL16), which are linked to mitochondrial function.
It has been reported that many (about 10%) genes associated with adipogenesis are mitochondrial genes38. Plexin A1, associated with adipogenesis in duck preadipocytes39, NUMB-like protein, which enhances adipocyte differentiation40, and Syndecan, which regulates adipogenesis41, were also significant in our analysis. Additionally, the ERK1/ERK2 pathway (GO:0070374) was regulated, as shown by the GO analysis. This pathway has been associated with adipogenesis by enhancing PPARγ and CEBP/α gene expression36. This identification of upregulated mitochondrial and translational machinery components further supports the proliferative and metabolically active phenotype seen at the transcript level. Key genes that were upregulated in both the transcriptomic and proteomic dataset include fat storage-inducing transmembrane protein 2 (FITM2)42, neuropilin (NRP1)43, aldehyde dehydrogenase 1A1 (ALDH1A1)44 and acyl-CoA thioesterase 13 (ACOT13)45, which are all activated in adipogenesis. Similarly, genes that were commonly downregulated at the RNA and protein level included cell migration inducing hyaluronidase 1 (CEMIP)46 and inositol polyphosphate phosphatase-like protein 1 (INPPL1)47, which are known inhibitors of adipogenesis and insulin signalling pathway. Taken together, these proteomic findings complement the RNA-seq data, providing a layered view of the molecular landscape during bovine adipogenesis. However, a complete molecular profiling at additional passages would provide deeper insight into long-term stability for future investigations.
Second, we demonstrate the ability of the cells obtained to differentiate using an FFA adipogenic cocktail, which was characterised by the accumulation of lipid molecules, which were stained using ORO. The use of an FFA cocktail instead of a traditional cocktail containing IBMX, dexamethasone, insulin, and rosiglitazone was employed in this study as it presents a food-compatible strategy for adipogenic induction, since unsaturated and branched-chain fatty acids can act as natural agonists of PPAR-family transcription factors48,49,50,51,52. Although ORO quantification via absorbance measurement is commonly used to assess lipid accumulation, in our study, the absorbance values did not effectively discriminate between varying levels of adipocyte differentiation. This limitation may be due to background interference, uniform dye retention, or well-to-well variability, highlighting the challenges of using absorbance-based methods for precise quantification in this context. Therefore, we relied on quantitative analysis using ImageJ to assess the ORO intensity of intracellular lipid accumulation, in conjunction with RNA-seq and proteomic analyses, to confirm adipogenesis.
Third, we demonstrate the ability of the cells to be grown in suspension as spheroid culture and on a scaffold. The low-attachment plates helped the cells bind to Collagen I (ECM) and expand in a spheroid formation. The cells took about seven days to form circular spheroids, and their viability was established through Live/Dead and CTB assays. This method is beneficial for growing adherent cells in suspension and can also be used to test media or other growth conditions as they form a 3D structure without a scaffold. This observation opens avenues for co-culturing different cells and for testing their ability to expand in suspension. Further, we established their ability to grow on a Fibra-Cel® scaffold in 50 ml bioreactor tubes. This network-like environment of the scaffold allowed the cells to successfully attach and expand, and therefore, in future, this approach can be considered for scaling up in a packed bed bioreactor. The SEM images show how the cells are forming bridges across adjacent scaffold fibres and how they are expanding, indicating the scaffold’s biocompatibility for scaling up. Although no morphological change was observed between the induced and non-induced preadipocytes, it was observed (through CTB and BCA assays) that induced cells had better attachment on the scaffold. This may be attributed to cytoskeletal remodelling during adipogenesis, which enhances cell spreading and adhesion. Also, differentiated adipocytes may produce extracellular matrix components, such as collagen, fibronectin, and laminin, which promote stronger interactions with the scaffold, facilitating stable cell attachment and growth53,54,55,56. We acknowledge that further quantification of cell viability, proliferation, and differentiation efficiency within spheroid and scaffold cultures is needed. While viability was confirmed using Live/Dead and CTB assays, and scaffold attachment was validated through CTB and BCA assays, additional analyses would strengthen these findings. Future work will focus on assessing metabolic activity, gene expression, and lipid accumulation to better characterise cell behaviour in 3D cultures. It will also include a direct comparison of differentiation efficiency between scaffold-based and spheroid culture conditions to further optimise their application in cellular agriculture.
Throughout this study, we have addressed the persistent problem in the field of cellular agriculture, to obtain suitable primary cells with high proliferative capacity. Although preadipocyte isolation protocols exist, our method provides a reproducible approach to obtaining spontaneously immortalised bovine preadipocytes without requiring transfection or genetic manipulation, which is desirable for the cellular agriculture framework. Significant progress has been made in understanding the molecular mechanisms involved and identifying ideal cell types, such as fibroblasts5,8. Natural immortalisation not only addresses ethical concerns but also complements5,8 bioreactor technology, improving the scalability and commercialisation of cultured meat. It should also be noted that long-term stability is a key factor in determining the feasibility of preadipocyte cell lines for cultivated fat production. In our study, preadipocytes demonstrated sustained proliferative capacity over 100 days and 21 passages. Additionally, their ability to efficiently differentiate into lipid-accumulating adipocytes further supports their suitability for large-scale applications. We acknowledge that minor fluctuations in doubling time were observed, but no sustained increase occurred over time. This initial proliferation study was conducted immediately after cell isolation, which may have contributed to a longer doubling time due to cellular adaptation. Despite this the doubling time remained within a range of ~30–65 h, with an overall average of 43.9 h. These results support the notion that the isolated cell line is robust and capable of long-term propagation, although further genomic stability testing is warranted to confirm suitability for commercial-scale applications. Future studies should focus on optimising culture conditions to enhance proliferation rates, yield, and scalability, while also comparing their performance directly with established models.
We have also demonstrated the growth of these cells on Fibra-Cel® disks as they can be used for scaling up in bioreactors57. We understand that using these disks is not ideal as compared to food grade biological scaffolds, but it will help to advance the research at laboratory-scale. FBS was used throughout the entire process of isolation and differentiation as it is crucial during the early stages of isolation, particularly over the first few passages, before transitioning any cells to a serum-free medium. Although the current cells still rely on serum, the next step is to adapt them to a serum-free environment. Recently our team indicated that plant-based hydrolysates could be valuable components in formulating serum-free media2. We have also previously demonstrated that bovine fibroblasts can be isolated and naturally immortalised, and the next steps will also involve co-culturing them together8.
The study recognises that food research must align with regulatory guidelines governing cellular agriculture. Therefore, we have discussed key limitations, including genetic stability, the elimination of animal-derived components, and verifying lipid composition to match conventional meat. The aim of this study was to establish a standardised protocol for bovine cell isolation and characterisation, though we recognise that further work is needed to assess the safety and nutritional quality of the resulting adipocytes. As regulatory approval pathways for cultivated fat continue to evolve, ongoing engagement with food safety authorities will be crucial for commercialisation.
In summary, we established a process of isolating bovine preadipocytes and their ability to differentiate into adipocyte-like cells. We determined the significant proteins and GO functions associated with these cells when differentiated. In addition, we showed that these cells grew in suspension and on a scaffold. Our findings are expected to provide an in-depth study on the regulation of bovine preadipocytes and how they can be used further in cellular agriculture.
Methods
Isolation of bovine preadipocytes
Subcutaneous fat tissue was obtained from the exterior hind leg of a Black Angus domesticated male cow (Bos taurus) and cleaned using a method previously described8. The fat tissue was briefly rinsed with isotonic saline and transferred on ice into DMEM supplemented with 10% serum, Penicillin (10 U/mL), Streptomycin (10 mg/mL), and Amphotericin B (2.5 mg/mL). Subsequently, the tissue was processed according to a modified protocol from Post et al.48. After washing with phosphate buffered saline (PBS) and removing any non-fat tissue, ~1 g of fat was finely minced with a scalpel, rinsed with leftover DMEM, and transferred into a gentleMACS C-tube containing DMEM with 0.1% w/v collagenase II. The sample was digested at 37 °C for 60 min using a gentleMACS Octo Dissociator (Miltenyi Biotec) to create a cell suspension. After digestion, 20% (v/v) foetal bovine serum (FBS) was added to the suspension, and the mixture was filtered through sterile nylon filters with 400 µm pore size. The filtrate was centrifuged (5 min, 450 × g) to wash and pellet the cells. The cell pellet was washed once with DMEM, then resuspended in complete growth media (DMEM supplemented with FBS (20% v/v) and 1 ng/mL FGF-Basic and antibiotics - Penicillin (10 U/mL); Streptomycin (10 mg/mL); Primocin (100 mg/mL; Invivogen CA, USA) and transferred in 96-well plates. Cells were permitted to attach overnight (37 °C/5% CO2). Wells that were visually confirmed to contain single colonies were expanded and used in this study.
Cell expansion and passaging using live-cell imaging
Cell expansion of preadipocytes was performed by seeding 1 × 10⁵ cells per well in a 6-well plate in triplicate. Growth was monitored over a period of 100 days and 21 passages using phase-contrast microscopy, with observations made through the Incucyte S3 Live-Cell Analysis System (Sartorius, Göttingen, Germany). FBS in the media composition for these cells was changed to 10% v/v. Phase contrast images were taken every 12 h, and confluence was measured by densitometry using the Incucyte software, applying a segmentation adjustment of 1.2. The cell doubling time was calculated using the standard formula: doubling time = duration × ln(2)/ln(final confluence/initial confluence). Confluence values were obtained using the Incucyte S3 Live-Cell Analysis System software, applying the previously mentioned settings.
Differentiation to mature adipocytes
Preadipocytes at culture passage #25 were seeded at 1 × 10³ cells/cm3 on 12-well plates in DMEM with 10% FBS. The following day, the medium was switched to adipogenic induction medium, a free-fatty-acid (FFA) cocktail. The FFA cocktail was composed of Elaidic, Oleic, Myristoleic, Palmitoleic, Erucic, and Phytanic fatty acids (at 50 µM each) in complete DMEM-high glucose (i.e., with 2mM L-glutamine, 100U/ml penicillin, 100 µg/ml streptomycin, and 10% FBS). After three days, the medium was switched to adipogenic maintenance medium, composed of complete DMEM-high glucose supplemented with 10 µg/ml insulin. Treatment with adipogenic maintenance medium was extended until day seven. Control cultures were grown in complete DMEM-high glucose without any other adipogenic supplements. Media was changed every two days.
Oil Red O staining
Lipid accumulation in differentiated adipocytes and control cultures was assessed by using ORO staining. Initially, the cells were rinsed twice with PBS, followed by a 15 min fixation at room temperature in 4% paraformaldehyde prepared in distilled water. Post-fixation, cells underwent two additional PBS washes before being stained for 30 min with a filtered 0.3% ORO solution (diluted from 0.5% ORO solution in isopropanol from Sigma-Aldrich). Cells were then rinsed twice with PBS, each rinse lasting 1 min. The absorbance of the extracted ORO using isopropanol was measured at 492 nm using a CLARIOstar microplate reader. Lipid accumulation was quantified by measuring the integrated density of ORO-stained areas using ImageJ software (https://imagej.net/ij/).
RNA sequencing
Total RNA was extracted from these differentiated adipocytes and control cultures at passage #25 using the TRIzol reagent (Invitrogen, USA) following the manufacturer’s instructions. RNA sequencing (RNA-seq) libraries were prepared using the Illumina stranded mRNA library prep kit and sequenced on an Illumina NextSeq 1000 System (2 × 150 bp) by the Ramaciotti Centre for Genomics (UNSW Sydney, Australia). The FASTQ reads from RNA-seq were quality-checked using FASTQC (version 0.11.9) (Babraham Institute in Cambridge) and Seqmonk (version 1.48.1) (Babraham Institute in Cambridge). To confirm that the reads were from Bovine origin/source, they were taxonomically classified using kraken2 against a custom database containing bovine, human and mouse reference genomes. To quantify expression, reads were then mapped and aligned to the Bos taurus reference genome sequence (ARS-UCD1.3) using Salmon (version 1.10.2). The raw transcriptomic counts were then normalised using Transcripts per million (TPM) units for gene expression analysis. Canonical markers specific to the adipocyte cell type were then matched using the PanglaoDB database58.
Proteomics analysis
Protein analysis was performed on the same differentiated adipocytes and control cultures (in triplicates) at passage #25 using the Mass Spectrometry facility at the Australian Proteome Analysis Facility (APAF). Briefly, 50 µg of protein per sample were prepared for trypsin digestion. For each sample, volumes were normalised with 100 mM TEAB and 1% sodium dodecyl sulfate (SDC). Disulfide bonds were reduced with DTT (10 mM) at 60 °C for 30 min, followed by alkylation with IAA (20 mM) in the dark at room temperature for 30 min. Proteins were then digested with trypsin (1:25 enzyme-to-protein ratio) for 16 h at 37 °C. Post-digestion, peptides were acidified with 1% formic acid, desalted using Stage-Tip purification and dried via vacuum centrifugation. The dried peptides were reconstituted in 0.1% formic acid and loaded onto the peptide trap (C18 PepMap 100, 5 μm, 100 Å, 300 μm × 5 mm, Thermo Fisher), which was then switched in line with the analytical nano-LC column (UltiMate 3000, Thermo Fisher). Peptides were eluted from the trap onto the nano-LC column and were separated with a stepped gradient of 2% mobile phase B to 8% mobile over 1 min, then 8 to 25% in 87 min, followed by 25–40 min in 5 min at a flow rate of 300nL/min, and lastly 95% mobile phase B for 10 min. The column eluent was directed into the ionization source of the Q-Exactive HF-X mass spectrometer (Thermo Fisher) operating in positive ion and data independent acquisition (DIA) mode. Using collisional induced dissociation, DIA was performed using a resolution of 30,000 at 200 m/z, spanning a range from 395 to 1005 m/z. LC-MS/MS raw files were analysed using DIA-NN (version 1.8.1) software with a library-free approach, utilising an in silico spectral library based on the annotated Bos taurus protein sequences from the UniProt database (March 2020 release; 37,513 entries). Normalised log2 fold change (log2FC) was calculated by comparing induced preadipocyte data with non-induced preadipocyte data, and the false discovery rate (FDR)/q-value was set at 0.05. For KEGG pathway enrichment analysis, significantly upregulated proteins (log2FC > 1) were compared against the total 2039 proteins detected from proteomics using the WEB-based GEne SeT AnaLysis Toolkit (WebGestalt)59.
Spheroid culture of preadipocytes and imaging
Preadipocyte spheroids were created using Nunclon Sphera 24-well plates (ThermoFisher) featuring a hydrophilic polymer-coated surface, that inhibits cell attachment and allows cells to expand by binding to the extracellular matrix (ECM), Collagen I. Cells at culture passage #30 were seeded in triplicates at 103 cells per well in media containing 10% FBS. On the second day, 3 mg/ml of Collagen I (Sigma Aldrich) was added to the spent medium in the wells, and media was changed as needed. Spheroids were maintained for a week before performing LIVE/DEAD® Cell Viability Assay (Molecular Probes™) to check for cell viability. Briefly, the spheroids were pipetted into new wells and then treated with an ethidium-calcein mixture, followed by a 30 min incubation at 37 °C. The spheroids were imaged using the z-stack function of a Zeiss LSM 800 confocal microscope (Carl Zeiss Microscopy GmbH, Jena, Germany), capturing a total of 6 optical sections per spheroid. Images were processed using ZEN imaging software (version 2.3, Carl Zeiss). Further viability of the spheroids over 1, 5 and 7 days was assessed through a Cell Titer Blue® (CTB) assay by incubating them in growth media containing 10% (v/v) CTB dye (Promega, WI, USA) for 4 h at 37 °C with 5% CO₂. The supernatant was collected and transferred to a black-well plate, and fluorescence (560 nm excitation/590 nm emission) was measured using a CLARIOstar Plus microplate reader (BMG Labtech, Ortenberg, Germany). GraphPad Prism 10 was used for the statistical analyses (unpaired t-test).
Preadipocyte culture on scaffold
Fibra-Cel® disks (Eppendorf) were used as scaffolds to expand and differentiate preadipocytes. The disks were packed within 50 mL Corning® mini bioreactor tubes (about 2 cm from the bottom bed was created inside the tube). Three tubes were used, one as control (no cells seeded) and two were seeded with 1 × 10⁴ preadipocytes at passage #30 every second day for a week (three seeds were performed) and maintained over 30 days in growth media with media changes every 2–3 days. After day 30, in one of the seeded bioreactor tubes, the media was changed to differentiation media (FFA) and incubated for three days. After 33 days, the tubes were gently washed three times with PBS. Three disks were randomly selected from each bioreactor tube (control, undifferentiated, and differentiated) and placed into individual wells of a 96-well plate to measure cell viability through CTB assay as described above. To calculate the total protein content of preadipocyte culture on scaffold, a Bicinchoninic Acid (BCA) assay was performed. At random, PBS washed disks (control, undifferentiated, and differentiated) were collected in triplicates and placed in a 12-well plate. Cells were solubilised in PBS containing 1% v/v TritonX-100 for an hour on a shaker at 37 °C. Afterwards, the suspension was collected in 1.5 ml microcentrifuge tubes vortexed and centrifuged at 10,000 × g for 10 min. A fixed lysate volume of 200 µl was measured according to manufacturer’s instructions. The absorbance was measured at 562 nm using a CLARIOstar plate reader. GraphPad Prism 10 was used for the statistical analyses (unpaired t-test).
Scanning electron microscopy (SEM)
Three PBS washed Fibra-Cel® disks were randomly selected from each bioreactor tube (control, undifferentiated, and differentiated) and placed into individual wells of a 24-well plate. These were then fixed overnight in 2.5% (w/v) glutaraldehyde in 0.2 M sodium phosphate buffer at 4 °C. The samples were rinsed with 0.1 M sodium phosphate buffer and fixed again in 1% osmium tetroxide in 0.2 M sodium buffer for 30 min. The samples were washed three times with 0.1 M sodium phosphate buffer and then dehydrated using a graded series of ethanol (30%, 50%, 70%, 80%, 90%, 100%). Samples were then dehydrated using increasing concentrations of Hexamethyldisilazane (HMDS) and left to air dry in a final 100% solution of HMDS. Samples were mounted onto SEM stubs, platinum coated and viewed using a Hitachi TM 4000 Plus SEM operating at 15 kV.
Greyscale SEM images were converted to colour using Adobe Photoshop (version 24.5, Adobe, CA, USA), where they were transformed into RGB format to help with visualisation. The neural filter “Colorize” was applied to add colour, with manually assigned hex codes: “f29898” for cellular material and “c9a61b” for scaffold fibres. Cellular material was easily distinguishable from the scaffold fibres due to the presence of microvilli, amorphous cellular deposits and cell filopodia. Compared to the cells, the scaffold surface was observed to have a smooth appearance under SEM, while the cellular material was rougher and less defined. For comparison, the original greyscale SEM images are included as Supplement Fig. 2.
Data availability
The RNA-seq dataset generated and analysed during the current study is publicly available on the SRA database (https://www.ncbi.nlm.nih.gov/sra) under Bioproject ID PRJNA1179665. The mass spectrometry proteomics dataset has been made available on ProteomeXchange Consortium through the PRIDE partner repository with the dataset identifier PXD057468.
References
Goswami, A. B., Charlesworth, J., Biazik, J. M., Rybchyn, M. S. & Le Coutre, J. Advances in cultured meat technology E-CHAPTER FROM THIS BOOK Cultured meat technology: an overview. https://doi.org/10.19103/AS.2023.0130.01 (2023).
Charlesworth, J. C., Jenner, A. & le Coutre, J. Plant-based hydrolysates as building blocks for cellular agriculture. Food Chem. 460, 140621 (2024).
SuperMeat Achieves Breakthrough in Cost Parity for Cultivated Chicken Production – SuperMeat. https://supermeat.com/cost-effective-cultivated-meat-production/ (2024).
Messmer, T. et al. A serum-free media formulation for cultured meat production supports bovine satellite cell differentiation in the absence of serum starvation. Nat. Food 3, 74–85 (2022).
Pasitka, L. et al. Spontaneous immortalization of chicken fibroblasts generates stable, high-yield cell lines for serum-free production of cultured meat. Nat. Food 4, 35–50 (2022).
Pasitka, L. et al. Empirical economic analysis shows cost-effective continuous manufacturing of cultivated chicken using animal-free medium. Nat. Food 5, 693–702 (2024).
Rybchyn, M. S., Biazik, J., Nunez, A. C. & Ie Coutre, J. Bacterial decellularization: non-chemical production of effective plant tissue bio-scaffolds. bioRxiv 2023 09, 559696, https://doi.org/10.1101/2023.09.27.559696 (2023).
Goswami, A. B., Rybchyn, M. S., Walsh, W. R. & le Coutre, J. Obtaining source material for cellular agriculture. Heliyon 10, e38006 (2024).
Rybchyn, M. S., Biazik, J. M., Charlesworth, J. & le Coutre, J. Nanocellulose from Nata de Coco as a bioscaffold for cell-based meat. ACS Omega 6, 33923–33931 (2021).
Fernandez, X., Monin, G., Talmant, A., Mourot, J. & Lebret, B. Influence of intramuscular fat content on the quality of pig meat - 1. Composition of the lipid fraction and sensory characteristics of m. longissimus lumborum. Meat Sci. 53, 59–65 (1999).
Frank, D., Joo, S. T. & Warner, R. Consumer acceptability of intramuscular fat. Korean J. Food Sci. Anim. Resour. 36, 699 (2016).
Corbin, C. H. et al. Sensory evaluation of tender beef strip loin steaks of varying marbling levels and quality treatments. Meat Sci. 100, 24–31 (2015).
Cheng, Y. M. et al. An immortal porcine preadipocyte cell strain for efficient production of cell-cultured fat. Commun. Biol. 2023 6, 1–13 (2023).
Yuen, J. S. K. et al. Perspectives on scaling production of adipose tissue for food applications. Biomaterials 280, 121273 (2022).
Green, H. & Meuth, M. An established pre-adipose cell line and its differentiation in culture. Cell 3, 127–133 (1974).
Wang, W. et al. Immortalization of chicken preadipocytes by retroviral transduction of chicken TERT and TR. PLoS One 12, e0177348 (2017).
Yu, X. et al. Isolation and identification of bovine preadipocytes and screening of MicroRNAs associated with adipogenesis. Animals 10, 818 (2020).
Zagury, Y., Ianovici, I., Landau, S., Lavon, N. & Levenberg, S. Engineered marble-like bovine fat tissue for cultured meat. Commun. Biol. 5, 1–12 (2022).
Dohmen, R. G. J. et al. Muscle-derived fibro-adipogenic progenitor cells for production of cultured bovine adipose tissue. npj Sci. Food 6, 1–12 (2022).
Sanosaka, M. et al. A combination of octanoate and oleate promotes in vitro differentiation of porcine intramuscular adipocytes. Comp. Biochem. Physiol. B Biochem. Mol. Biol. 149, 285–292 (2008).
Wang, X. & Moutsoglou, D. Osteogenic and adipogenic differentiation potential of an immortalized fibroblast-like cell line derived from porcine peripheral blood. Vitr. Cell Dev. Biol. Anim. 45, 584–591 (2009).
Nakajima, I. Characterization of PSPA cell differentiation,an established pig preadipocyte cell line as an in vitro model for pig fat development. Jpn. Agric. Res. Q. 49, 85–90 (2015).
Nobusue, H. & Kano, K. Establishment and characteristics of porcine preadipocyte cell lines derived from mature adipocytes. J. Cell Biochem. 109, 542–552 (2010).
Yang, J. Y. et al. Regulation of adipogenesis by medium-chain fatty acids in the absence of hormonal cocktail. J. Nutr. Biochem. 20, 537–543 (2009).
Lee, J.-E., Schmidt, H., Lai, B. & Ge, K. Transcriptional and epigenomic regulation of adipogenesis. Mol. Cell Biol. 39, e00601-18 (2019).
Linhart, H. G. et al. C/EBPα is required for differentiation of white but not brown adipose tissue. Proc. Natl Acad. Sci. USA 98, 12532–12537 (2001).
Ling, L., Nurcombe, V. & Cool, S. M. Wnt signaling controls the fate of mesenchymal stem cells. Gene 433, 1–7 (2009).
Asrih, M. et al. Role of mitogen-activated protein kinase pathways in multifactorial adverse cardiac remodeling associated with metabolic syndrome. Mediators Inflamm. 2013, 367245 (2013).
Guo, L., Li, X. & Tang, Q. Q. Transcriptional regulation of adipocyte differentiation: a central role for CCAAT/enhancer-binding protein (C/EBP). J. Biol. Chem. 290, 755–761 (2015).
Raza, S. H. A. et al. RNA-Seq reveals the potential molecular mechanisms of bovine KLF6 gene in the regulation of adipogenesis. Int. J. Biol. Macromol. 195, 198–206 (2022).
Xu, Q., Lin, S., Wang, Y., Zhu, J. & Lin, Y. Fibroblast growth factor 10 (FGF10) promotes the adipogenesis of intramuscular preadipocytes in goat. Mol. Biol. Rep. 45, 1881–1888 (2018).
Lee, H. et al. SCARA5 plays a critical role in the commitment of mesenchymal stem cells to adipogenesis. Sci. Rep. 7, 1–13 (2017).
Xu, X., Xiong, X. & Sun, Y. The role of ribosomal proteins in the regulation of cell proliferation, tumorigenesis, and genomic integrity. Sci. China Life Sci. 59, 656–672 (2016).
Kim, T.-H., Leslie, P. & Zhang, Y. Ribosomal proteins as unrevealed caretakers for cellular stress and genomic instability. Oncotarget 5, 860–871 (2014).
Andersson, N. et al. Inactivation of RB1, CDKN2A, and TP53 have distinct effects on genomic stability at side-by-side comparison in karyotypically normal cells. Genes Chromosomes Cancer 62, 93–100 (2023).
Prusty, D., Park, B. H., Davis, K. E. & Farmer, S. R. Activation of MEK/ERK signaling promotes adipogenesis by enhancing peroxisome proliferator-activated receptor γ (PPARγ) and C/EBPα gene expression during the differentiation of 3T3-L1 preadipocytes. J. Biol. Chem. 277, 46226–46232 (2002).
Perez-Riverol, Y. et al. The PRIDE database resources in 2022: a hub for mass spectrometry-based proteomics evidences. Nucleic Acids Res. 50, D543–D552 (2022).
Rajesh, R. V. et al. Proteomic analysis of bovine omental, subcutaneous and intramuscular preadipocytes during in vitro adipogenic differentiation. Comp. Biochem. Physiol. Part D. Genomics Proteom. 5, 234–244 (2010).
Wang, L. et al. Circular RNA expression profiling reveals that circ-PLXNA1 functions in duck adipocyte differentiation. PLoS One 15, e0236069 (2020).
Wang, Z. et al. The impact of NUMB on chicken abdominal adipogenesis: a comprehensive analysis. Int. J. Biol. Macromol. 278, 134904 (2024).
Yu, C. et al. Syndecan-1 facilitates the human mesenchymal stem cell osteo-adipogenic balance. Int. J. Mol. Sci. 21, 3884 (2020).
Miranda, D. A. et al. Fat storage-inducing transmembrane protein 2 is required for normal fat storage in adipose tissue. J. Biol. Chem. 289, 9560–9572 (2014).
Yu, Y. et al. Neuropilin 1 (NRP1) positively regulates adipogenic differentiation in C3H10T1/2 cells. Int. J. Mol. Sci. 24, 7394 (2023).
Yang, K. et al. Aldehyde dehydrogenase 1 a1 regulates energy metabolism in adipocytes from different species. Xenotransplantation 24, 12318 (2017).
Kang, H. W., Niepel, M. W., Han, S., Kawano, Y. & Cohen, D. E. Thioesterase superfamily member 2/acyl-CoA thioesterase 13 (Them2/Acot13) regulates hepatic lipid and glucose metabolism. FASEB J. 26, 2209–2221 (2012).
Chen, L. et al. KIAA1199 (CEMIP) regulates adipogenesis and whole-body energy metabolism. Bone Res. 13, 43 (2025).
Sleeman, M. W. et al. Absence of the lipid phosphatase SHIP2 confers resistance to dietary obesity. Nat. Med. 11, 199–205 (2005).
Mehta, F., Theunissen, R. & Post, M. J. Adipogenesis from Bovine Precursors. Methods Mol. Biol. 111–125, https://doi.org/10.1007/978-1-4939-8897-6_8 (2019).
Grygiel-Górniak, B. Peroxisome proliferator-activated receptors and their ligands: nutritional and clinical implications - a review. Nutr. J. 13, 17 (2014).
Hanhoff, T., Benjamin, S., Börchers, T. & Spener, F. Branched-chain fatty acids as activators of peroxisome proliferator-activated receptors. Eur. J. Lipid Sci. Technol. 107, 716–729 (2005).
Ding, S.-T., Wang, J.-C. & Mersmann, H. J. Effect of unsaturated fatty acids on porcine adipocyte differentiation. Nutr. Res. 23, 1059–1069 (2003).
Zomer, A. W. M. et al. Pristanic acid and phytanic acid: naturally occurring ligands for the nuclear receptor peroxisome proliferator-activated receptor. J. Lipid Res. 41, 1801–1807 (2000).
Zhang, Z. et al. Stepwise adipogenesis of decellularized cellular extracellular matrix regulates adipose tissue-derived stem cell migration and differentiation. Stem Cells Int. 2019, 1–11 (2019).
Nakajima, I., Muroya, S., Tanabe, R. & Chikuni, K. Extracellular matrix development during differentiation into adipocytes with a unique increase in type V and VI collagen. Biol. Cell 94, 197–203 (2002).
Mariman, E. C. M. & Wang, P. Adipocyte extracellular matrix composition, dynamics and role in obesity. Cell. Mol. Life Sci. 67, 1277–1292 (2010).
Sun, K., Li, X. & Scherer, P. E. Extracellular matrix (ECM) and fibrosis in adipose tissue: overview and perspectives. In Comprehensive Physiology 4387–4407 (Wiley, 2023). https://doi.org/10.1002/cphy.c220020.
Tsai, A. C., Liu, Y. & Ma, T. Expansion of human mesenchymal stem cells in fibrous bed bioreactor. Biochem. Eng. J. 108, 51–57 (2016).
Franzén, O., Gan, L. M. & Björkegren, J. L. M. PanglaoDB: a web server for exploration of mouse and human single-cell RNA sequencing data. Database 2019, baz046 (2019).
Elizarraras, J. M. et al. WebGestalt 2024: faster gene set analysis and new support for metabolomics and multi-omics. Nucleic Acids Res. 52, W415–W421 (2024).
Acknowledgements
The authors acknowledge the facilities and the scientific and technical assistance of Microscopy Australia at the Electron Microscope Unit (EMU) within the Mark Wainwright Analytical Centre (MWAC) at UNSW Sydney. The authors acknowledge using NCRIS-enabled Australian Proteome Analysis Facility (APAF) infrastructure.
Author information
Authors and Affiliations
Contributions
A.B.G. conceptualised the study, designed and performed experiments, collected and analysed data, drafted and edited the manuscript. L.D.W.L. analysed the RNA sequencing and proteomics data and contributed to manuscript review and editing. J.M.B. performed SEM microscopy. M.S.R. assisted with sample collection and processing and guided the study. J.L.C. secured funding, conceptualised the study, and contributed to manuscript drafting, review, and editing. All authors read and approved the final manuscript.
Corresponding author
Ethics declarations
Competing interests
The authors declare no competing interests.
Additional information
Publisher’s note Springer Nature remains neutral with regard to jurisdictional claims in published maps and institutional affiliations.
Supplementary information
Rights and permissions
Open Access This article is licensed under a Creative Commons Attribution-NonCommercial-NoDerivatives 4.0 International License, which permits any non-commercial use, sharing, distribution and reproduction in any medium or format, as long as you give appropriate credit to the original author(s) and the source, provide a link to the Creative Commons licence, and indicate if you modified the licensed material. You do not have permission under this licence to share adapted material derived from this article or parts of it. The images or other third party material in this article are included in the article’s Creative Commons licence, unless indicated otherwise in a credit line to the material. If material is not included in the article’s Creative Commons licence and your intended use is not permitted by statutory regulation or exceeds the permitted use, you will need to obtain permission directly from the copyright holder. To view a copy of this licence, visit http://creativecommons.org/licenses/by-nc-nd/4.0/.
About this article

Cite this article
Goswami, A.B., Luu, L.D.W., Biazik, J.M. et al. Unravelling bovine preadipocyte differentiation and their three-dimensional cultivation for cellular agriculture. npj Sci Food 9, 253 (2025). https://doi.org/10.1038/s41538-025-00616-3
Received:
Accepted:
Published:
Version of record:
DOI: https://doi.org/10.1038/s41538-025-00616-3
